Connectors: Elastic/Kibana
Legacy Documentation
You're viewing legacy documentation for API Fortress (deployed via an on-premises container). To view documentation for the new SaaS version of API Fortress — now known as Sauce Labs API Testing and Monitoring (with Sauce Connect tunnels) — see API Testing on the Sauce Labs Cloud.
Using the Elastic connector you can send failure information to Elasticsearch then use that data to create visualizations in Kibana.
Below is a quick guide to setting up and using the Elastic connector.
This connector does not come pre-loaded out of the box, and will need to be loaded separately. To learn how to load the connector into your API Fortress instance click here.
Configure the Connector
- Access the company dashboard by clicking the gear icon in the top right corner
- Select "Alert groups"
- Create a new alert group if you don’t have already one for this purpose
- Select the socket icon
- Select "+ Connector to this group"
- Select "Elastic" from the list
- Enter the required settings
- username: The username for basic authentication
- password: The password for basic authentication.
- baseUrl: The url to the Elasticsearch engine
- Save
- From the main dashboard, edit the “Settings” the project(s) you want to assign the alert group to if the group has not been assigned yet
Example Use Case
Sample Data:
Below is a sample of the data that will be pushed into Elasticsearch:
{
"date": "2017-12-29T14:36:31+0000",
"eventId": "5a4aa0a1-d071-4a05-981d-ff57e4ff3897",
"test": {
"name": "book",
"id": "123a"
},
"value2": "fake project",
"value1": "book",
"companyName": "fake company",
"eventType": "failure",
"criticalFailures": [
{
"action": "get",
"expression": "get http://www.example.com",
"status": "Generic Failure",
"failureType": "MissingPropertyException",
"extra": "Error parsing URL. Missing variable yay"
}
],
"companyId": 1,
"failuresCount": 1,
"location": "Ashburn,Virginia",
"projectName": "fake project",
"projectId": 1
}
Sample Visualization:
Once the data is in Elasticsearch, you can pull that data into Kibana and create visualizations for it. You can create many things using the data in the JSON above.
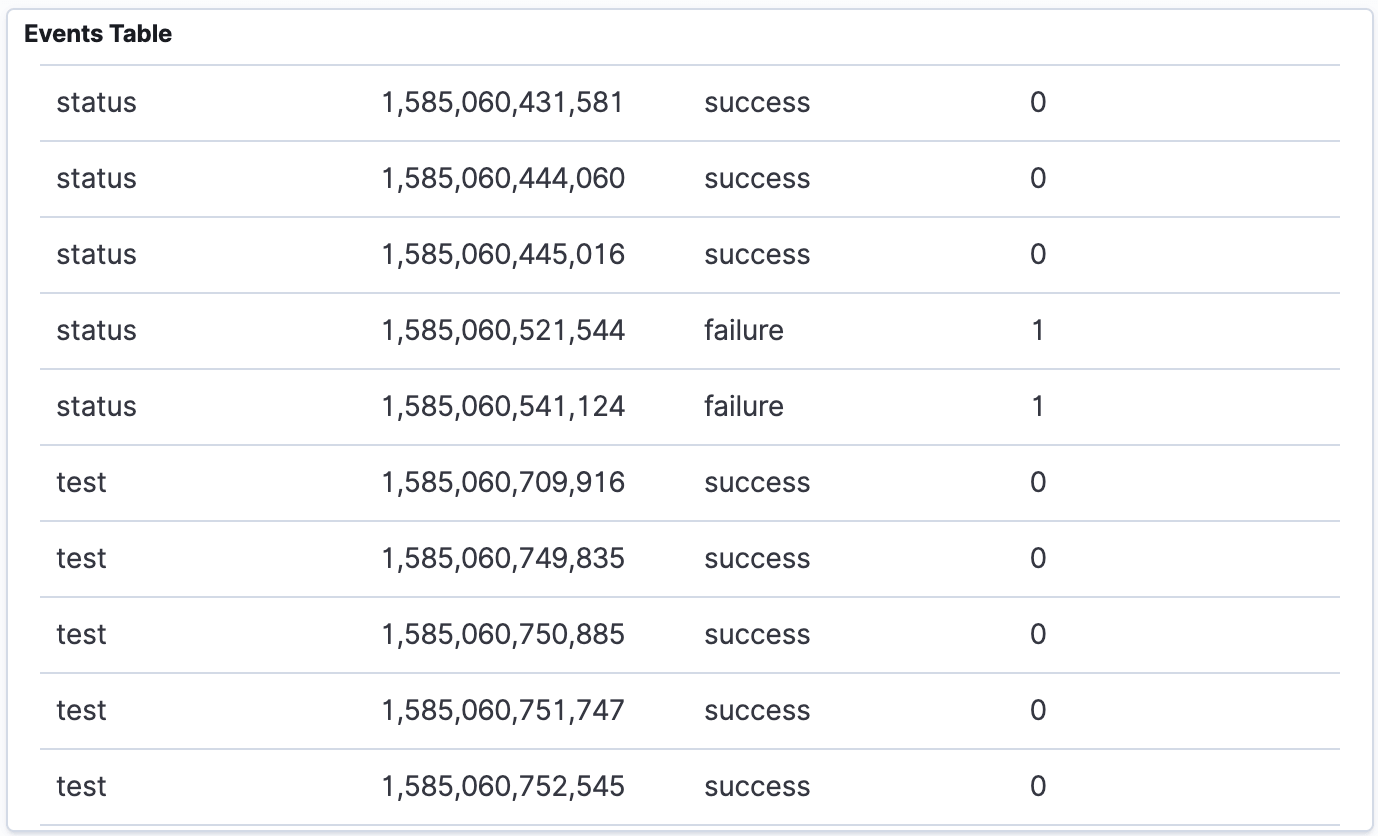
For example you could create a table to show all the test executions and their success or failure like so:
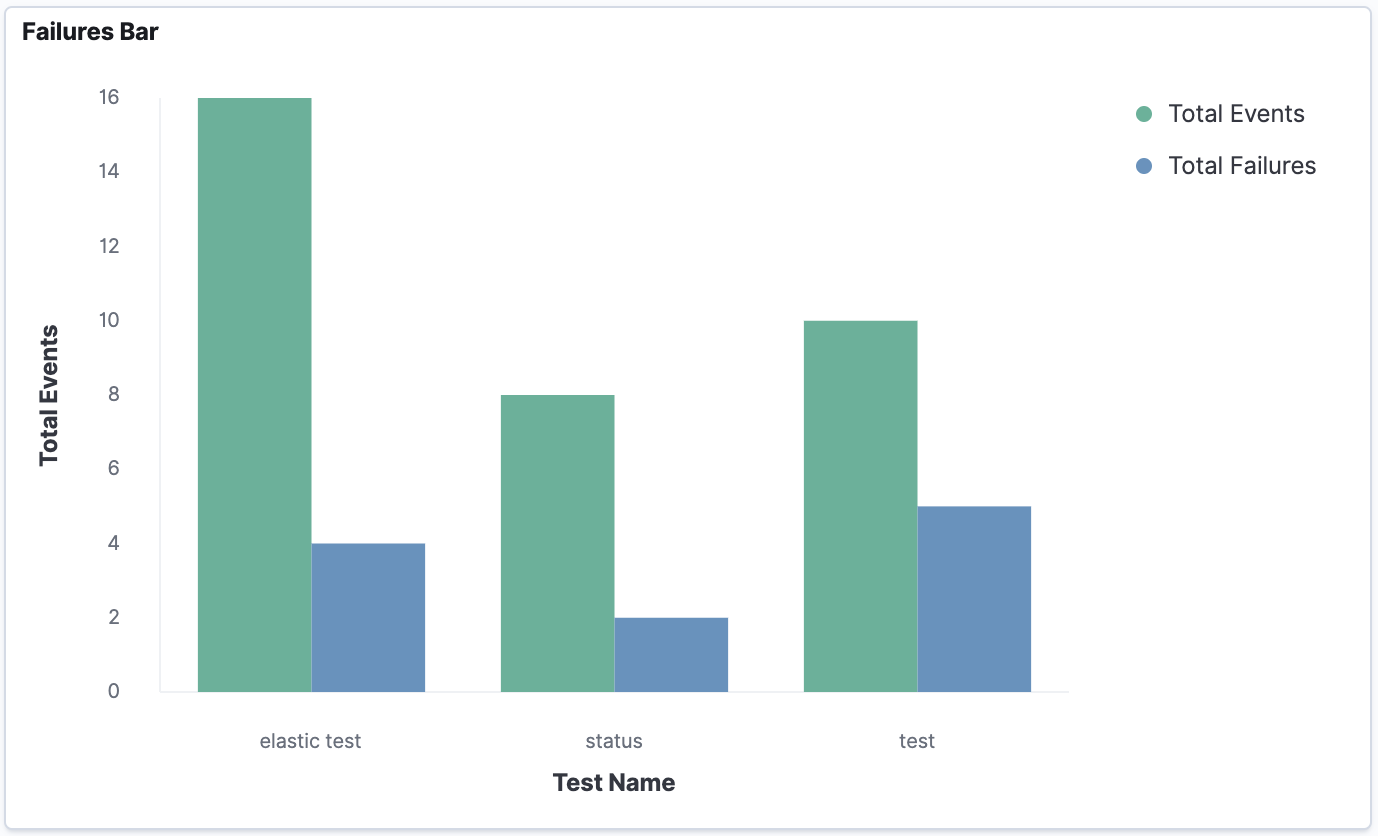
You can also chart the events and failures on a graph like this:
Then put it all together in a dashboard to make it really easy to monitor and track your test executions:
