Reports
The Reports page displays reports for your projects, test suites, and test cases. To view the relevant information, in the dropdown box, select Project, Test Suites, or Test Cases.
There are two options for viewing report dates: Actual Date (Default) and Relative Date. The actual date is the date the report was created, while the relative date is the time since the report was created.
To download the information on the Reports page, click the Download button and then click Download CSV or Download XLSX.ß
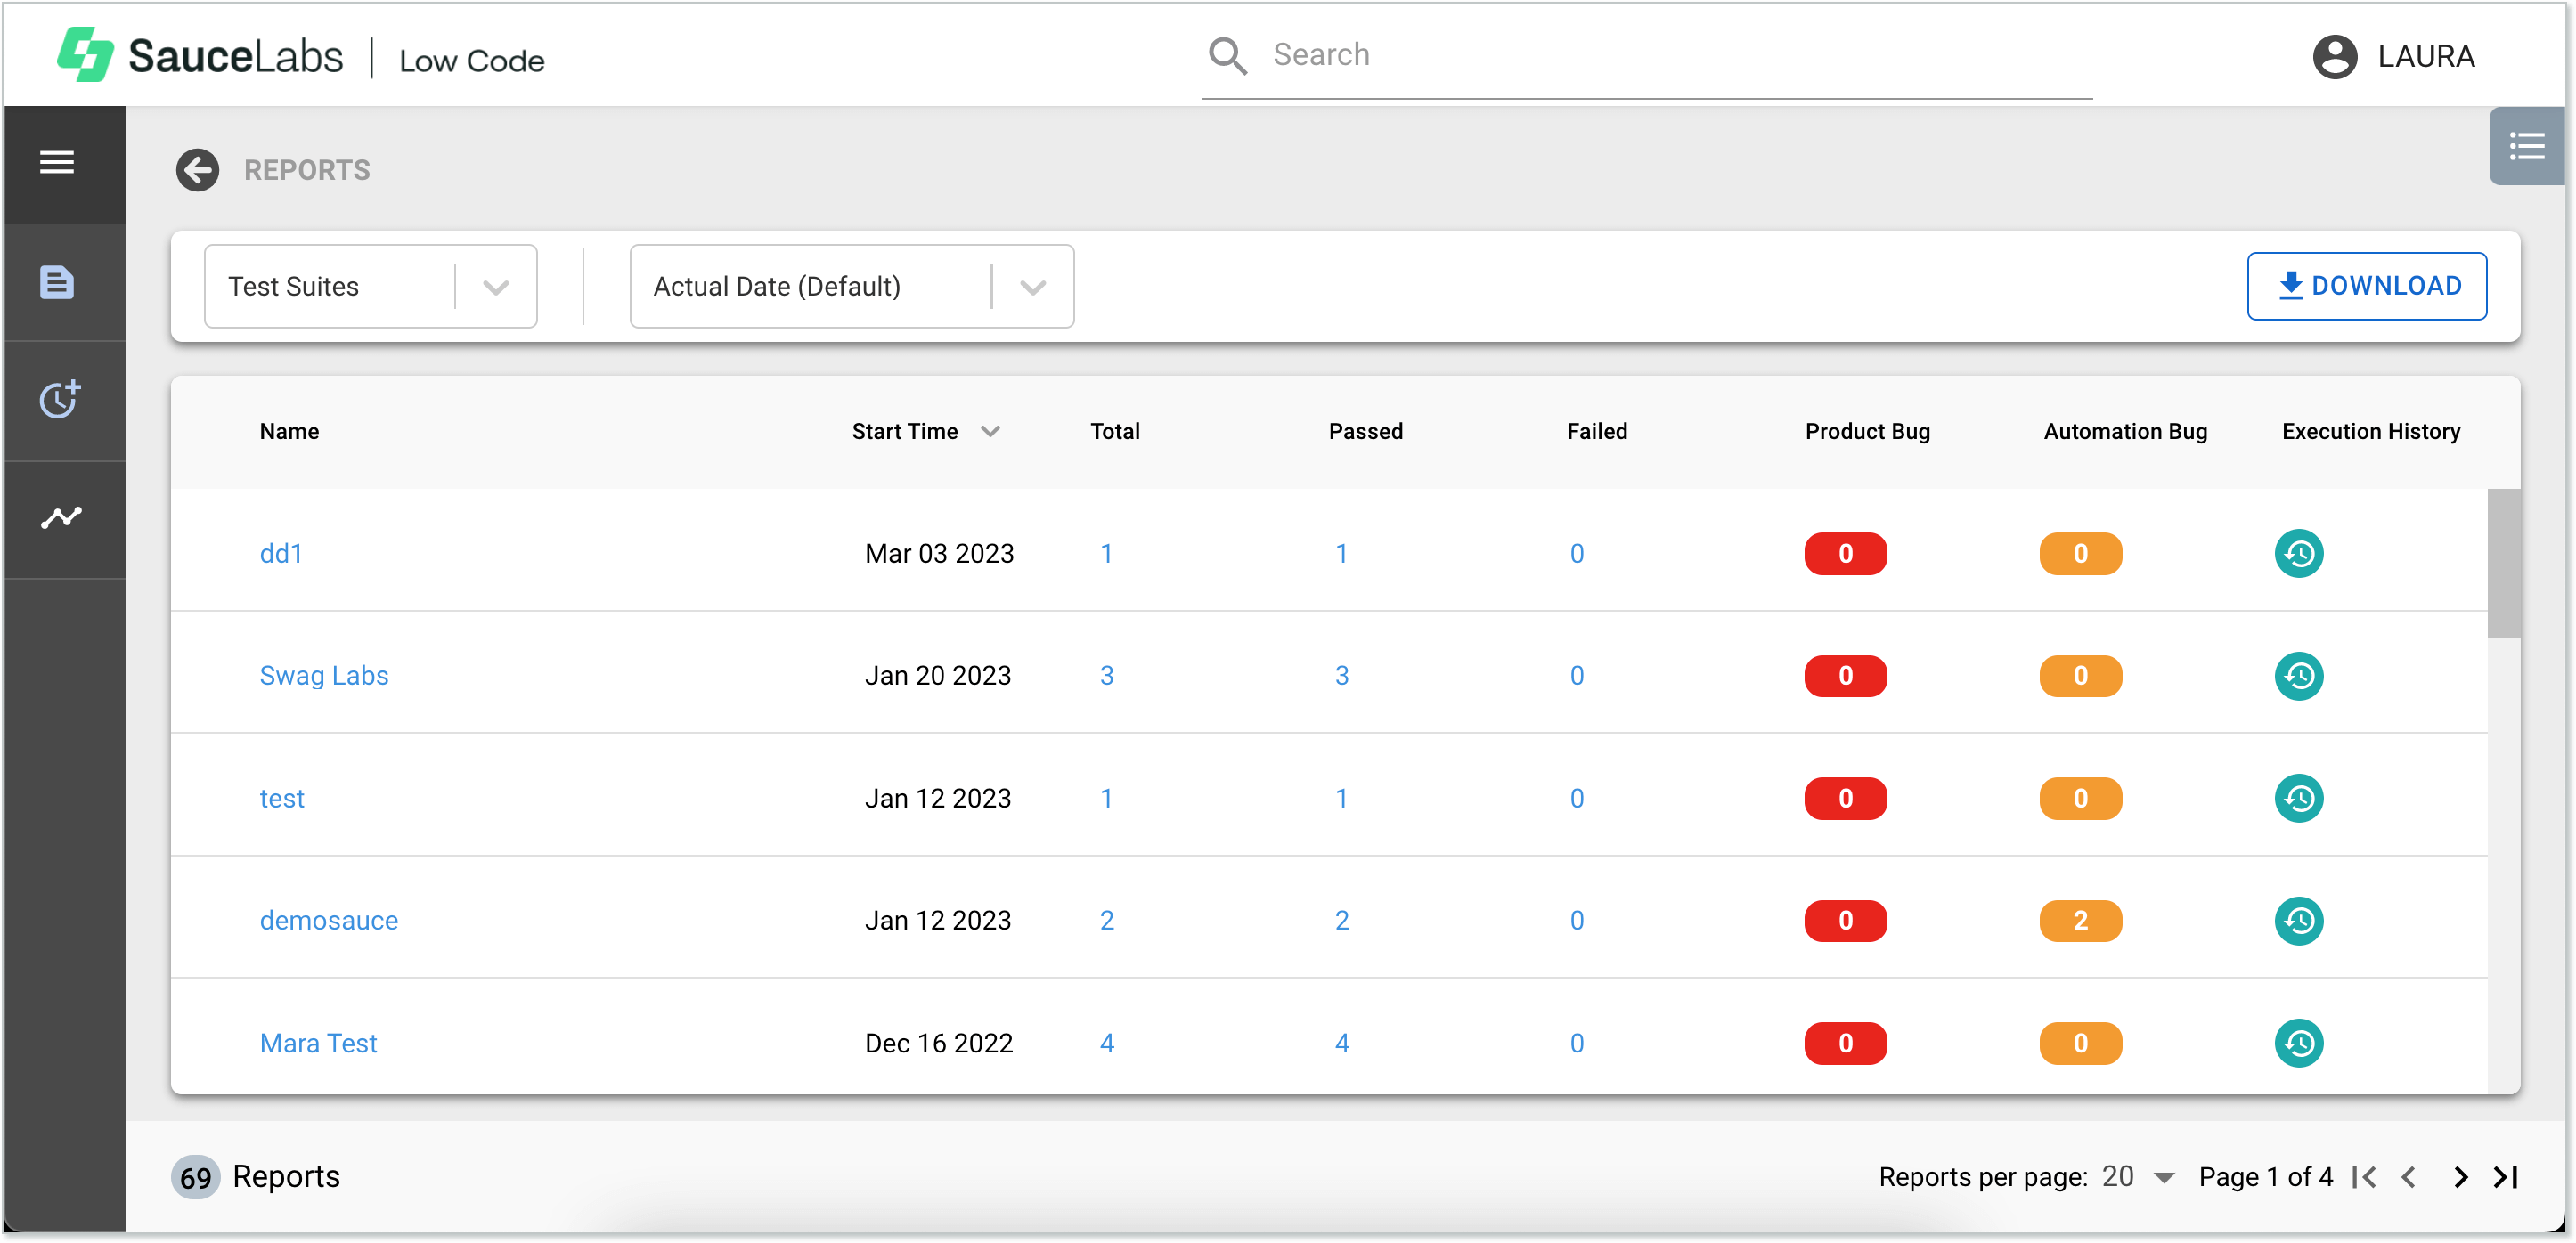
Reports Page Columns
| Column | Description |
| Name | The name of the project, test suite, or test case the report is for. Click the up or down arrow next to the column name to sort the table by name. |
| Start Time | Actual Date (Default) - The date the report was created. Relative Date - The time since the report was created. Click the up or down arrow next to the column name to sort the table by date. |
| Total | The total number of tests run in the project, test suite, or test case. Click the up or down arrow next to the column name to sort the table by total number of tests. |
| Passed | The number of tests that were run that passed. Click the up or down arrow next to the column name to sort the table by the number of tests that passed. |
| Failed | The number of tests that were run that failed. Click the up or down arrow next to the column name to sort the table by the number of tests that failed. |
| Product Bug | The number of product bugs that were found. |
| Automation Bug | The number of automation bugs that were found. |
| Execution History | Clicking the Execution History button opens the Execution History page. See Execution History Page for more information. |