Analyzing Performance Results
Every time you run a performance test, whether it is through an automation script testing page load or motion effects, the results of the test are compiled and displayed on Sauce Labs, and available to all members of your team for analysis and debugging.
Viewing Performance Results in Sauce Labs
From your Sauce Labs Test Results page, chose one of your completed Performance tests for an overview of its results.
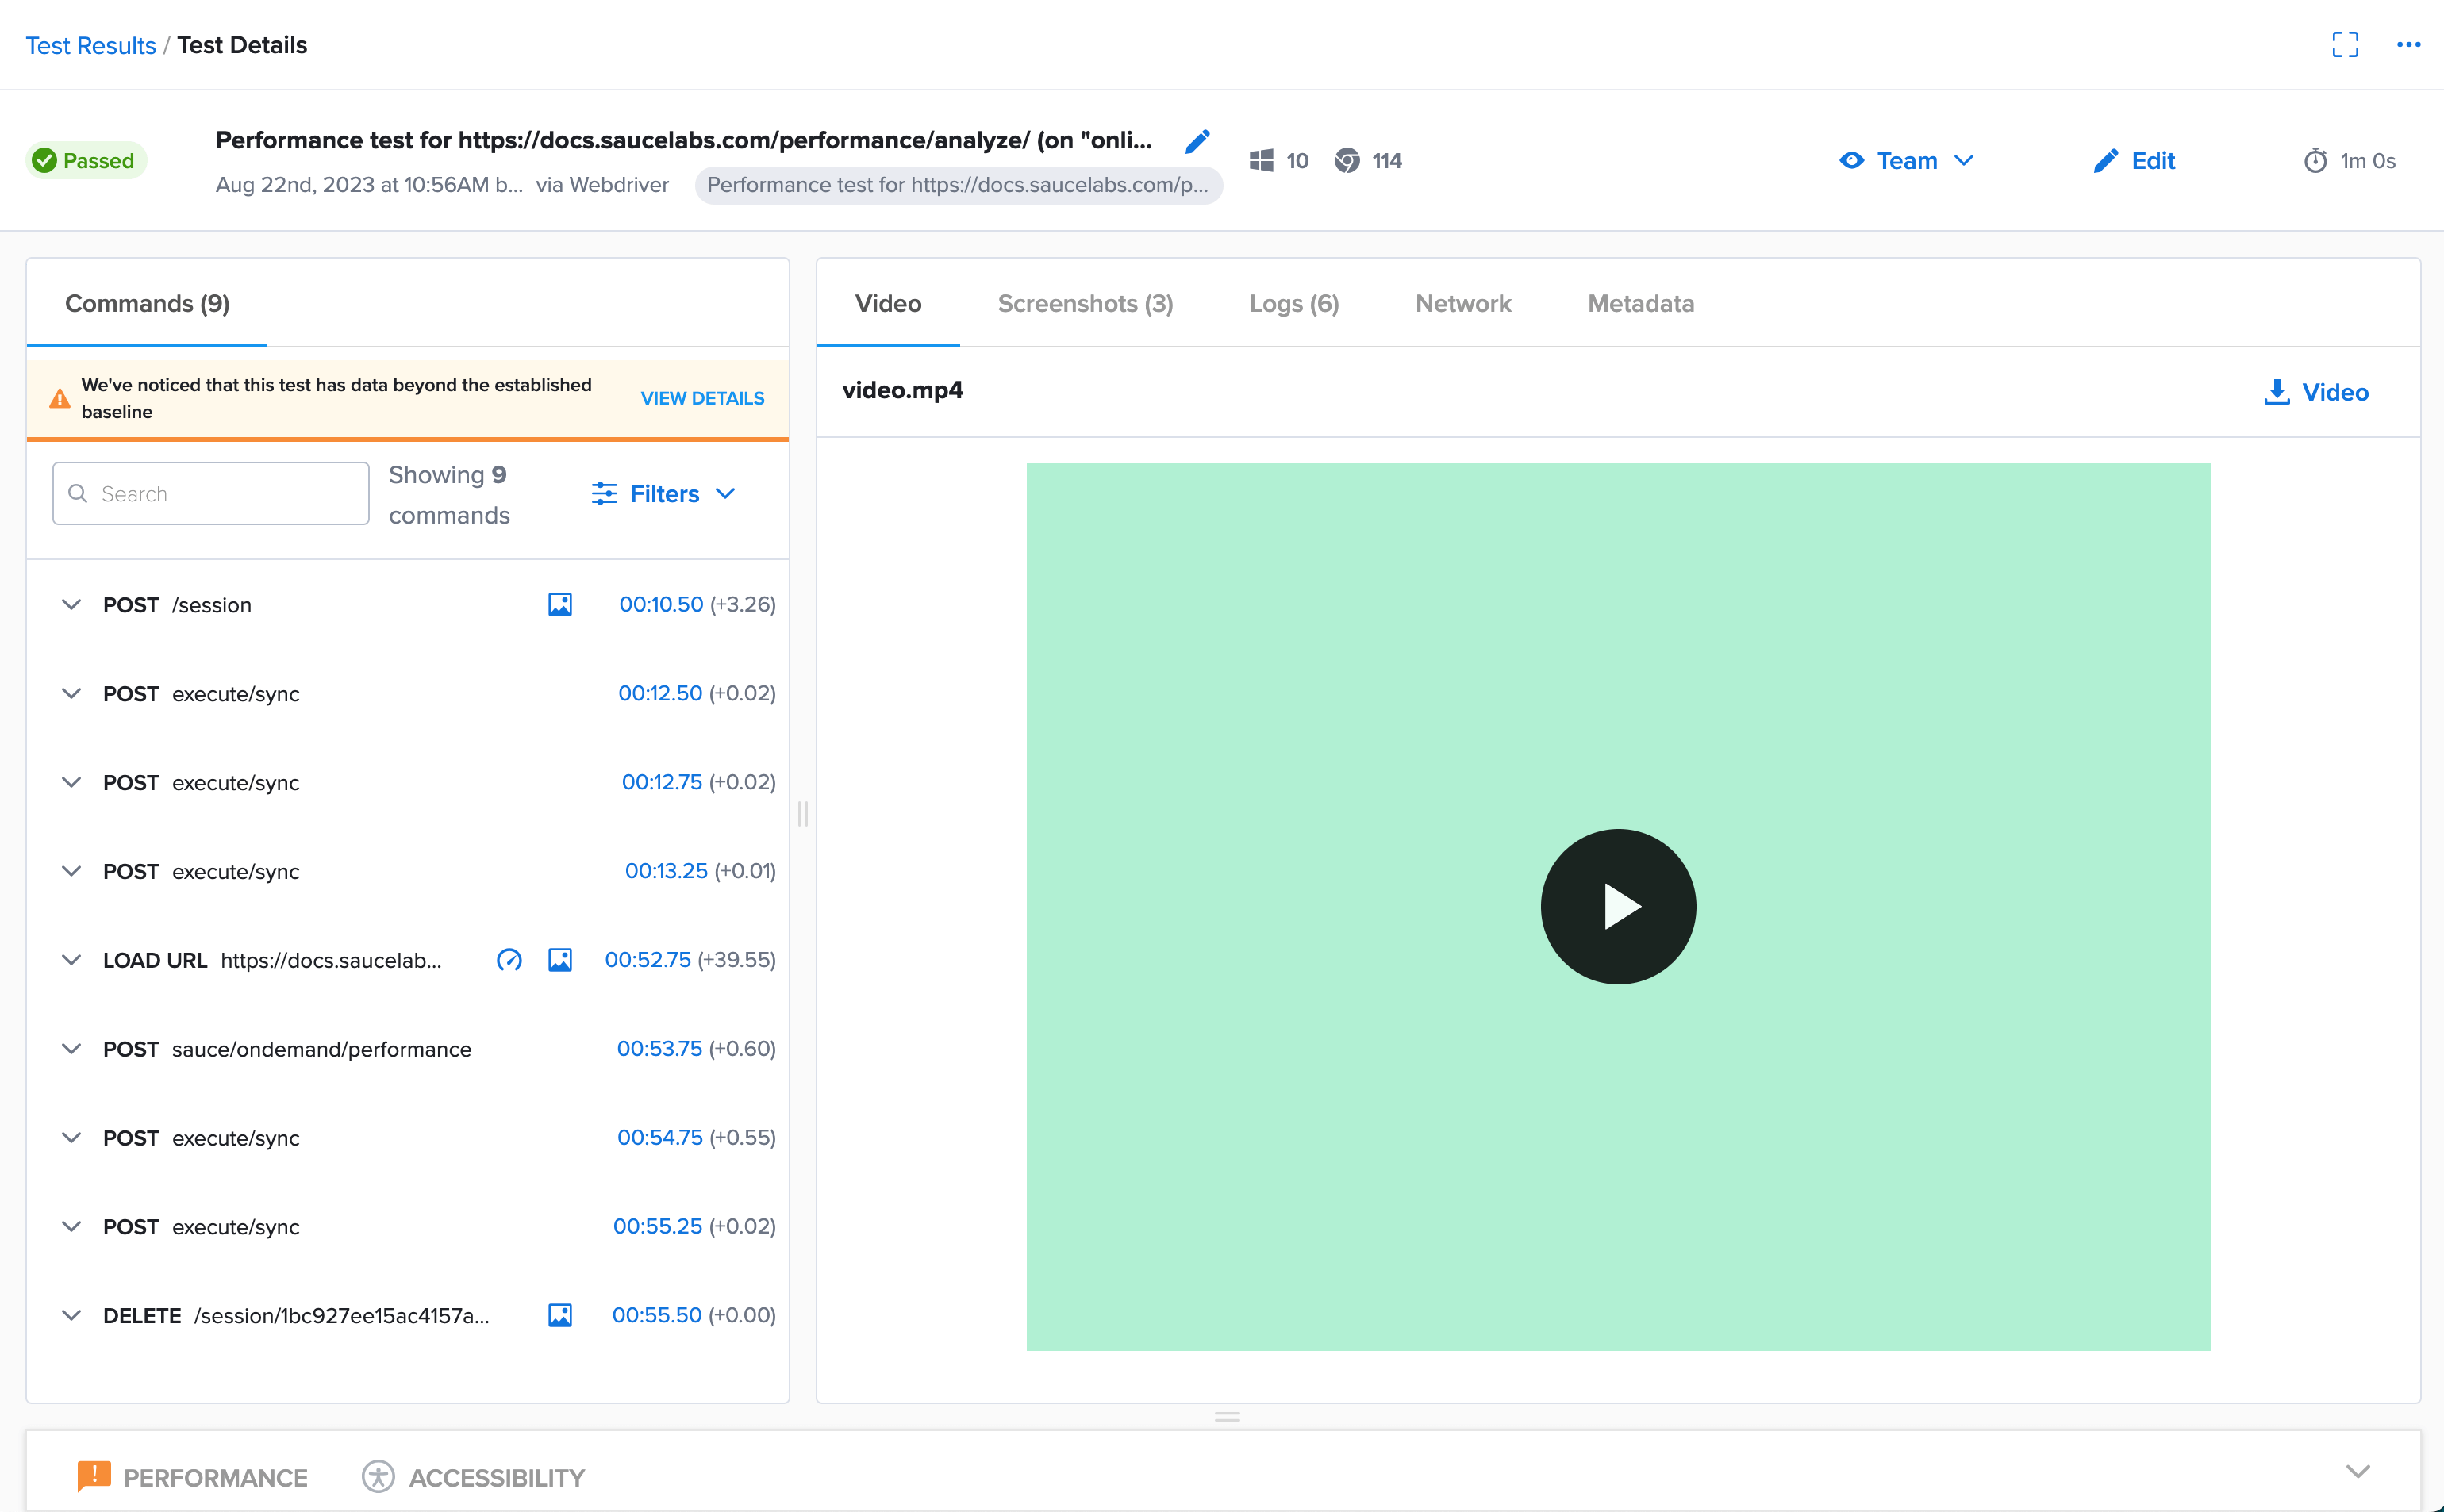
From here, you can drill into a variety of specific details about the test:
- Play the video of the test execution.
- Click the tabs to see data about the test:
- The Commands tab shows you the script associated with each test transition.
- The Video tab shows you the video of the test execution.
- The Screenshots tab shows the screenshot captured of the test session.
- The Logs tab lets you see the log data captured for the test and download the
json.logfile. - The Network tab shows you all the requests the test has made.
- The Metadata tab shows you the basic identity of the test, such as the Job ID, Name, and Build, which you may need to use if you are using this data in API calls or other testing.
- At the bottom of the interface, click the Performance tab for a score overview and access to the Performance Report.
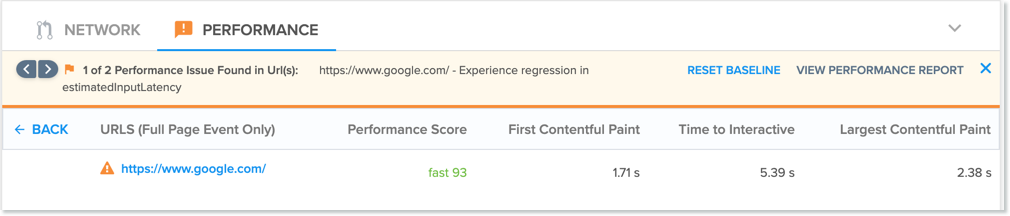
Resetting Baselines for a Failed Test
When you expand the Performance tab, if any of the metrics in your test fall outside the established baseline, this is where you have the option to reset the baseline if you wish.
Opening the Performance Report
The full Performance Report gives you more detail about the results of your test and its statistics tracked over time.
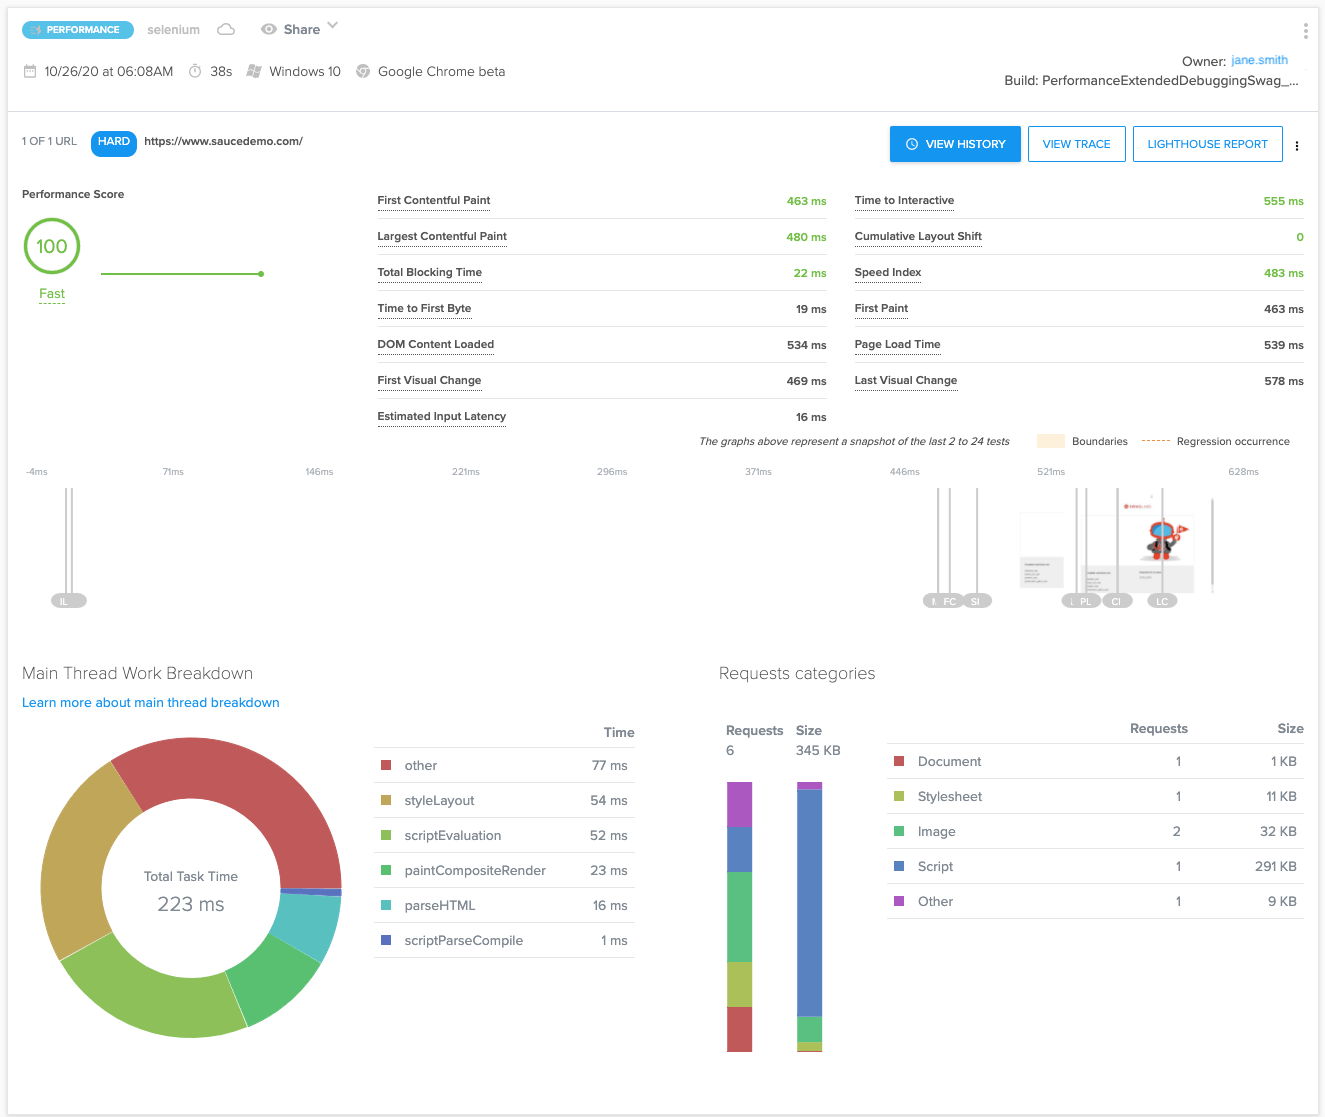
In this view, you can see the overall score for the test, plus individual scores for each metric measured in the test.
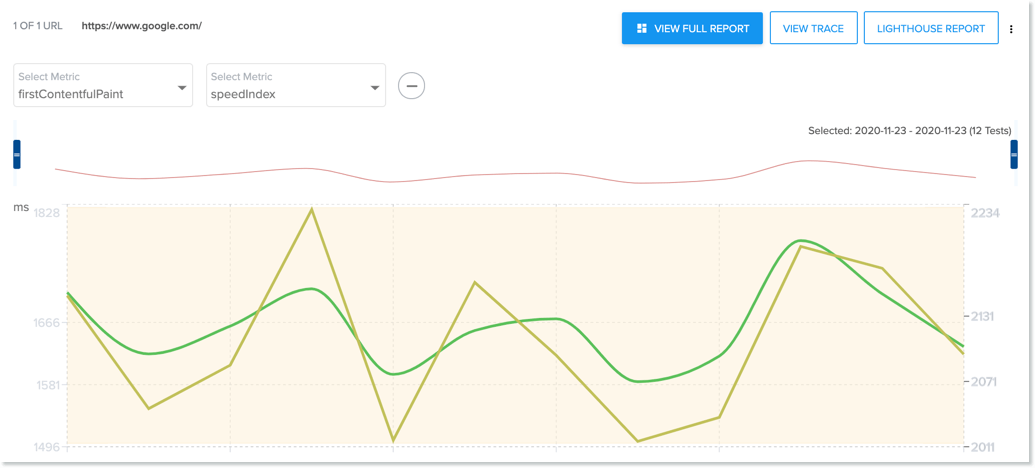
You can click on any of the individual metrics to see a popup graphical representation of that metric's historical
performance. You can then click the View History link within the popup window to bring up an interactive view of
that graph in which you can hover over the graph to see values for that metric each time the test has been run. Use
the drop down menu at the top left of the window to see the history graph for a different metric, or click the +
icon to show the graphs for two metrics concurrently, as illustrated in the following image.
Performance Score
A performance score is a rating between 0 and 100 indicating how well your page is performing compared to the industry standard. 0 is the lowest possible score and indicates a serious performance issue, while 100 indicates a top-performing app.
The metric is similar to the performance score you can find in a Google Lighthouse Report. The scoring distribution is a log-normal distribution derived from the performance metrics of real website performance data on HTTPArchive.
The color-coding maps to these Performance score ranges:
- 0 to 49 (slow): Red
- 50 to 89 (average): Orange
- 90 to 100 (fast): Green
Ref: https://web.dev/performance-scoring/#lighthouse-6
The score is a weighted average between:
- First Contentful Paint
- Speed Index
- Largest Contentful Paint
- Time to Interactive
- Total Blocking Time
- Cumulative Layout Shift
See Metric Values for definitions of each metric.
Viewing the Trace Report
Another useful tool that is accessible from the Performance Report is the Trace Report. Click the View Trace button in the top right of the Performance Report screen to open the Chrome DevTools webpage showing the JavaScript method signatures in a hierarchical view for each thread in each process.
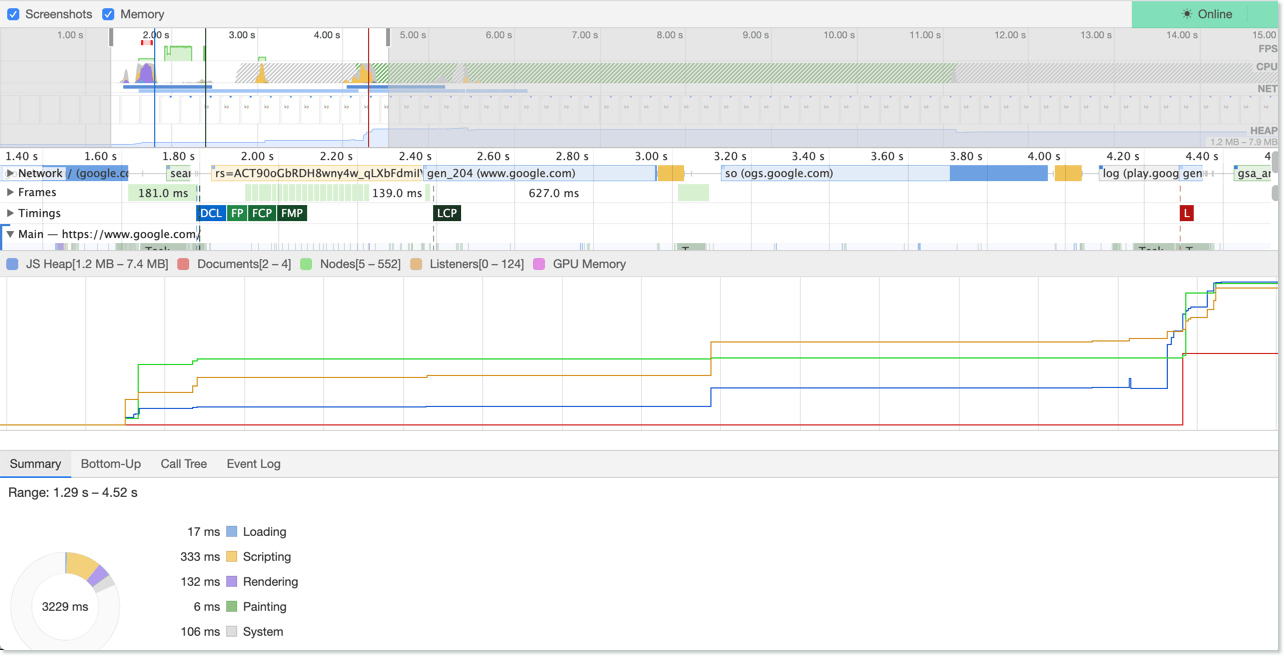
The Trace Report contains information on everything that happened during the capturing process so you can get a better idea of how the Chrome browser is interacting with your website. You can inspect when JavaScript functions are being executed or when network requests are being made. The view is completely interactive so you can tailor the data displayed in a variety of ways to help you determine, for example, which JavaScript function has been blocking the main thread of the browser, causing a slow page load.