Measuring On-Page Motion Effects
In addition to testing the efficiency of your app rendering, Sauce Labs also provides a means for testing how a single page performs in motion, such as while scrolling or tabbing.
What You'll Learn
- What is jankiness
- How to measure jankiness with Sauce Performance
- How to review jankiness results
What You'll Need
- Google Chrome (no older than 3 versions from latest)
- Test configuration must have performance enabled. See Set Performance Capabilities for instructions.
Performance testing is not compatible with WebDriver BiDi at this time. If you are using Selenium, avoid setting
webSocketUrl: true in your capabilities. For recent versions of WebdriverIO, you must force WebDriver Classic by
setting 'wdio:enforceWebDriverClassic': true in your top-level capabilities.
What is Jankiness?
Web apps sometimes appear to lack smoothness when the app isn't keeping up with the refresh, a condition sometimes referred to as jankiness.
According to jankfree.org:
Jank is any stuttering, juddering or just plain halting that users see when a site or app isn't keeping up with the refresh rate. Jank is the result of frames taking too long for a browser to make, and it negatively impacts your users and how they experience your site or app.
View an example of jankiness.
Implementing the Jankiness Custom Command
Since Jankiness occurs during interaction with a page (such as scrolling) rather than just at page load, Sauce Labs created a framework-agnostic custom command that executes a set of automation actions:
- It jumps to the top.
- It scrolls slowly from the top to the bottom for ~5 seconds.
- It captures the browser activity for the time it was scrolling through the app.
- Based on this browser activity it generates the metrics you can use to assert the performance.
Command
The jankiness custom command is a WebDriver extension that can be used with any framework (i.e., Selenium or WebdriverIO). Alternatively, you can call is using the JS Executor.
const jankiness = browser.execute('sauce:jankinessCheck')
Assertion
Use the command assertion in your script to generate an overall jankiness score based on the measurement.
const assert = require('assert')

describe('test the jankiness', () => {
    it('tests for the smoothest experience', () => {
        browser.url('https://googlechrome.github.io/devtools-samples/jank/')

        const addBtn = $('.add')
        for (let i = 0; i < 10; i += 1) {
            addBtn.click()
        }

        const jankiness = browser.execute('sauce:jankinessCheck')
Results
The command plus assertion returns a JSON object detailing a series of metric scores. Refer to Jankiness Metrics for a description of the captured diagnostics.
Reporting Jankiness
When your test completes, it generates a set of metrics and that you can access through the Performance tab of the Test Details page. If you detect a regression in your website's performance, you can download a Full Trace report, or you can use the Chrome DevTool, which records Javascript method signatures in a hierarchical view for each thread in each process, to get a better idea of how the Chrome browser is interacting with your website.
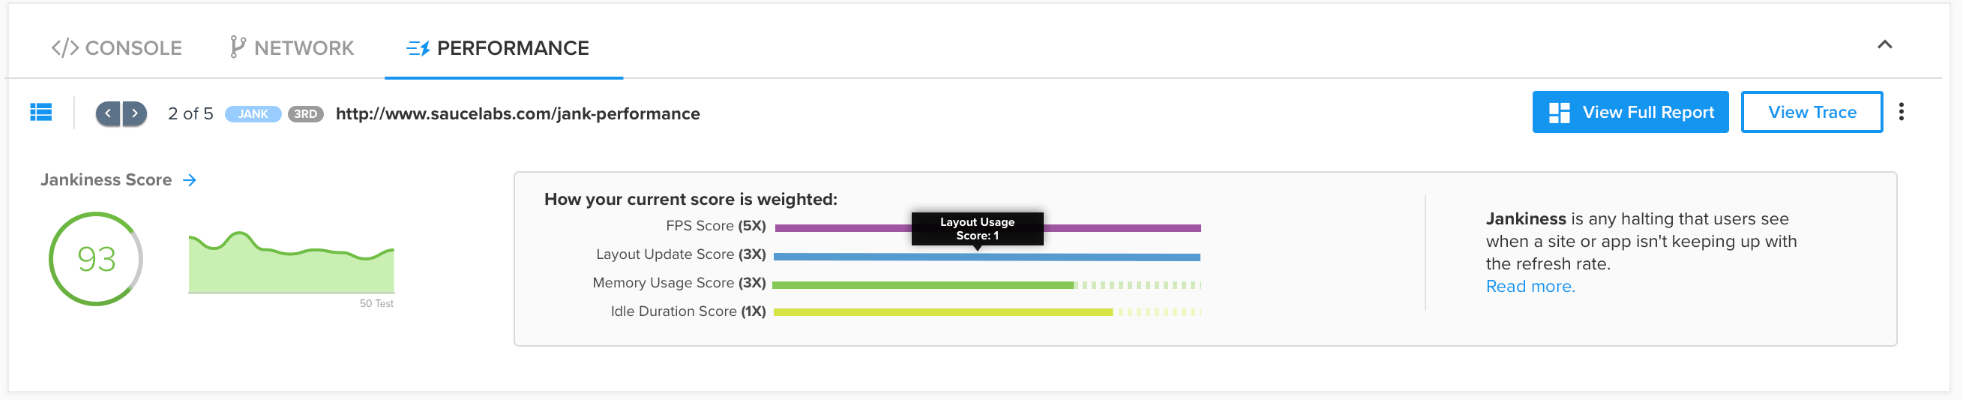
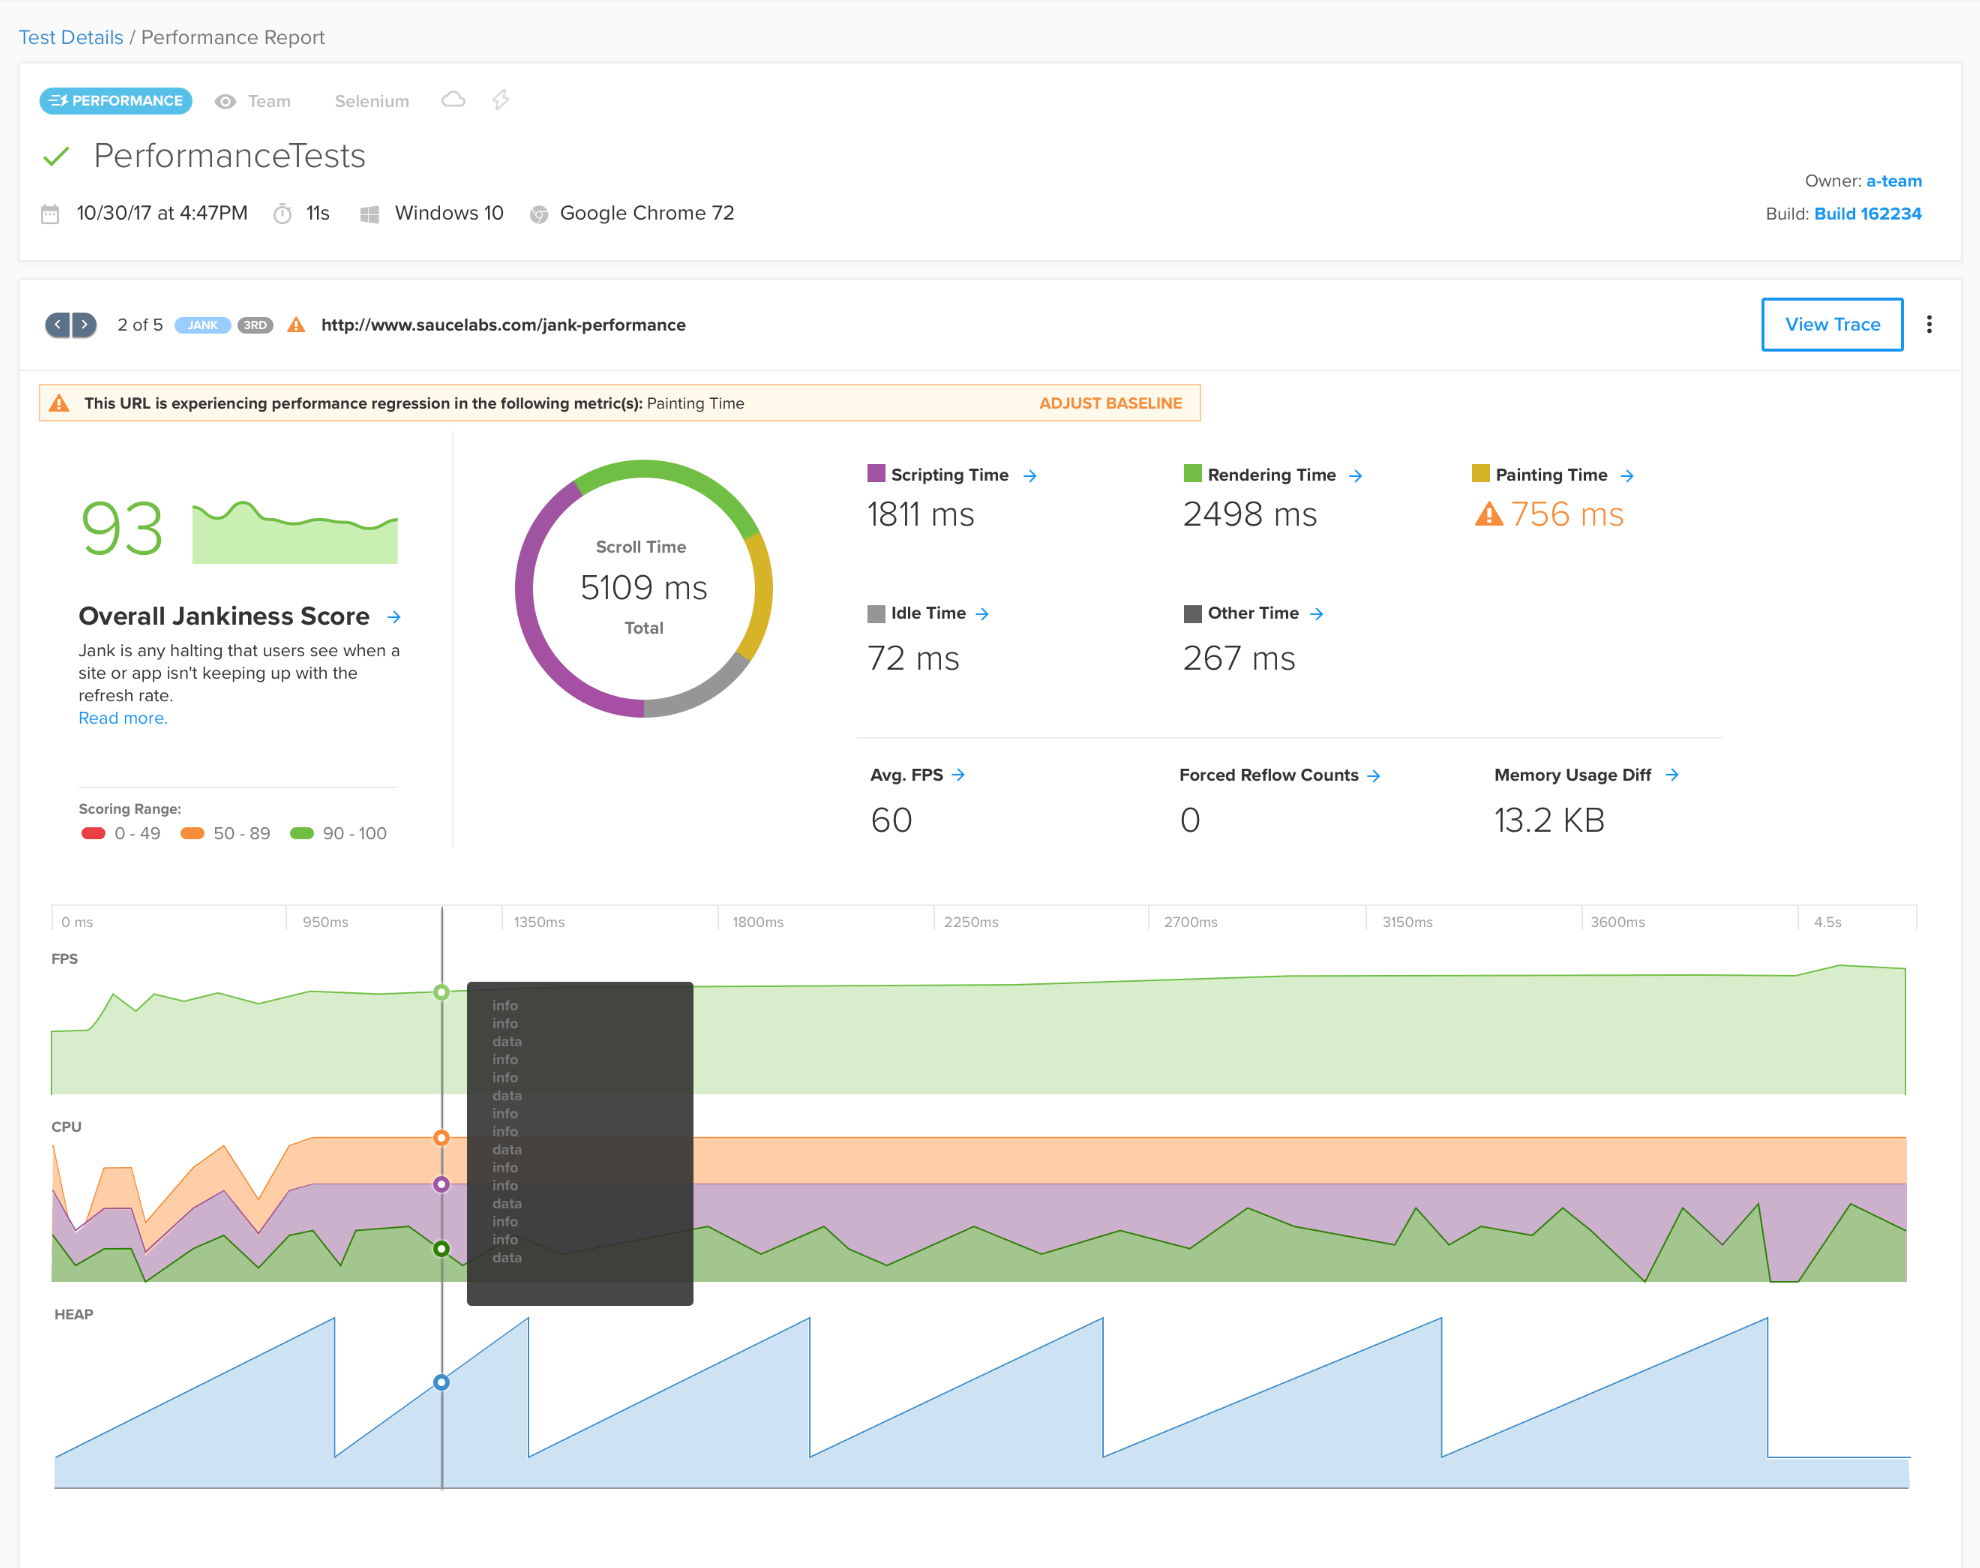
Click the View Full Report button to see additional details, including area charts showing the Frames Per Second (FPS) CPU and Heap memory used during the jankiness test.
Jankiness Metrics
The metrics that define whether a user's interaction with a page produces smooth movement are different from those that measure the speed at which objects on a page load. The objective of this page is to help you understand the metrics that make up the jankiness score.
- Frame Rate
- Browser Workload
- Forced Style Reflows
- Memory Consumption
Here is an example showing the output of jankiness results:
{
    "metrics":{
        "averageFPS":30.37006789013138,
        "scriptingTime":713,
        "renderingTime":45,
        "otherTime":1598,
        "idleTime":2122,
        "forcedReflowWarningCounts":440,
        "scrollTime":5210,
        "paintingTime":732,
        "memoryUsageDiff":-2964452
    },
    "diagnostics":{
        "layoutUpdateScore":0.9869911007302723,
        "fpsScore":0.5061677981688564,
        "idleDurationScore":0.4072936660268714,
        "memoryUsageScore":1
    }
},
"score":0.6428077742596429,
"loaderId":"b0099410-e521-11e9-b752-8375edd9807f",
"type":"scroll"
Each of the individual metrics in the score is part of a larger diagnostic category that is scored according to its impact on the smoothness of the page: 1 indicates no negative impact and any score between 0 and 1 indicates performance impact. The scores in each of the 4 diagnostic categories are used to generate an overall performance score that can be used to assert against the Jankiness of the app based on standard tolerance.
Frame Rate
The frame rate, or frames per second (fpsScore) captures any sort of stuttering on the page. The minimum FPS value
to achieve a smooth experience for the user is 60 FPS. As you can see in the example, the averageFPS metric of
30.4 in this test produces an FPS score of 0.5, which is essentially 50% of the standard.
Browser Workload
The idleDurationScore represents the extent to which the browser is using resources to redraw content as the page
moves, which influences the overall performance. The score is based on the metric results for:
renderingTimepaintingTimescriptingTimeotherTime(e.g., network requests, etc.)idleTime
Forced Style Reflows
The layoutUpdateScore represents unnecessary rendering or painting work, also called layoutThrashing. This is
often caused by certain scripting practices that specify attributes that were already encapsulated in a defined
style, which causes objects that are already rendered to be recalculated, which is a common performance bottleneck.
The following articles include helpful information about designing your layout for performance optimization:
Components of Layout Reflow and Layout Web Performance.
Memory Consumption
The memoryUsageScore is based on a measurement of how the used memory changes from the beginning of the test
command to the end. If the garbage collector does not adequately clear variables and other data, it can impact the
performance of the browser so that handling user input is delayed.