Stadia Integration Guide
Backtrace supports the ingestion of crash reports from Google Stadia.
This integration guide provides instructions using the Google Cloud Console, Google Cloud Shell, or command-line tools (gcloud, gsutil, ggp).
What You'll Need
- Google Cloud Console access and the ability to use the web console or command-line tools.
- Google Cloud project_id, cloud storage bucket name, Pub/Sub name, and your Service Account Key JSON file. These can be configured through the user interface, but this guide provides command-line invocations for convenience.
- A Backtrace instance to which Stadia game crashes are pushed.
Setup and Installation
The following are detailed setup instructions.
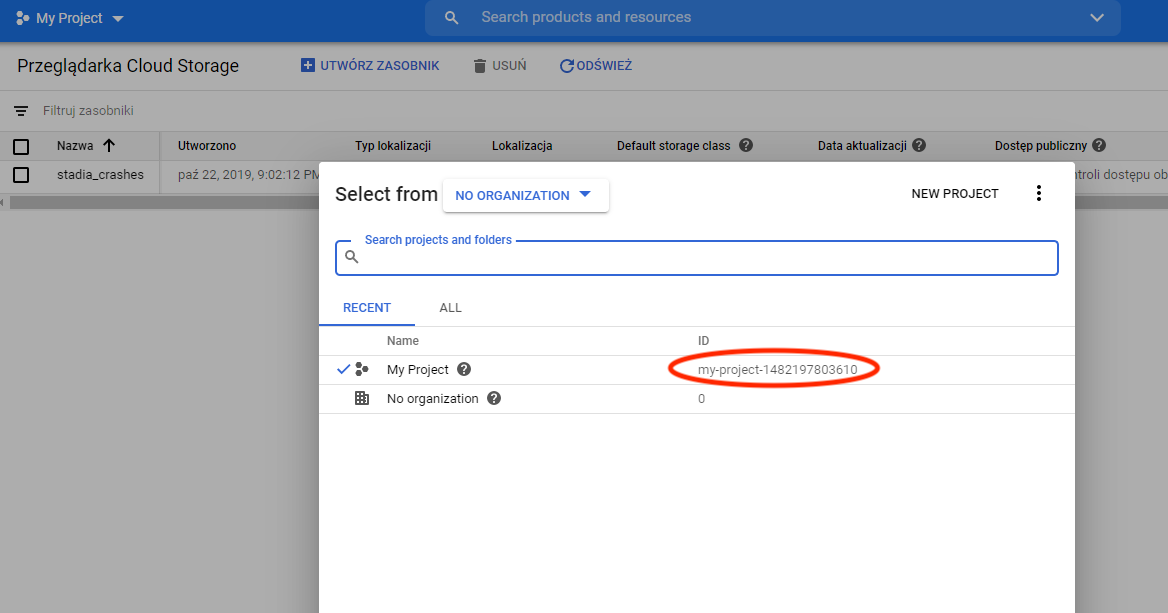
1. Configure Stadia Title to Route Crashes to Google Cloud Storage
Follow the instructions in the Google Cloud Develop Stadia Get Crash Reports documentation to create or use an existing Cloud Storage Bucket. Retrieve the project_id (shown in the screenshot below) and the bucket name in use. Make a note of this information for later reference.
2. Configure Google Cloud Storage Topic
Use the gsutil command-line tool to set up a new Topic where Cloud Storage posts a notification for every new object created (finalized) in the Cloud Storage bucket. Use the command below to create a bucket:
gsutil notification create -t <topic> -f json -e OBJECT_FINALIZE gs://<bucket>[/<optional folder>]
Use the gcloud pubsub command to create a Pub/Sub subscription for the topic. See the invocation below:
gcloud pubsub subscriptions create <subscription_name> --topic=<topic>
Remember the Pub/Sub Subscription name you specified and make a note of it for later reference.
3. Create a Service Account Key Credential in Google Cloud
Navigate to API & Services > Credentials UI > Create Credentials > Service Account Key in the Google Cloud Console to start the process. Choose New service account and specify a Service account name. Select the following roles: Storage > Storage Admin Pub/Sub > Pub/Sub Subscriber Pub/Sub > Pub/Sub Viewer.
Specify the Key type as JSON and click on Create. Google saves a .json file to your desktop. Remember the location of this file as you will need it in the next step.
4. Configure Backtrace Data Source with the Recorded Information
Go to Project Settings > Error Submission > Data Sources in Backtrace.
Upload the .JSON file so that the Backtrace system can properly authenticate it.
Fill in the
project_id,bucket_name, andsubscription_namethat were created in the previous steps.Save the data source, and Backtrace ingests any new crashes received. You can also use the Data Source to download historical data.
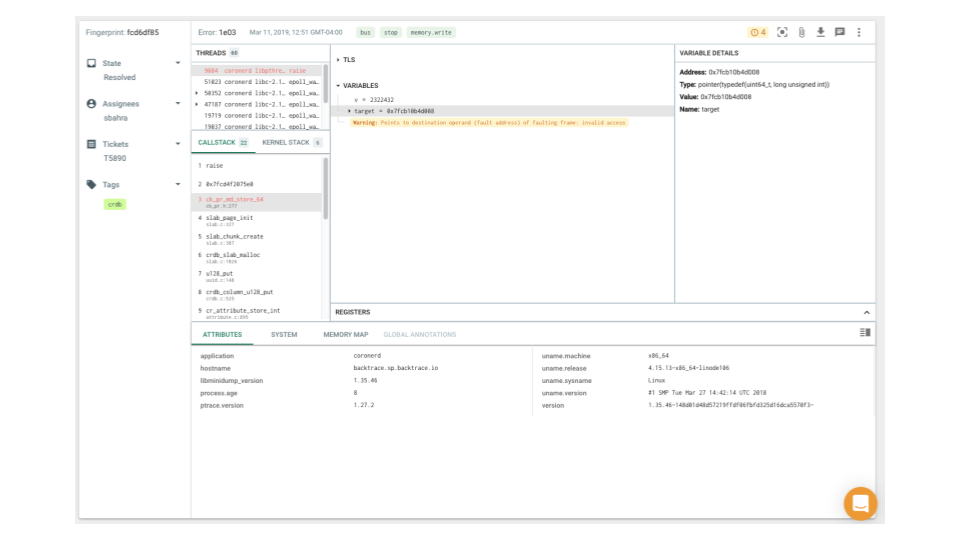
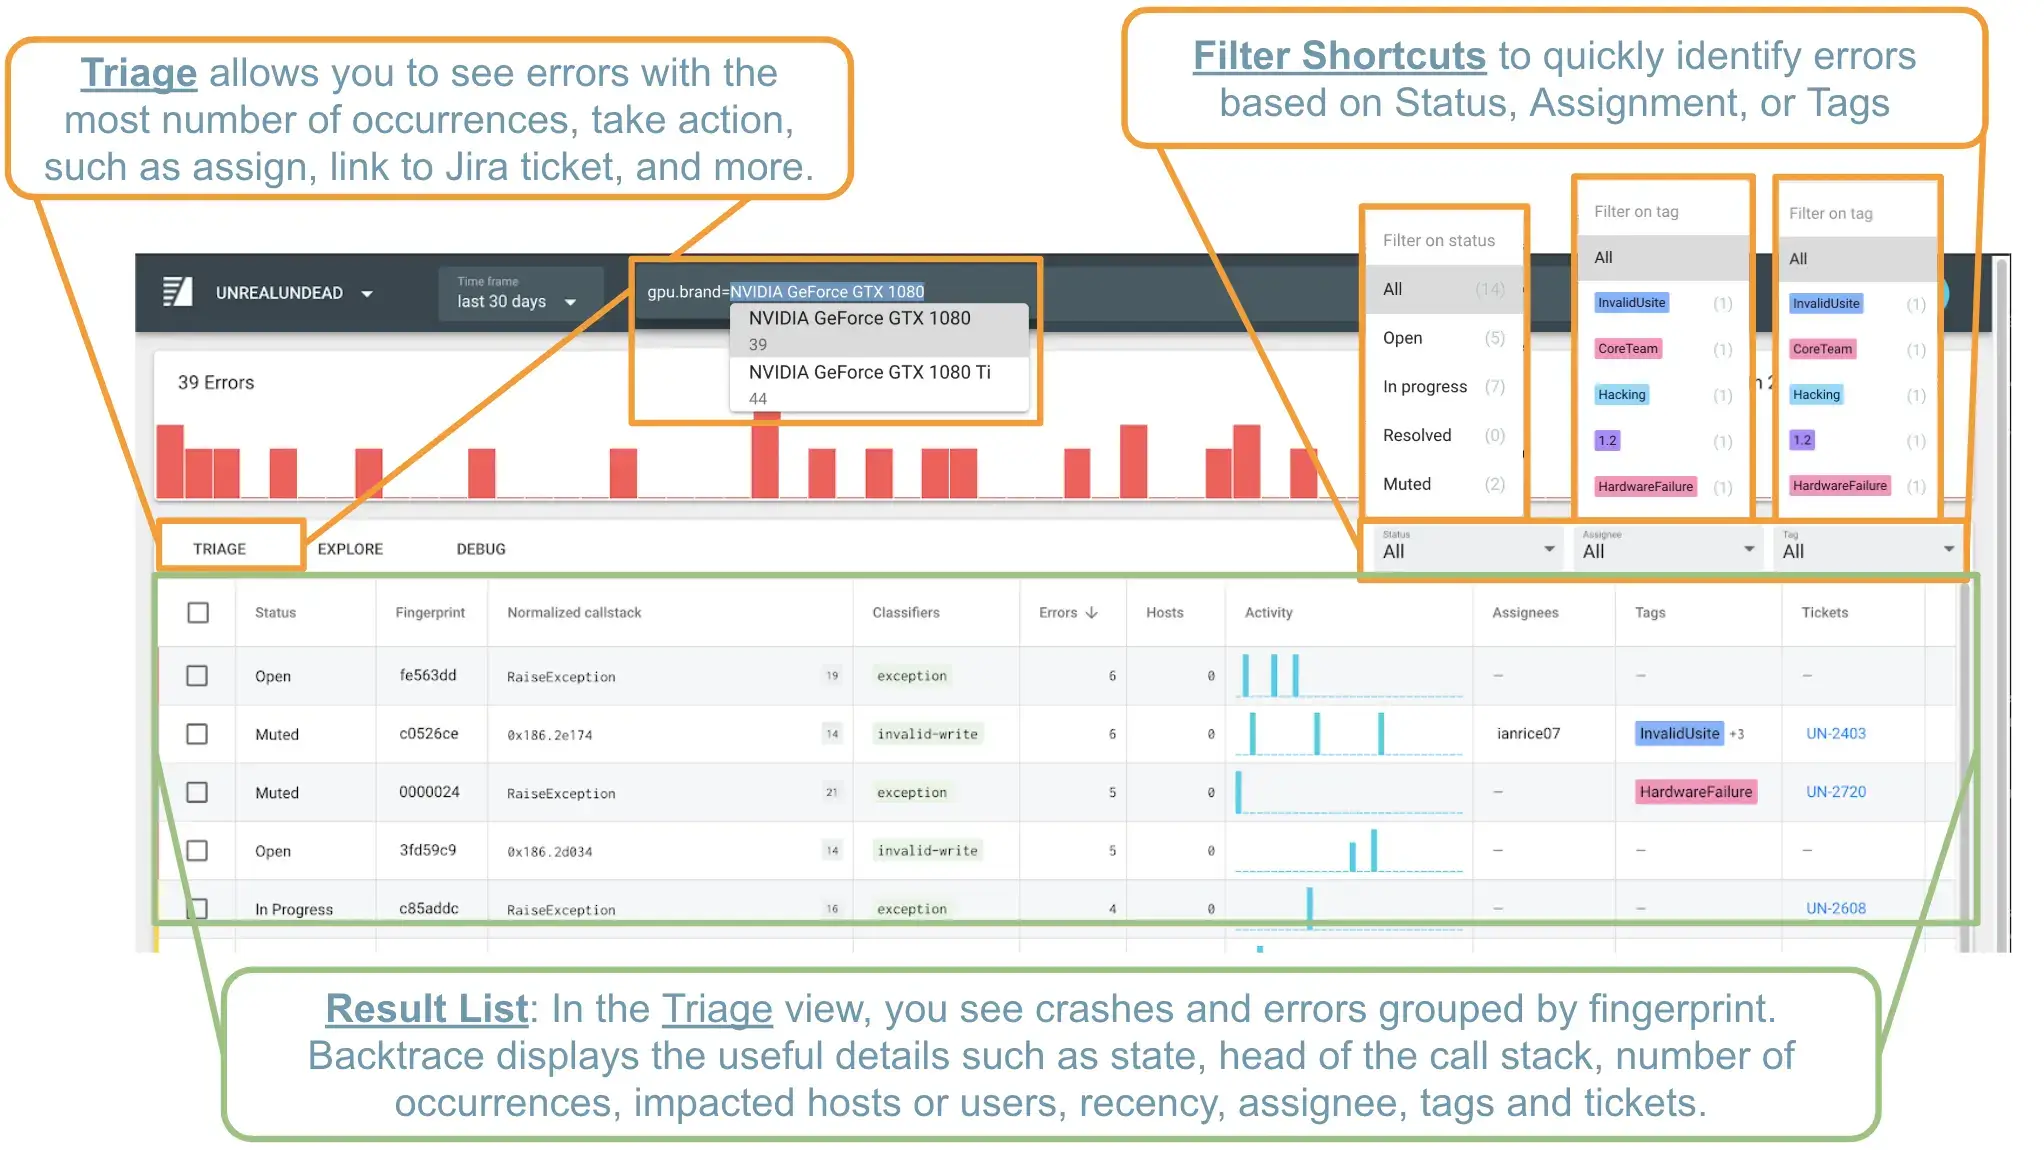
Investigating an Error in Backtrace
Once errors are reported to your Backtrace instance, you can view them in the Triage and Web Debugger views. See the screenshot below for the Triage view.
When debugging an error, you can choose to view more details of the exception. You can use the View Latest Trace action to see more details in the Backtrace Web Debugger. The Web Debugger provides a list of all attributes submitted with a report, the call stack and details of the selected frame, system environment details, and more to assist with the investigation.