Web Console Getting Started
The Backtrace web console includes 4 key navigational components to help you analyze your error and crash data:
- Project selector - Use this to switch between various projects that are reporting crashes or errors.
- Filters - Define your working set. Specify time frames and additional criteria to indicate which errors and fingerprints to analyze.
- Saved views - Commonly used filters for quick access and sharing for the selected project. As an administrator, you can save a view as a default and bookmark it for a team's project. You can further customize and save your own views.
- Views and results list - The Triage, Explore, and Debug views allow you to prioritize, analyze, and debug your crashes.
Filters
Natural Language Query
Natural language query is available in a public beta for cloud customers. Admins can enable the feature from the Universe Settings, AI Features, and use the toggle to enable the new capability for the organization. This centralized location will serve as the control point for all future admin-managed AI capabilities.
Natural Language Query is an AI feature. Data protection, security, and privacy are central to this product and to Sauce Labs as a whole. Our AI capability is designed to minimize queries on your data, and does not use application and user data. Only attribute names and attribute descriptions are used. User authentication remains consistent with Backtrace’ existing security model; each query respects user credentials and permission boundaries. Data processing of attribute names and descriptions is performed within secure and controlled cloud environments utilizing a compliant large language model.
Please see our Responsible use of AI guidelines in our Trust Center for more information.
The fastest way to get to the right data is to click the Ask button in the filter bar and type in a Natural Language Query - no special syntax, just describe what you want to see. The timeline and filter will be set, and your data will be intelligently grouped on the Explore page which is the best way to slice into your error reports.

Time Frame
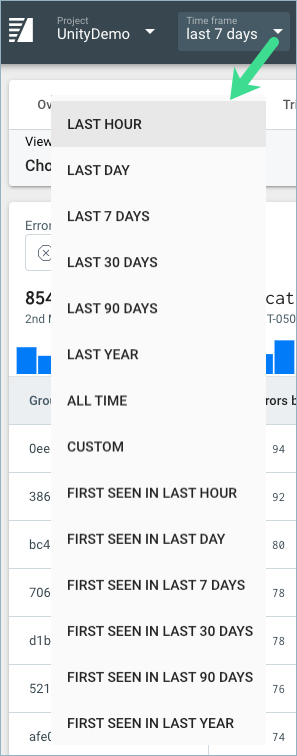
On the top left, you'll see the Time frame filter. This allows you to filter for issues that have occurred during a certain time period or to identify when an issue has first occurred.
Filter Bar
You can add filters identifying crashes from a certain version, a certain user, specific operating system, or more. Filters are available on any system or custom metadata that you provide with your crashes. You can take advantage of powerful filter operators that go beyond the normal equals or contains operators to include not-contains, regular-expression, inverse-regular-expression, at-least, or at-most, depending on the data type.
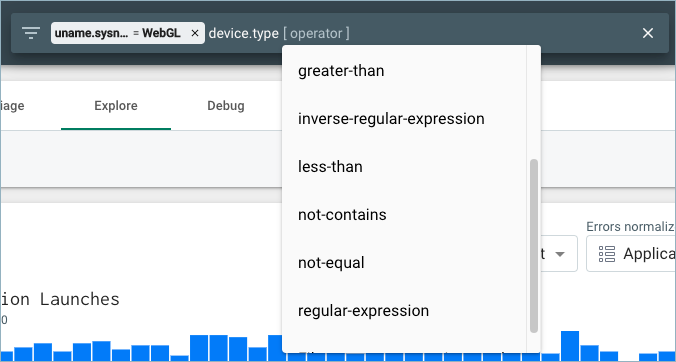
Filter Operators
By default, all search operators are case sensitive. If you want to search using case insensitivity, enter a regular expression or inverse regular expression with /{your-search}/i to invoke case insensitive search.
For example, to search for banana, Banana, or BaNaNa, enter description regular-expression /banana/i.
Query Builder
The Query Builder provides a graphical user interface that allows you to create complex queries. The available attributes are grouped by category, have a descriptive name, a description (if added), and also show available values. The last five used attributes are saved and displayed in the Suggested tab.
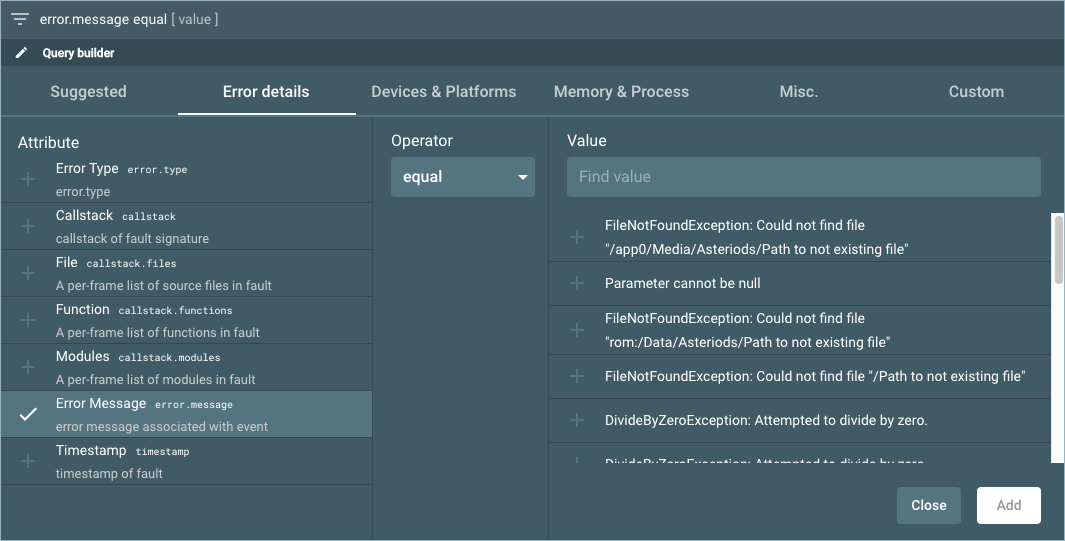
To use the Query builder:
- From the Filter bar, select Open Query Builder.
- In the Query Builder, select an attribute, an operator, and a value.
- Select Add.
Aggregation
Aggregation Filters allow you to apply an additional filter on the results based on an aggregation, such as a unique count, or a minimum or maximum from a series of values. Let's take a look at some example questions you can ask with this feature:
- "Show me crashes that have impacted at least 10 unique servers"
- “Show me crashes that were likely introduced in version 2.1.0”
- "Show me crashes that have occurred in at least 2 release channels”
- "Show me crashes that have impacted at most 1 unique scene in the game, so we can hone in on specific scene impacting issues"
Views and Result Lists
After defining your working set, choose a tool to view and manage the result list. The result list will vary depending on which tool you are in. The following shows the result list for the Triage view.
At the top of the result list, you'll see some informational text that tells you how many issues are being displayed and how many in total there are. This gives you a view of how many additional crashes or errors that are identified outside the filter window.
Depending on which view you are in, you have additional ways to manipulate the result list and continue your exploration of error data:
- In the Triage view, you will see errors grouped by Fingerprint. You have various actions available to support resolving the Fingerprint, and you have the ability to open a Details view for the Fingerprint to offer more introspection into the aggregate information about the Fingerprint.
- In the Explore view, you will be able to choose which attributes to Group By, allowing for more robust exploration of your error data. You can group by UserID (See impact by user), Host or Device ID (See impact to each host), OS Version (Identify issues encountered after an OS patch), or any custom attributes for the application.
- In the Debug view, you will be able to navigate through all individual errors that are returned based on the filter conditions. This allows you to iterate through a group of similar errors to identify additional trends or commonalities.
Saved Views
Saved views allow you to quickly access the data that is most important to you, whether you need to monitor specific error types or track errors across multiple releases.
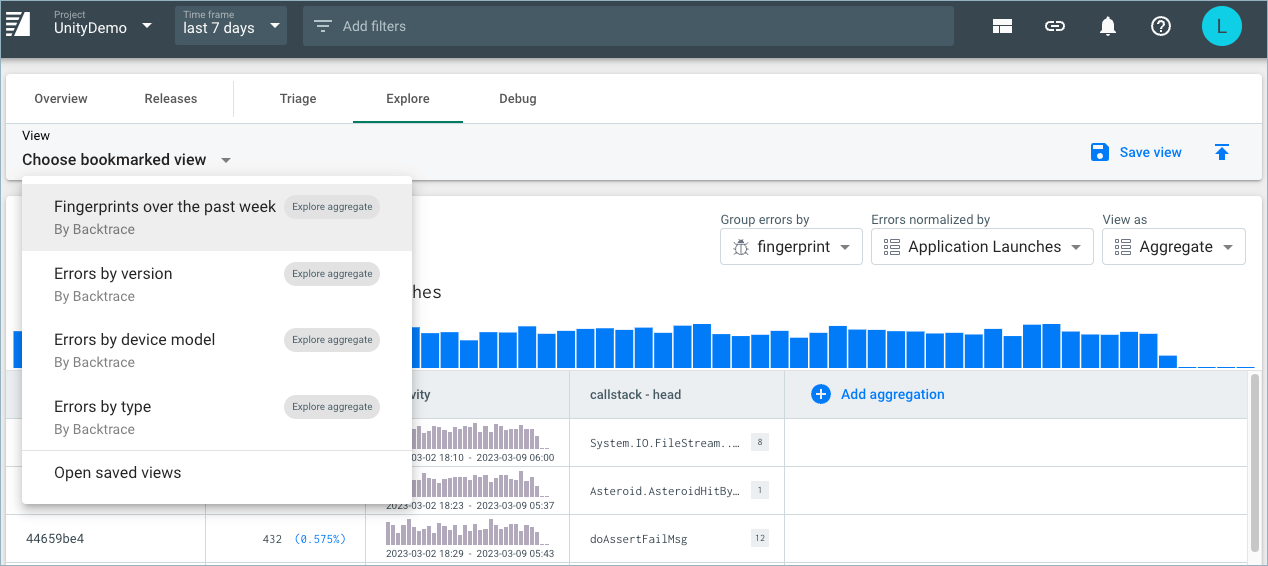
By default, every project includes bookmarked views, which include fingerprints over the past week, errors by version, errors by device model, and errors by type.
Save a View
You can also save your custom queries for the Explore and Triage views and bookmark them for quick access. As an administrator, you can bookmark saved views and share them across teams to collaborate more effectively.
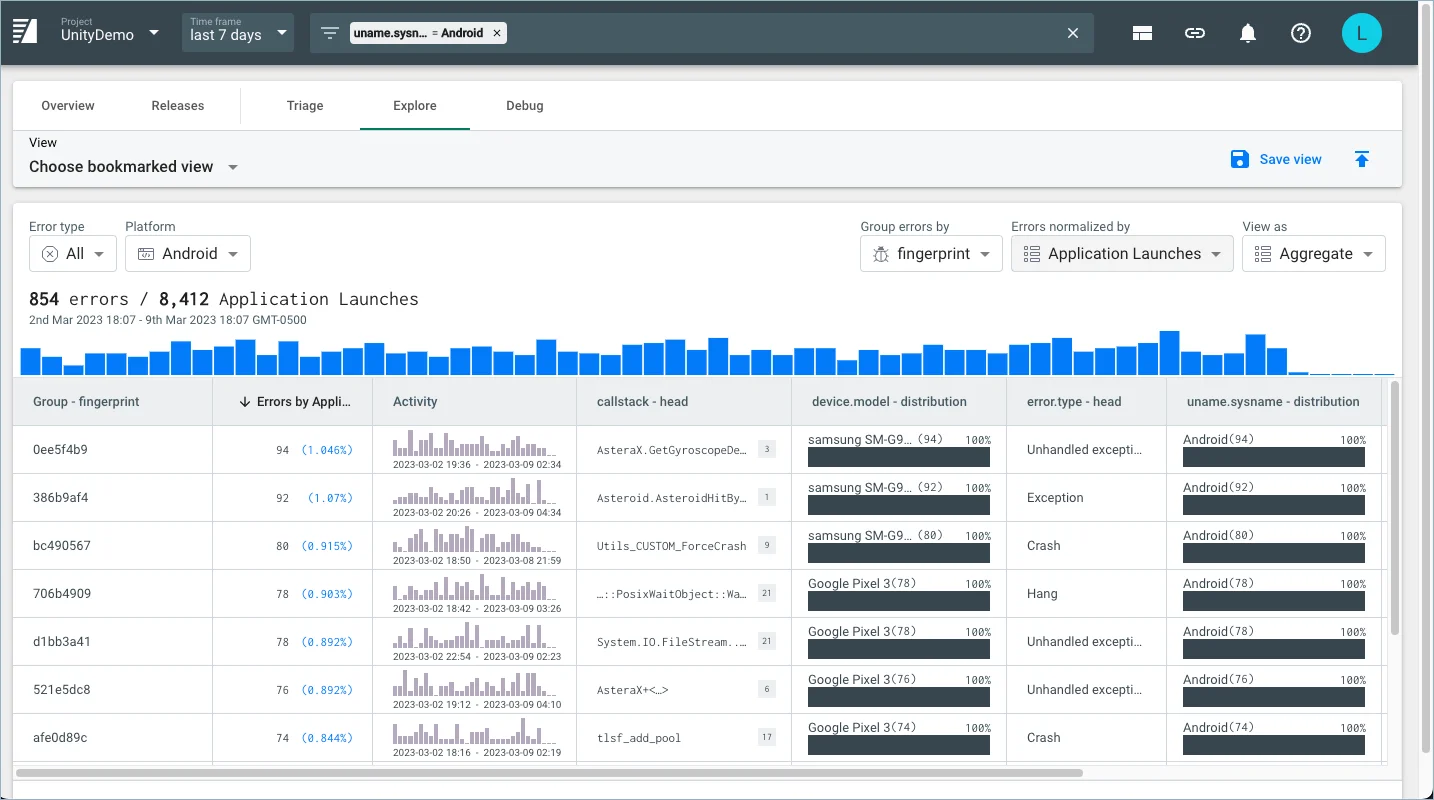
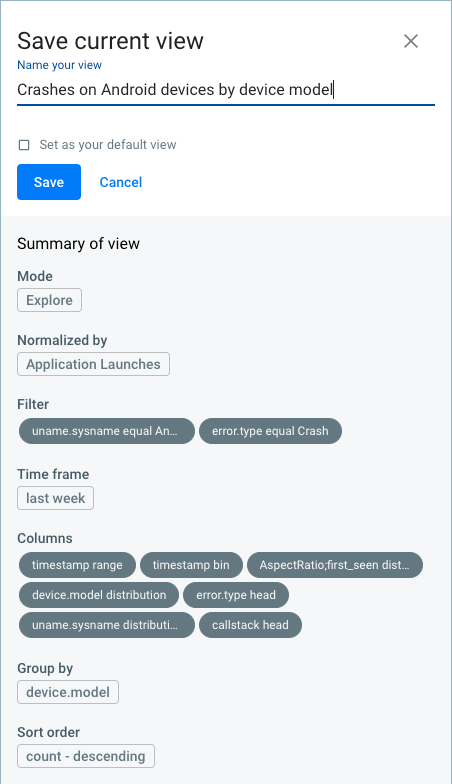
For example, you can create a view to see crashes that occurred on the Android platform and group them by device model, then save it to share with your team.
To save your current view:
- From the Triage or Explore view, select Save view.
- In the Save current view pane, enter a descriptive name for the view.
- Select Save.
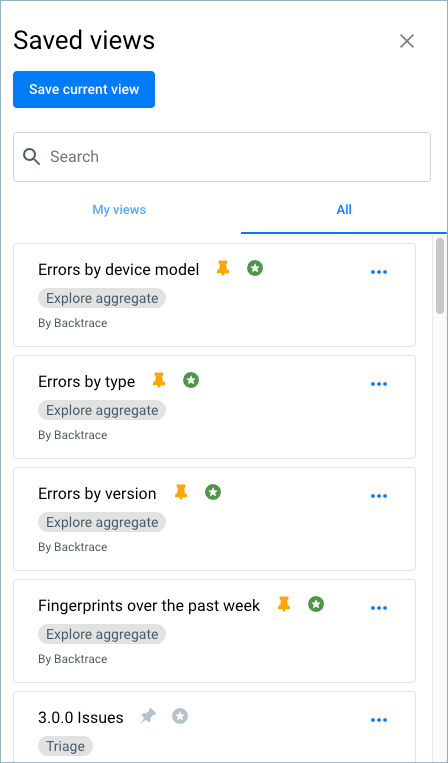
Your saved view will then appear under My views in the Saved views pane.
Access Saved Views
To access saved views, from the View bar in Triage or Explore view, select Open saved views.
From the Saved views pane, you can see the following:
- My views: Shows your saved views.
- All: Shows saved views created by any team member.
Console Use Cases
The Web Console provides an enhanced interface and interaction model for working with Backtrace. It was developed to support the needs of team members such as Engineers and Engineering Managers, QA and Support personnel, and Business or Product leaders, as they focus on detecting and resolving issues impacting their newly developed or released software.
- Engineering Managers - Triage the incoming errors (crashes and exceptions), and review the status of assigned errors. Explore, analyze and query the corpus of error data.
- Engineers - Debug and resolve errors assigned to them. Possibly self-assign errors not yet assigned.
- QA Personnel - Review the stability of a new release under development, identify regressions that occur and understand new tests required.
- Support Staff - Research a problem reported by a customer. Understand if errors have been fixed or what the workaround might be.
- Business and Product leaders - Understand the overall health of the system. Look for early warning indicators for positive or negative trends.