Explore
The Explore view exposes the power of query on your diagnostic data. Useful when you want to group by attributes other than fingerprint and Aggregate attribute information, and when you want to visualize using a List or Flame Graph view.
You are able to use the same filters discussed in the Triage view, and further use Group By and Aggregate functions to slice and dice your data by other attributes like version, user, app module, and more.
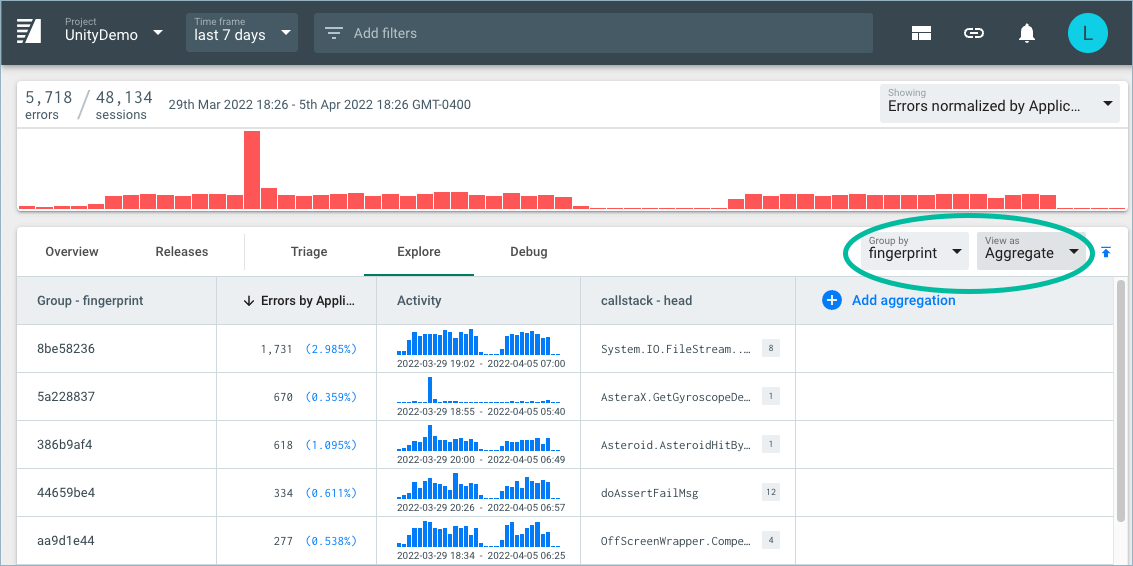
In the image above, you can see how to first choose your view (Aggregate, List, or Flame Graph), and choose any of your attributes to Group By. Typically, users will group by fingerprint, which shows you information about all errors that have been classified by a given fingerprint.
The power of Backtrace is fully on display when you begin grouping by other attributes.
- Group by attribute ConsoleVersion, and then add Aggregates for callstack distribution, unique number of users impacted, unique number of fingerprints, and the last time one of these crashes occurred.
- Group by a userID to see all errors encountered by a given user (useful for support staff who is researching a specific users problems),
- Group by OS version to identify instability that may be associated to a new OS patch (useful for QA leads working on a new test run).
- Group by deviceID to see instability by specific hostname. In all of these cases, it becomes useful to add an Aggregate of "Unique Fingerprints" so you can see both a count of individual errors as well as a count of the unique number of issues seen.