Overview
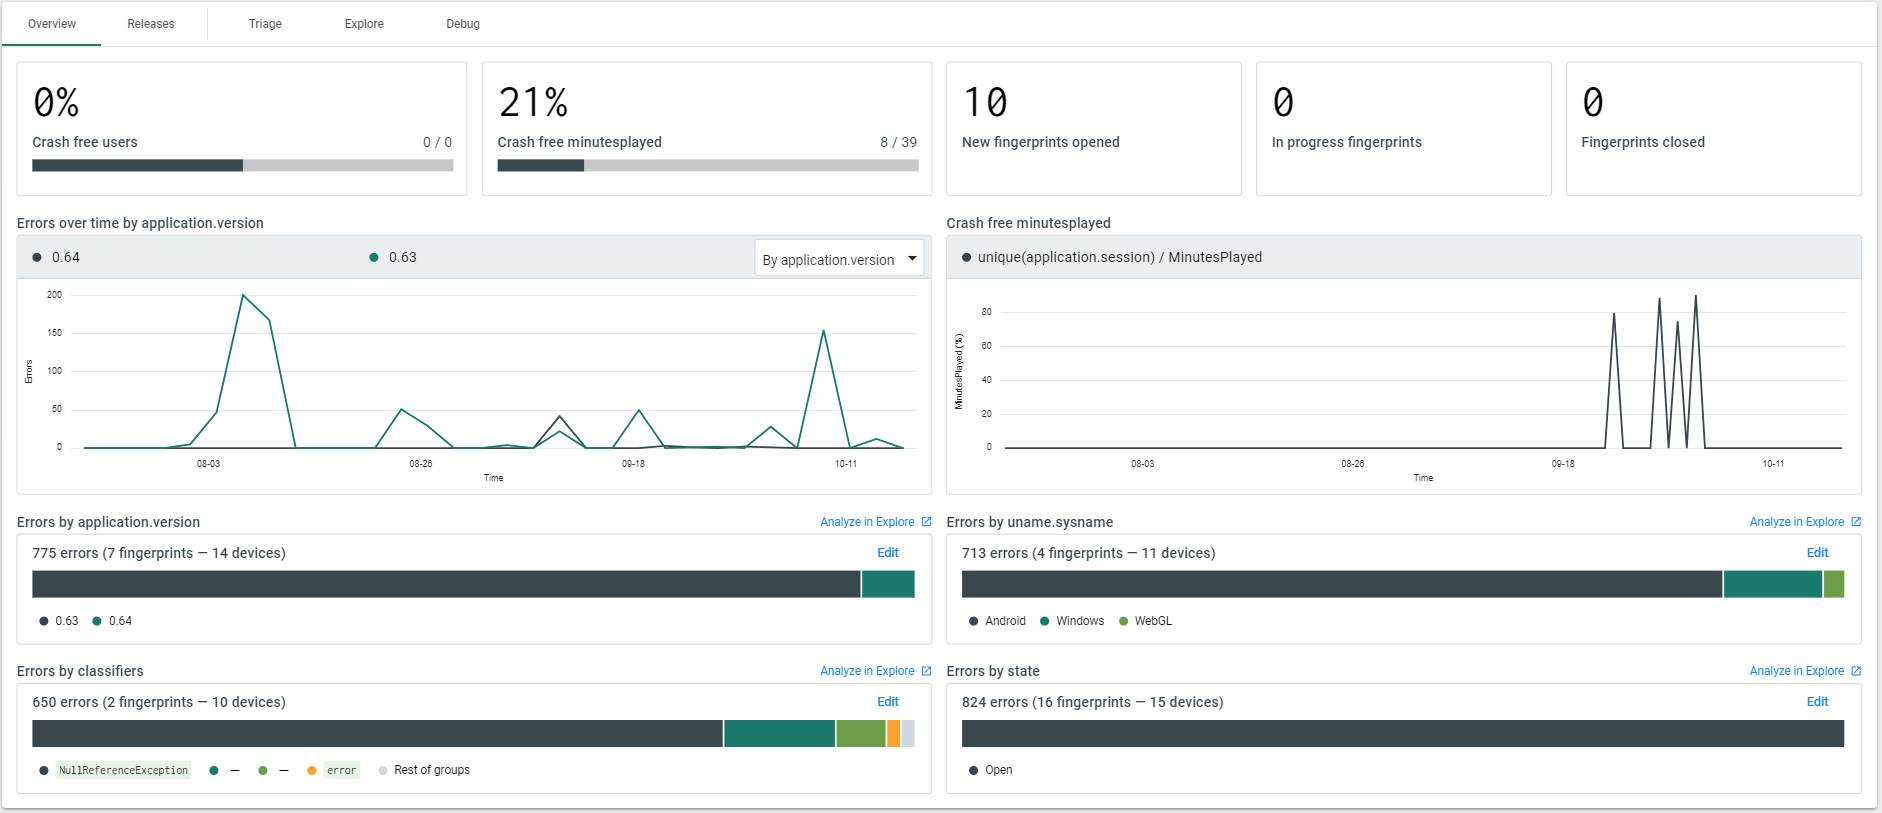
The Web Console’s Overview page provides an ‘at a glance’ view of your project’s health by displaying different top down views of your error / crash data. The widgets in place were designed to serve that goal by enabling a number of important use cases:
- Top Down Synthesis: Aggregate widgets allow developers or project leads to quickly see their application's stability and how many total, unique, and open errors have been reported in their project for a fast, simple status update
- Application Stability Over Time: Users can visualize their error count through time, broken out by application version to monitor their app’s stability across releases.
- Error Distributions Across Customizable Attributes: The stacked bar chart widgets at the bottom of the page show how your errors are distributed across relevant attribute values. For example, errors by operating system, classifiers, etc. Note that these can be configured to distribute by any indexed attribute to allow users to customize the page to fit their needs. More on this below.
- Filter the Overview: As with the Web Console’s Explore, Triage, and Debug view, the Overview page can also be manipulated using the global filter bar to suit your specific needs.
Errors Over Time By Version
On the Overview page, you will have access to one of our new visualization tools: A line chart that shows you your project’s errors through time, by version. This tool makes it easy to see if a particular build is problematic and is great for monitoring a new release.
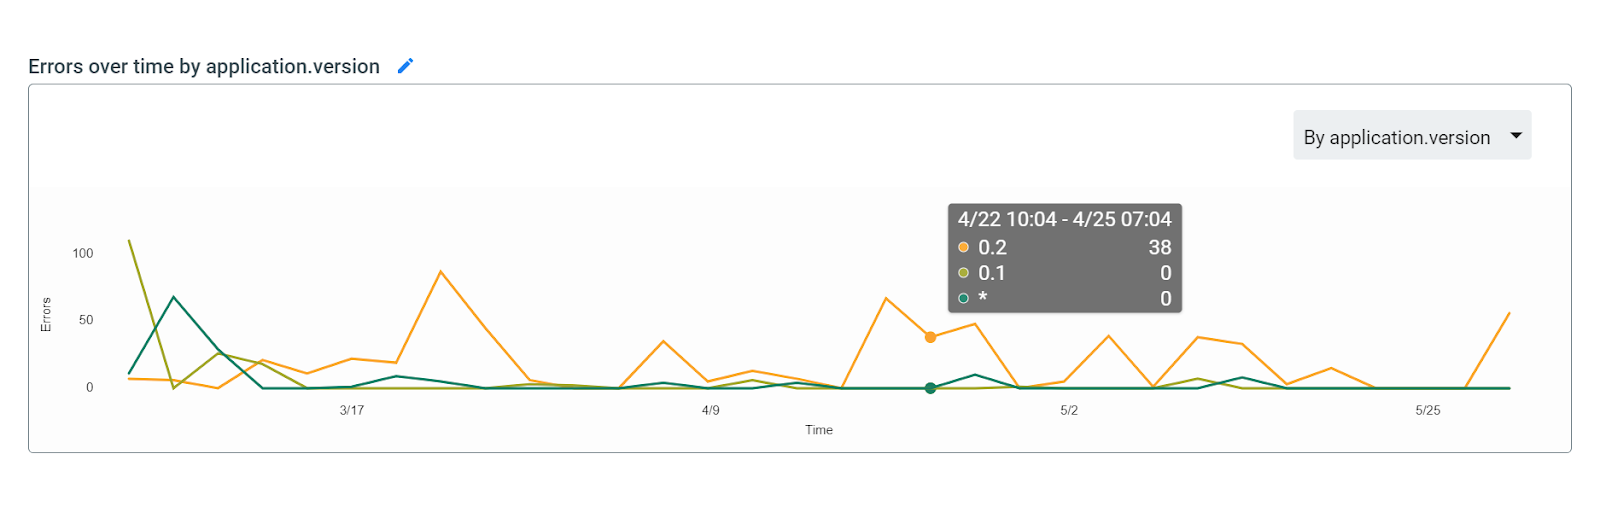
Here we can see that version 0.2 seems to generally have more error reports than 0.1. Perhaps this version introduced new features that weren't well tested.
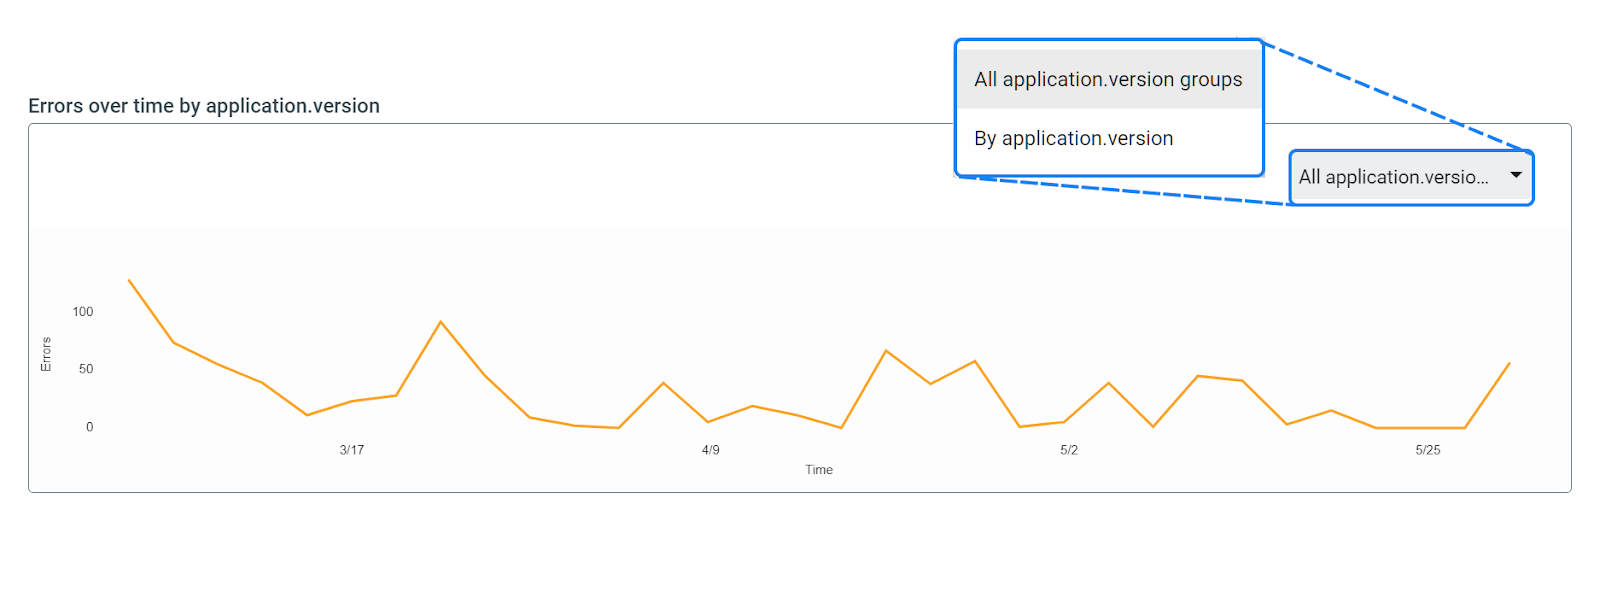
If you want the same visualization to instead show the total error count through time, you can use the drop down in the top right corner of the widget to toggle between “Total” and “By Version” modes.
Customize the Version Attribute
For the errors over time by version widget, we offer the ability to change which attribute you want to specify as “version”. We understand that different users often use their own custom attributes to signify the build version / app version so this will enable those users to utilize these tools as well.
To change the version attribute used by the Overview page, click the pencil icon to the right of the relevant widget’s title as shown below.

You can then select the attribute of your choice from the dropdown menu, as shown below.
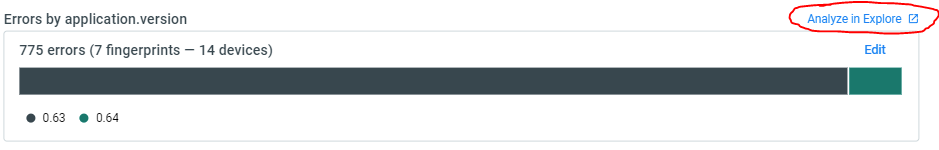
Error Distribution By Attribute
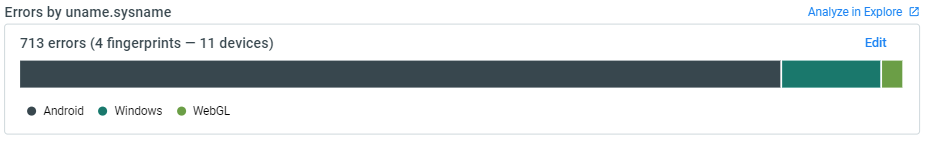
The stacked bar chart widgets at the bottom of the Overview page give users the ability to see a quick breakdown of their errors across different attributes. These widgets are a great way to quickly identify an issue that may be specific to an operating system, device type, or any other relevant attribute.
Customize the Distribution Widgets
These widgets are configured by default to show errors distributed by commonly relevant attributes. However, we allow users to edit each of these widgets to show their error breakdown by the attributes most relevant to them.
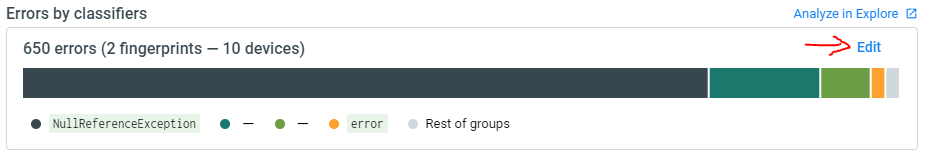
To customize these widgets, select Edit to the right of the widget.
This will bring up the following dialogue box which will allow you to search for the attribute you want to change it to.
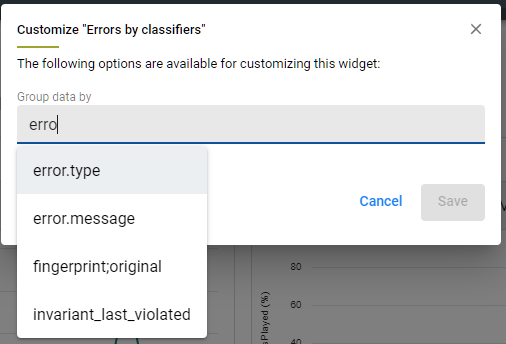
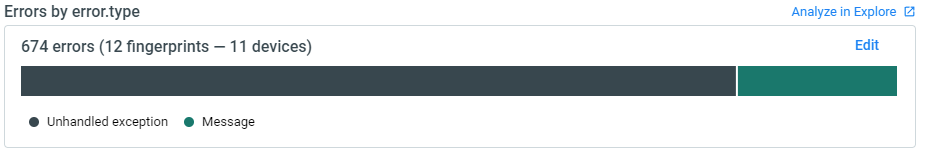
In this example, we changed the widget from "Errors by classifiers" to "Errors by error.type".
As of Q3 2021, these customizations are a global setting. When you save changes to these widgets, they will take effect for all users of your Backtrace instance. As we continue to add more generic dashboard creation functionality through 2022, our goal is to enable individual users to be able to customize and save their own views.
Drill Into Details
The Overview page also integrates well with the Web Console’s other views. If a distribution widget surfaces something worth investigating further, click the "Analyze In Explore" link at the top right of the widget. This will take you to the Web Console’s Explore view and automatically group by the same attribute as the widget. From here, you can use those views to drill into more detail.
Stability Metrics Widgets
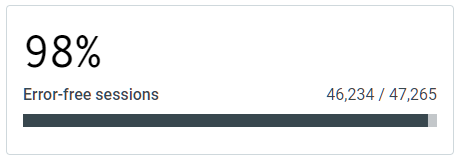
As of Console version 3.19.25, the Overview page also now supports "Error free session" and "Error free user" widgets.
For the best results with these metrics, follow the documentation below to ensure you have your project configured properly.
Error free sessions displays the percent of total application sessions that experienced no errors.
Error free users shows the percentage of unique users who did not encounter any errors.
Note that these widgets will respond to filters so if you want to see "Crash free" metrics instead, just filter out Non-Crash errors using the global filter bar. For example, error.type = Crash.
Both of these metrics are incredibly helpful ways to measure your project’s stability and user experience.
Error Free Sessions Through Time
The Error free sessions line chart is essentially a through time view of the Error free sessions widget mentioned above. It shows the % of sessions in which there were no error reports received, bucketed and plotted through time.
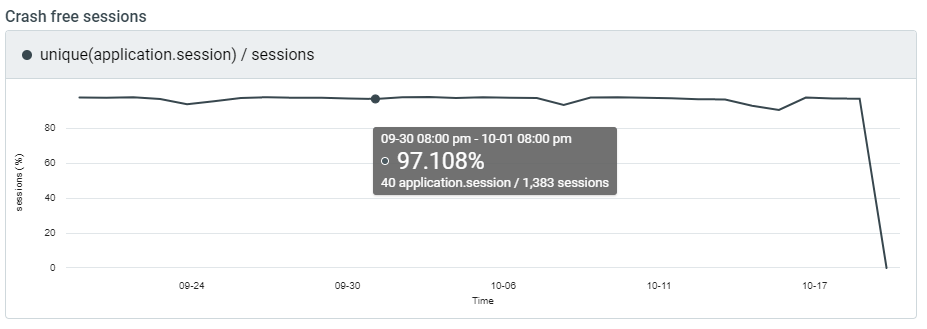
Note that the bucket size for each point on the line chart will vary as you adjust the global filter bar's time frame. For example, if you are looking at a time frame of the past 30 days, each point will represent one day, whereas when looking at the past 7 days each point represents a 12 hour period.
As pictured above, hovering your mouse over the chart will show you more details for the highlighted point.
Stability Metrics Configuration
These stability metric widgets were built upon a very powerful set of new Backtrace features that allow users to define / customize specific metrics which they care about tracking within their application / game. As such, there is some configuration that is required depending on the Backtrace SDK that you use in order to get the benefit of these features.
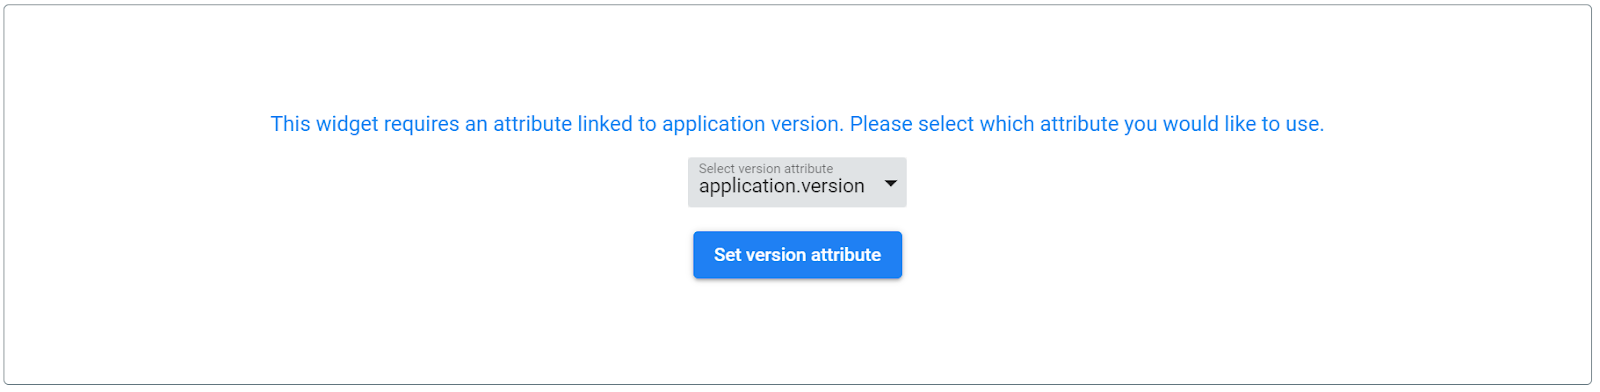
If you see something like the error in the image below, that means you need to follow the steps (linked below) to configure your project so the dashboards have the data they need to display your stability metrics.
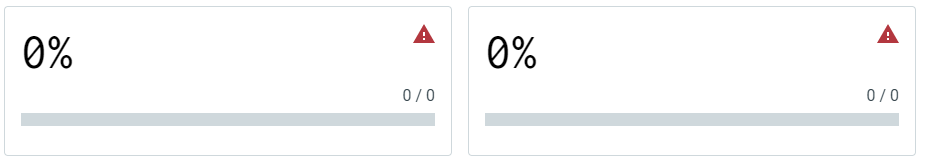
Only our Unity SDK is supported (v 3.5.0 and up).
For best results, you will need to add a filter to your view to remove the error reports from backtrace.versions that did not support stability metrics. For example, the Backtrace-Unity SDK version 3.5.0 was the first to support this feature so you would want to add a filter of "backtrace.version >= 3.5.0".
For more information on stability metrics and how to ensure they are configured correctly, see Stability Metrics.