What's New
This page is now deprecated and will be removed. To see what's new for Error Reporting, see the Sauce Labs Product Announcements.
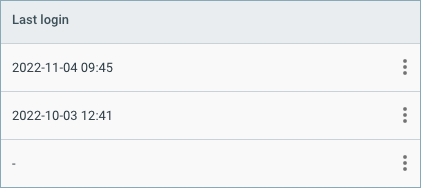
View Users' Last Login (2022-12-02)
As an admin, you can now check when a user last logged in to their account.
From the Universe Settings, click Users. In the list of users, under Last login, you'll see the date and time of the user's last login.
If a new user hasn't logged in to their account for the first time or hasn't logged in since August 1st 2022, the column will not be populated.
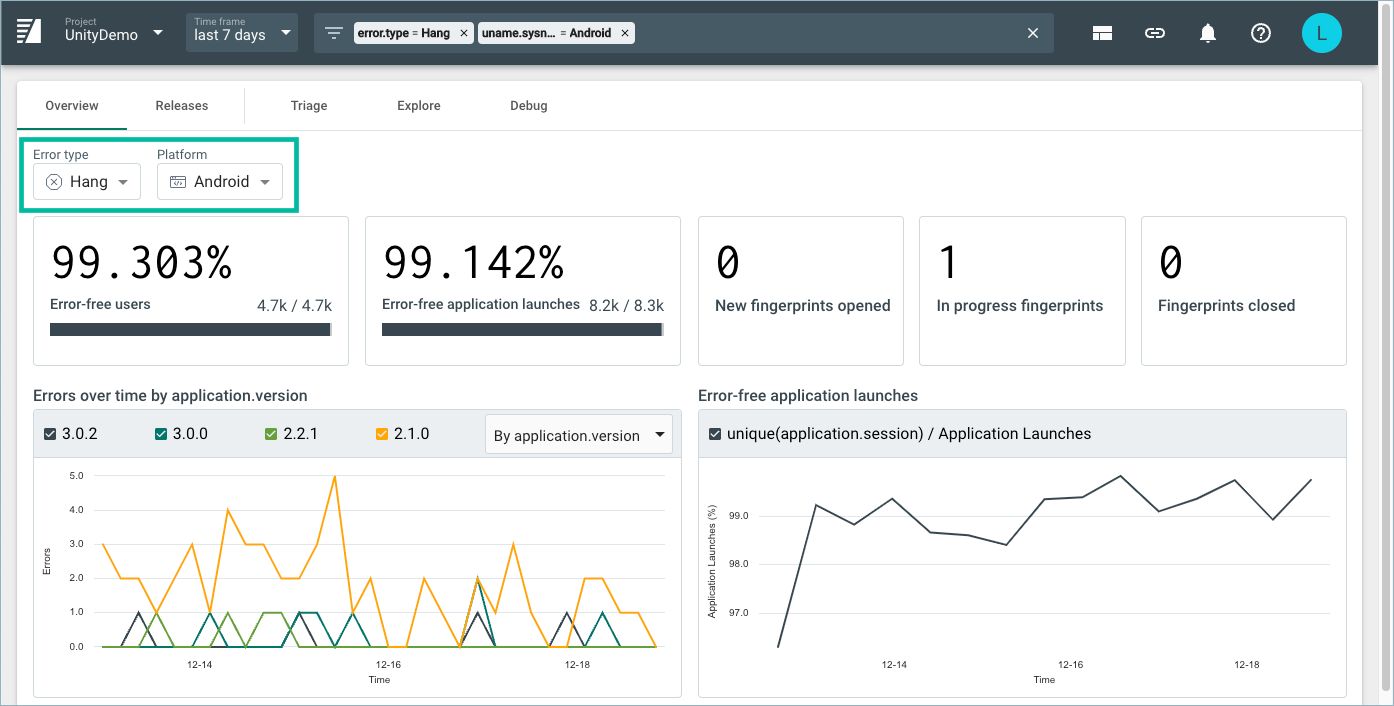
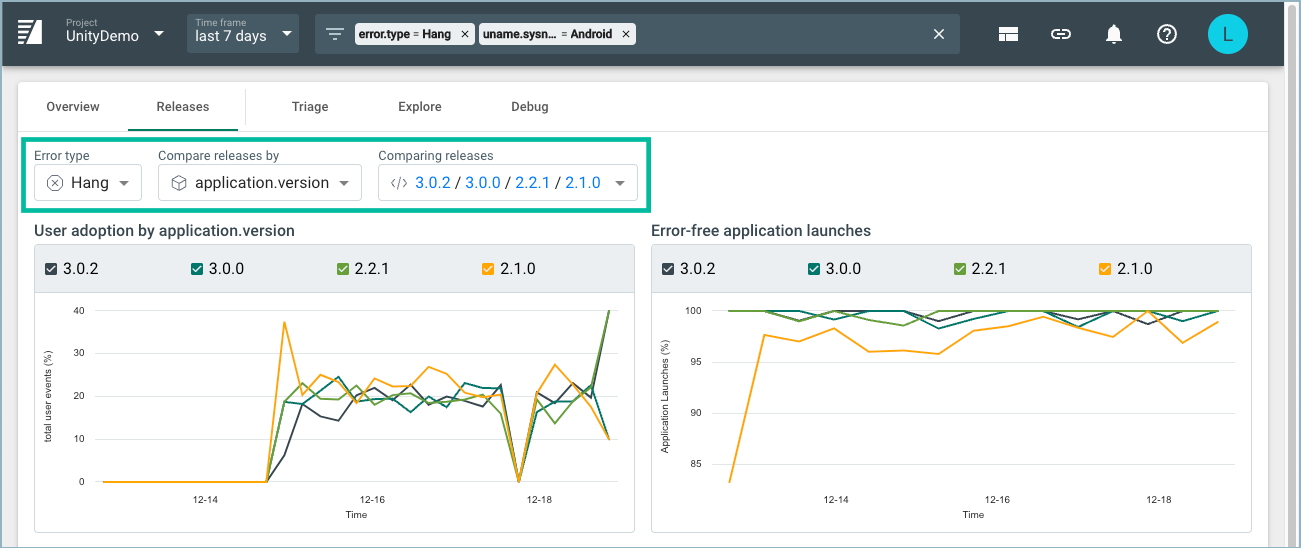
Quickly Filter Crash and Error Data (2022-12-02)
To make it easier to find critical errors, we've added quick search filters. From the Overview and Releases views, you can now search by error type, platform, and version attributes (if available).
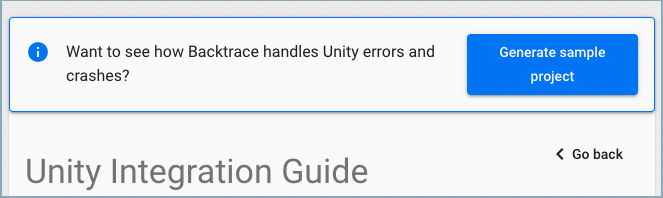
Unity Sample Project (2022-11-16)
You can now generate a sample project to see errors and crashes for a Unity application that has been integrated and pre-configured with Backtrace.
To generate a sample project, go to Project settings > Integration guides (under Error Submission) > Unity, then click Generate sample project.
Improved Navigation in Universe Settings (2022-11-01)
We've made it easier for you to navigate in the Universe settings menu. The improvements include a breadcrumb trail at the top of the screen, and a new side navigation menu.
Improved Navigation in Project Settings (2022-10-17)
We've made it easier for you to navigate in the Project settings menu. The improvements include a breadcrumb trail at the top of the screen, and new groupings in the side navigation menu for better readability.
Help and Support Access (2022-08-19)
For easier access, the Help and support button is now located in the navigation bar.

Filtering Attributes by Description (2022-07-29)
In addition to filtering attributes by name, you can now use the global filter bar to filter attributes by description.
Sorting Users (2022-07-29)
In the Universe settings, you can now sort the Users page by username, email, and role.
Releases Comparison View (2021-10-05)
The Releases Comparison View allows you to easily monitor and compare stability, user adoption, and other crash and error metrics across all versions of your application. For more information, see Releases.
Project Overview Page (2021-06-04)
Quickly monitor your project’s health with the Web Console’s newest view: The Project Overview. See total errors count, errors through time, errors by app version, errors by platform, and much more all on one page. For more information, see Overview.
Attachment Preview (2021-04-30)
If you add screenshots, logs, or other attachments to your errors, you can quickly view them in the Debugger.
Submission Actions (2021-03-16)
As an admin user, you may be interested in "Submission Actions". You'll find them under Project Settings > Submission Actions. Submission Actions can configure projects to: automate assignments, set tags and attributes, reject submission traffic, and more.
Game Console Connectors (2021-01-10)
Backtrace now exposes additional support to manage crashes and errors for PlayStation 4, PlayStation 5, Microsoft Xbox One and Series X|S, and Nintendo Switch.
Alerts (2020-11-19)
Backtrace allows admin users to define alert notifications to be sent to third-party integrations such as Slack, Jira, Datadog, or others whenever certain warning or error threshold values are breached.
Storage Sampling Management (2020-11-02)
For high volume systems with minidump artifacts, there are diminishing returns to storing every single dump object. They can take up disk space and may not be needed. Backtrace provides Storage Sampling to allow administrators to control which dump objects are stored long term after processing.
Metric Export (2020-10-14)
Teams want to incorporate crash and error data that Backtrace collects into their central Dashboard systems that are designed to show time series data. Backtrace Metric Export allows admins to define sets of metric data that can be exported on a regular basis to systems like Circonus, Datadog, Graphite, Grafana, Amazon Cloudwatch, Prometheus, and InfluxDB.
Source Code Integration (2020-09-15)
Make use of source code related information while in your debug environment. Backtrace can now integrate with your Git and Perforce P4 based version control systems to display relevant source code alongside a stack trace, decreasing the time it takes to review all the relevant data around an error.
Metric Import and Stability Scores (2020-09-02)
Backtrace allows users to compute error rates against any metrics you collect like "Sessions started”, “Minutes used”, “Online connections made” or "Songs played". These metrics can be imported from raw data that lives in external systems like Graphite, Influx, Redshift, or Postgres. In the future, you will be able to supply raw data directly through the Backtrace client SDKs.
Similarity Analysis and Merge Recommendations (2020-09-02)
Tunable heuristic-based analysis spots new API signatures or changes further up the stack. You can now view a ranked list of recommended fingerprints to consider merging based on 'distance' from one another (to see how similar they are). Compare call stacks to see functions that were added, removed, or moved, tune the engine to identify a more representative set of similar fingerprints, and use the “Merge” action to union the fingerprints and related information.
Case Insensitive Filtering (2020-08-24)
By default, all filter operators are case sensitive. If you want to filter using case insensitivity, enter a regex or inverse regex within /{text}/i to invoke case insensitive search. For example, if you want to search for "banana" or "Banana" or "BaNaNa", you can enter "/banana/i" and each search term will be included in the results.
Aggregation Filters (2020-07-28)
Aggregation Filters are available as one of the operators in the drop down in the filter bar. They allow you to apply an additional filter on the results based on an aggregation, such as a unique count, or a minimum or maximum from a series of values.
x86-64 Minidump -> Core (2020-07-08)
The Debugger "Download" action now offers the ability to download a core file representation of a Linux x86-64 minidump crash. The core file can be used to view it locally in a debugger like gdb / lldb / etc and retrieve variable values.
Teams and Project Permissions (2020-06-10)
A new Universe Setting object called Teams is available for Administrators to Manage. Teams consist of other Teams or users of the system. Teams be used as Project Members with defined Roles so that access can be restricted to both individual users or groups of users.
Reopen Criteria (2020-04-28)
Use the Resolved Until or Muted Until functionality to tell the system to reopen a fingerprint if it's seen in a future version or after a certain period of time.
PlayStation 4 Support (2020-03-18)
Project Admins can use Project Settings > Error Submission > Data Sources to set up integration with their PS4 crash capture system.
Default Saved Views (2020-03-27)
Admin users can set a Team Default Saved Views for each project that will be the default that users see when accessing the project. Users can further set their own User Default Saved View for each project that can further personalize the information they see when the open the project.
Reprocess a subset of errors (2020-02-04)
If you need to reprocess a subset of errors due to new debug symbols, source maps, or ProGuard files being uploaded, or new attributes to be indexed, you can now take the reprocess action from the Triage > Fingerprint > Actions dropdown or the Explore > Actions dropdown. See Object Reprocessing for more information.
Customize the Triage View (2020-02-04)
You now customize the columns that appear in the Triage view. These can be saved as Saved Views and in an upcoming release, users will be able to set default views for the project team or the individual user.
Fingerprint Merging with Union Semantics (2020-02-03)
When performing a Merge action on 2 or more fingerprints, Backtrace will now show a union of all the linked Tickets, Assignees, and tags that have been applied.
Support for Google Stadia (2019-11-25)
Developers building games for Google Stadia can now capture and analyze crash dumps from Stadia games. The Project Settings -> Integration Guide have all the details.
Support for SourceMaps (JavaScript) and ProGuard (Android) (2019-10-29)
Integration Guides for SourceMaps and ProGuard are now available to walk users through configuring Backtrace to use these mapping files during processing of errors.
Debugger 2.1 (2019-09-17)
A new, more compact debugger UI, designed to give the engineer all the debug info they need on a single pane of glass.
Advanced Settings for Dedup and Symbol Servers; 2 way Jira Integration; MS Teams Integration (2019-07-25)
- Admin users on an Enterprise Plan can use the Web Console Project Settings to configure custom deduplication rules, or private symbols servers.
- Admin users on any plan can configure Jira sync to be two-way, such that assignee and status are updated in both systems whenever a change is made.
- Admin users on any plan can configure integration with Microsoft Teams such that notifications can be sent to the appropriate channel and person.
Filter Bar UX update and Support for MET (2019-06-12)
- New UI and UX for using the filter bar.
- Support for Memory Error Tracker (MET) capabilities.
Shortened Link Sharing Service & Support for Mobile Crash Reporting (2019-05-06)
- The Web Console now has an integrated link sharing service. Check out the Copy Link icon in the upper right of any page to Web Console to copy and share a shortened link for any page.
- The Console now supports using Triage, Explore, and Debug on crashes and exceptions from mobile devices captured via the new backtrace-cocoa and backtrace-android libraries.
New Web Console as the Default (2019-04-01)
The new Web Console is now the default for all users. For more information, see Web Console Getting Started.
Navigation and Information Hierarchy Update (2019-04-01)
- The Filter Bar has been moved to the upper header to better scope the working set of crashes and errors that users want analyze.
- The Result Set in the Triage view has been made more compact.
- The Details view of a fingerprint (via Triage) now includes default attributes to analyze and a list of all occurrences of a fingerprint.
- The Explore tool now provides Aggregate, List, and Flame Graph views.
SAML Configuration (2019-03-15)
Customers on the Enterprise plan can now configure their SAML configuration under Universe Settings.
Comments (2019-03-07)
When viewing the Details of a Fingerprint in the Triage view, a user can view list of comments associated to a fingerprint, and can create new / edit their comments.
Per User Default Setting for New Web Console (2019-03-01)
Users can choose to have the new Web Console be their default using the Set As Default button after they login. This setting is also available under Universe Settings > My Account > Early Access toggles.
Manual Issue (Jira) Creation (2019-01)
When viewing a fingerprint in the Triage view, a user can choose to create a new issue in an issue tracking system like Jira.