Real Device Cloud in Your IDE
The Real Device Cloud view lets you access your organization's private Android and iOS devices directly from your IDE. You can browse available devices, start live testing sessions, install applications, capture screenshots, monitor device logs, and interact with physical devices without leaving your development environment.
Browse and filter devices
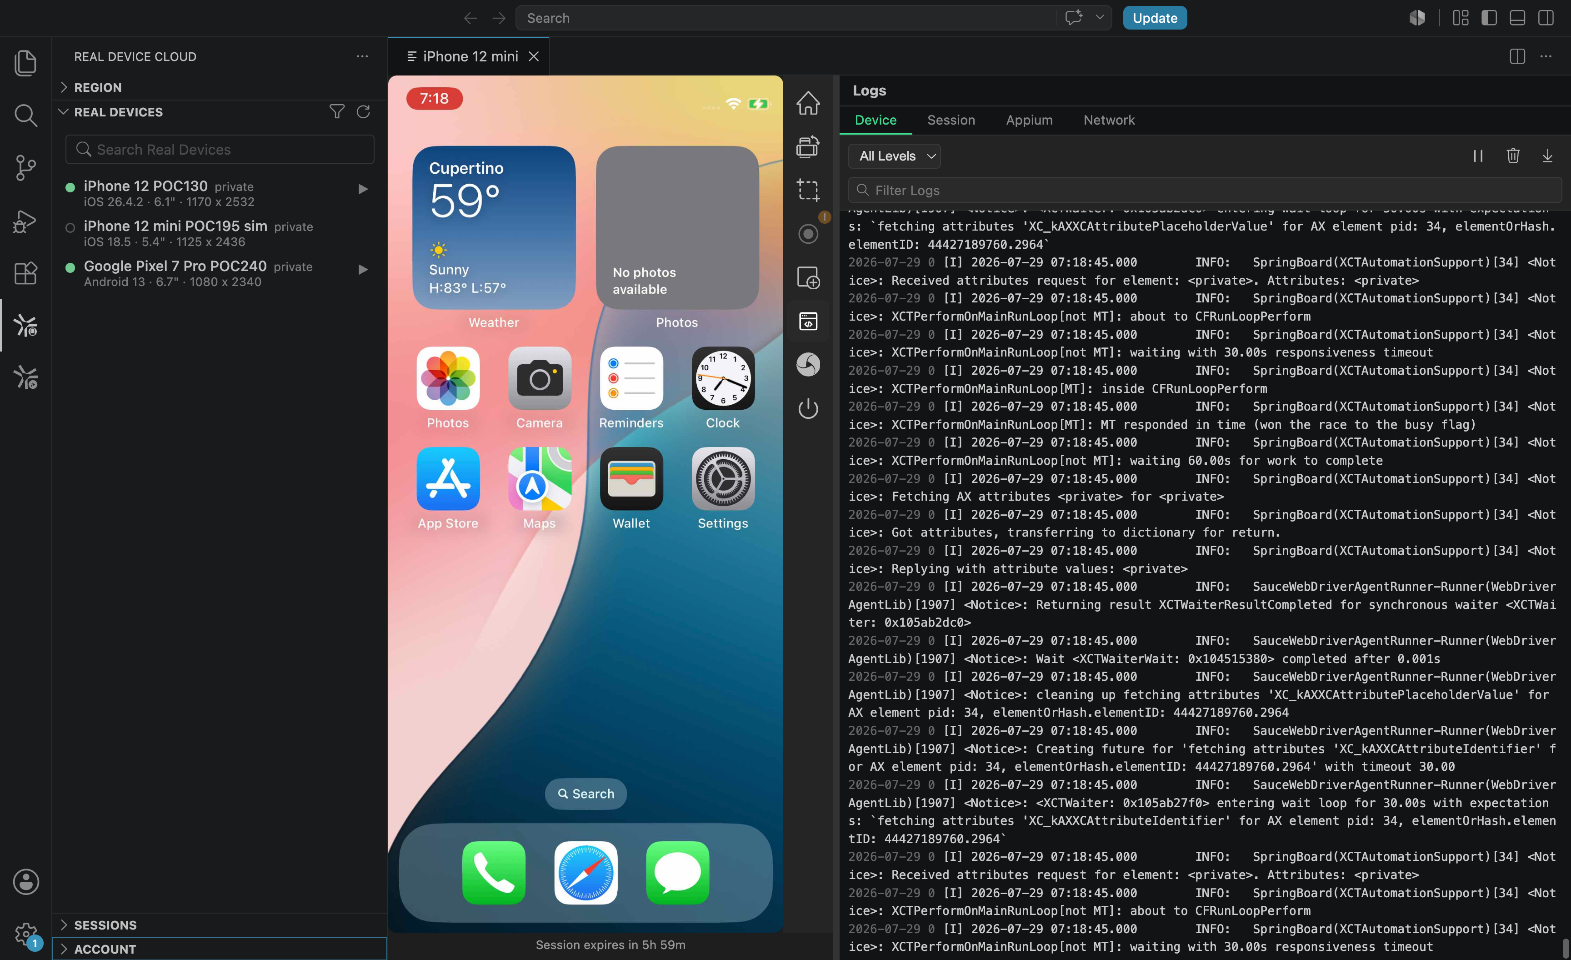
Open the Real Device Cloud view from the Activity Bar. The Real Devices section lists your organization's private devices available in your current region. Each row shows the device name, OS version, screen size and resolution, and availability status.
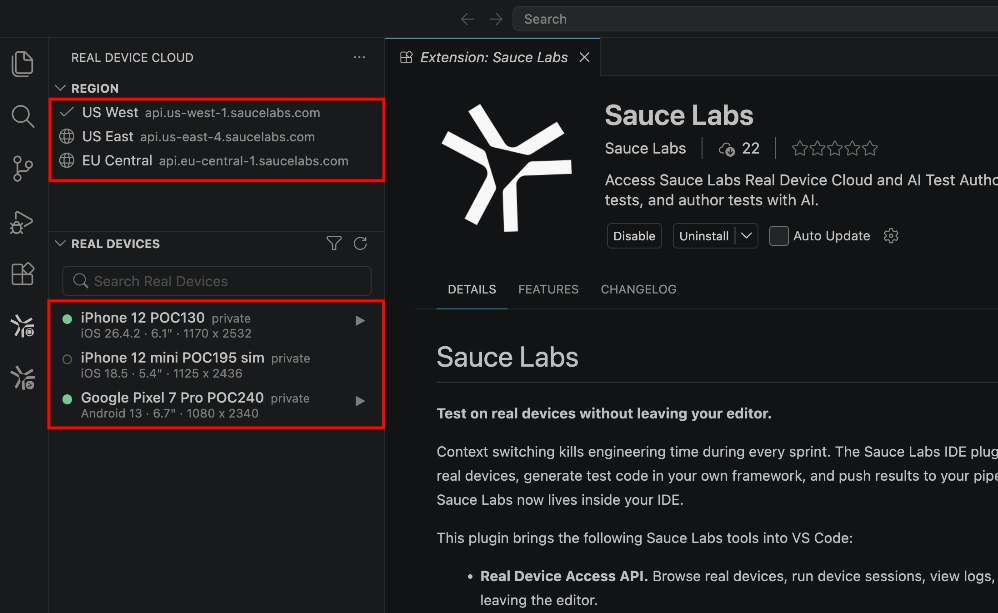
Use the available search and filtering options to quickly locate the device that matches your testing requirements.
| Ref. | Feature | Description |
|---|---|---|
| 1 | Filter Devices | Filter the device list to display only the devices you want to use. You can filter devices by All, Apple, Android, or Private devices. |
| 2 | Refresh Devices | Click Refresh Devices to retrieve the latest device availability. The device list also refreshes automatically at regular intervals to reflect changes in device status. |
| 3 | Search Devices | Use the Search Devices field to search for a specific device by its model name. The device list updates automatically as you type to display matching results. |
Start a live session
After selecting a device, you can start a live testing session directly from the Real Device Cloud view. Once the session starts, the selected device is allocated to you and opens in a new editor tab, allowing you to interact with it in real time.
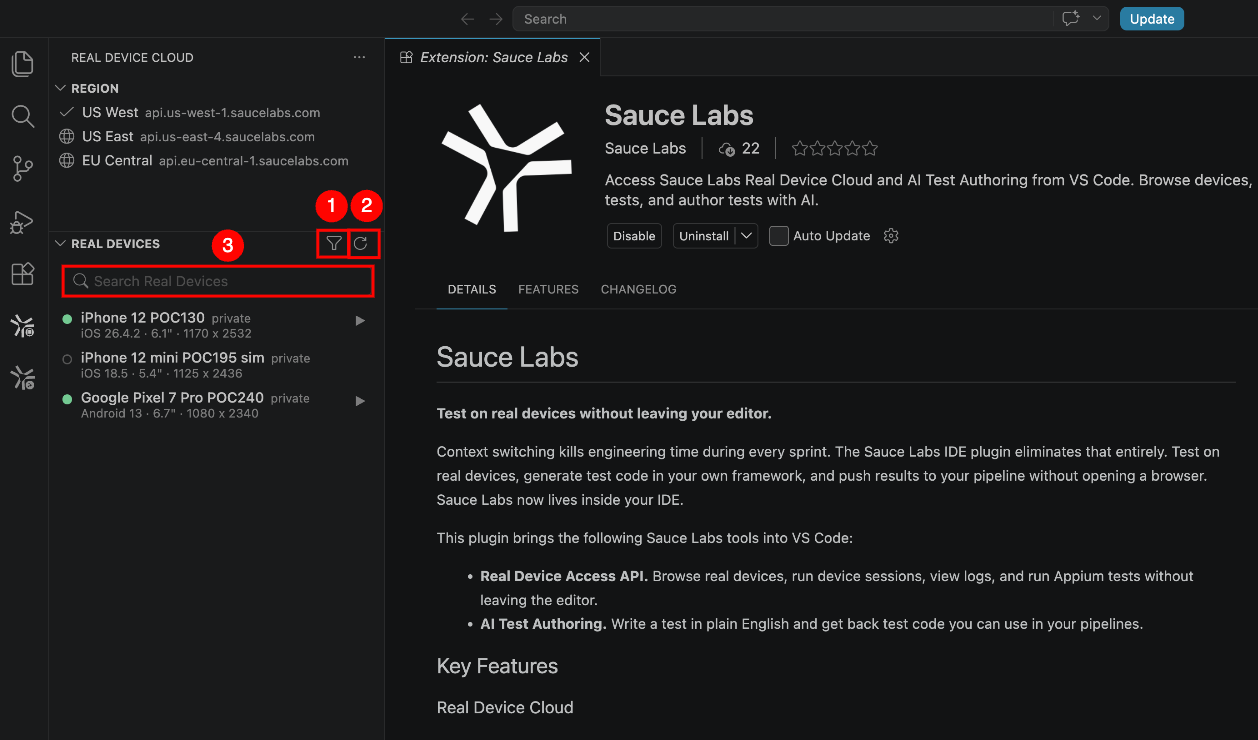
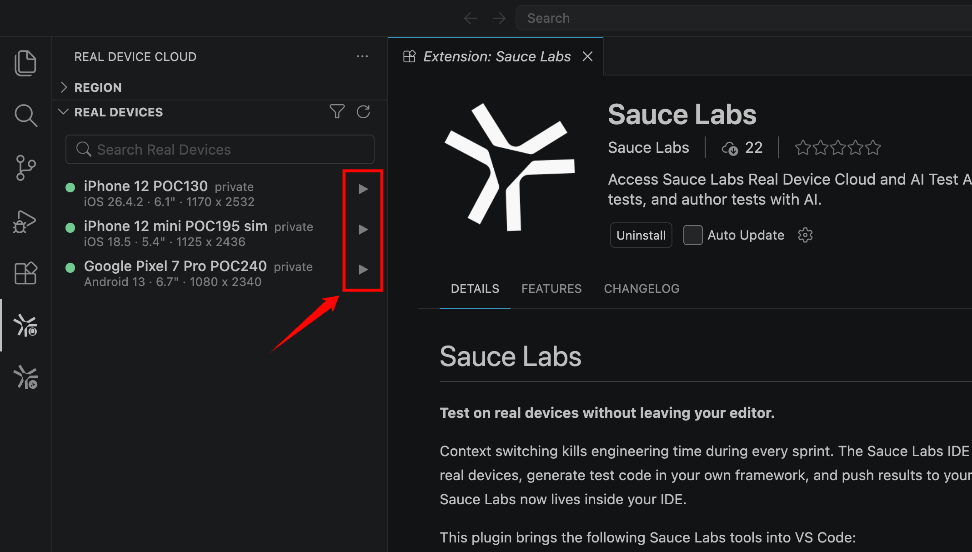
Step 1: In the Real Devices section, locate an available device. Devices with a green status indicator are available for new sessions.
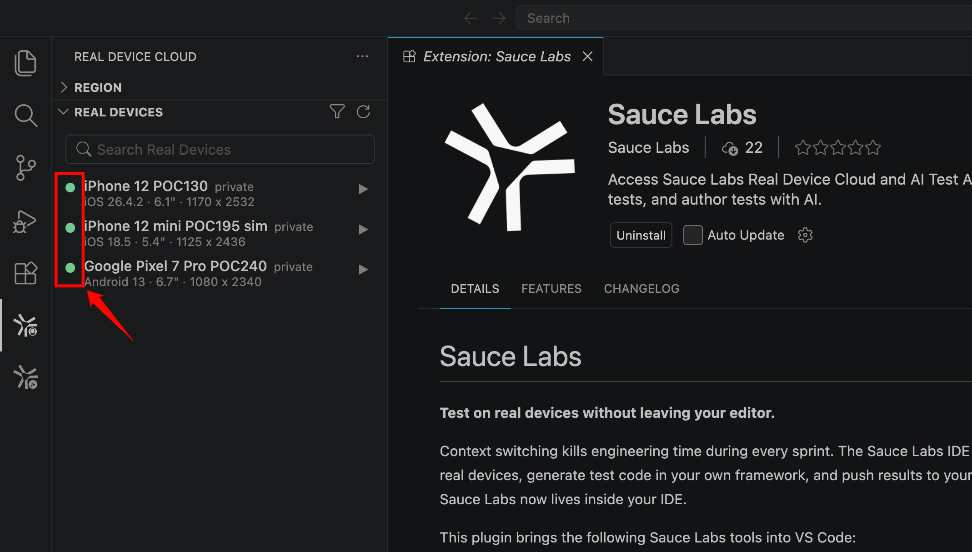
Step 2: Click the Play icon next to the device. Alternatively, right-click the device and select Start Session.
Step 3: Wait while Sauce Labs allocates the device. The live device screen typically loads within 15–30 seconds, depending on device availability.
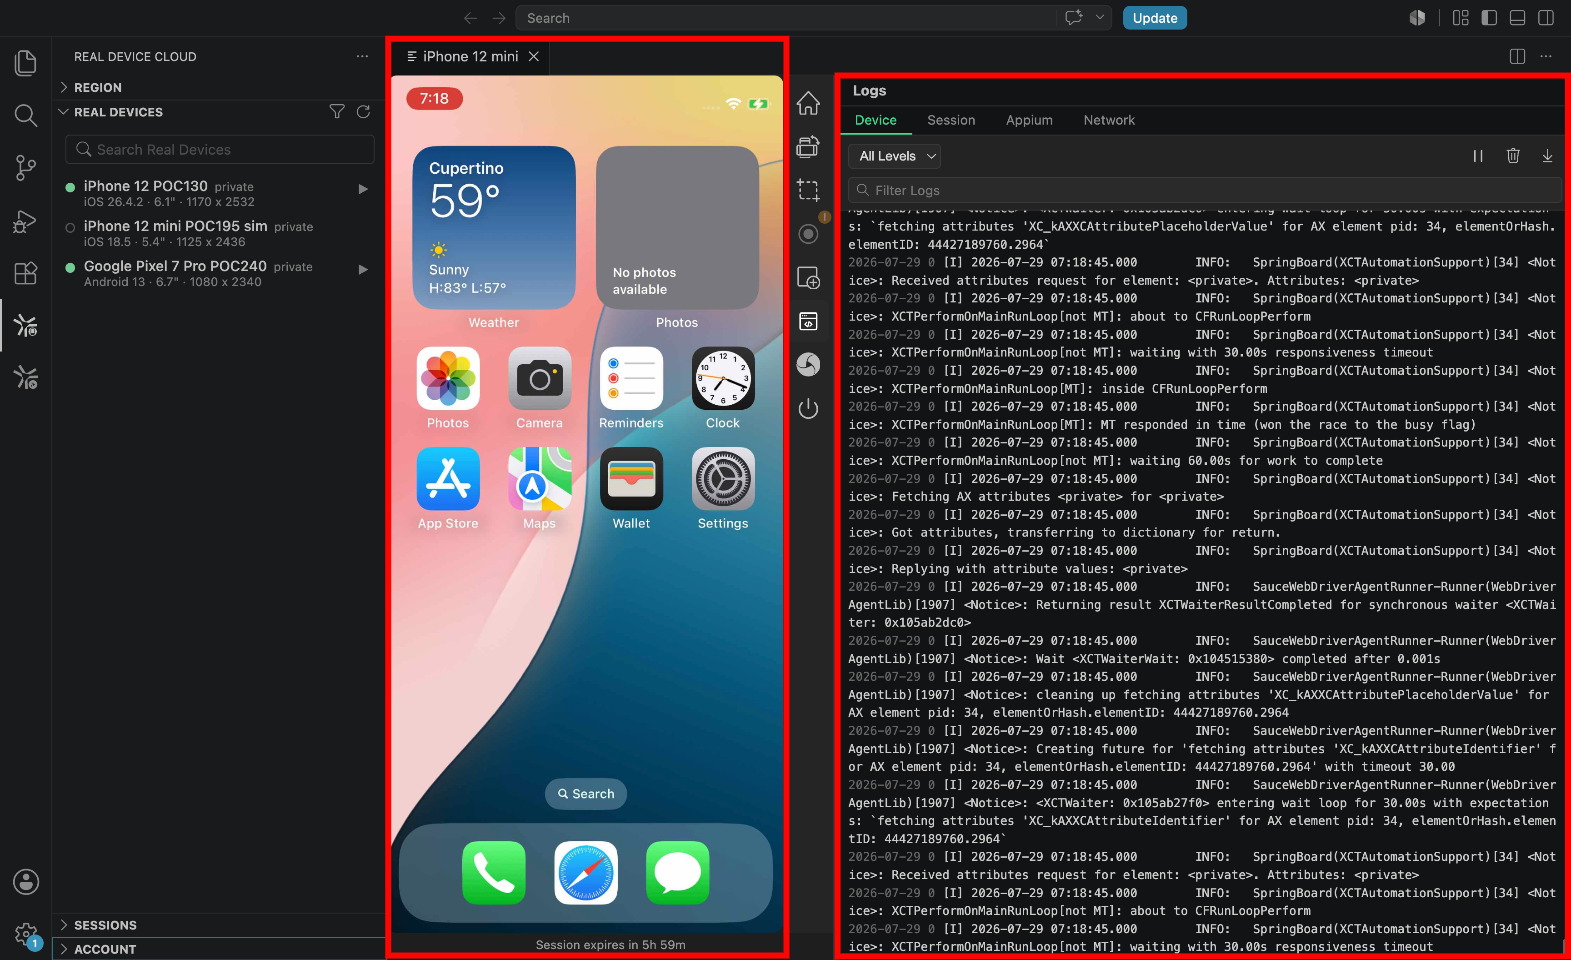
Step 4: After the session starts, a new Sauce RDC tab opens displaying the live device screen. The active session is also listed in the Sessions section, where you can reopen or close it at any time.
If a device is unavailable, choose another available device or refresh the device list to check for newly available devices.
Interact with the device
After starting a live session, the selected device opens in the Sauce RDC tab. The device screen is streamed in real time, allowing you to interact with the physical device directly from your IDE.
Perform Touch Gestures
Use your mouse to interact with the device just as you would with a physical touchscreen.
-
Tap: Click anywhere on the device screen to simulate a tap.
-
Swipe or Drag: Click and drag across the screen to perform swipe and drag gestures.
Use Device Controls
The device toolbar provides quick access to common hardware controls, allowing you to perform actions without interacting directly with the device screen.
| Ref. | Hardware Button | Description |
|---|---|---|
| 1 | Home | Return the device to the home screen. |
| 2 | Back (Android only) | Navigates to the previous screen or action. |
| 3 | App Switch (Android only) | Opens the recent apps screen, allowing you to switch between running applications. |
| 4 | Rotate | Changes the device orientation between portrait and landscape. |
Multi-touch gestures, such as pinch-to-zoom, and hardware keyboard input are not supported. Use the device's on-screen keyboard to enter text.
Install your app
Install a build directly on the active device:
- Drag a
.apkor.ipafile onto the device screen, or click the upload button in the panel toolbar and pick the file. - The plugin uploads the build to Sauce Labs app storage and installs it on the device. Progress is shown in the panel.
- iOS apps are instrumented automatically during installation.
Capture screenshots and recordings
- Screenshot: click the screenshot button in the toolbar. The current frame is saved as a PNG file and opened in the editor automatically.
- Record: click the record button to capture the session as an MP4 video. Recording requires FFmpeg on your
PATH; see Prerequisites. Long recordings can consume significant disk space.
View logs in real time
During a live session, the Logs panel streams diagnostic data from the device into your IDE, so you can read logs next to the code that produces them instead of switching to the web dashboard. The streams are grouped into tabs:
| Tab | Contents |
|---|---|
| Device | The device system log (logcat on Android, syslog on iOS), including your app's output and crash stack traces |
| Session | Events for the current device session |
| Appium | The Sauce-hosted Appium server log for the active session |
| Network | HTTP(S) requests and responses observed during the session |
All streams update live while the session is running. Log lines are color-coded by severity across five levels (Verbose, Debug, Info, Warning, Error), so warnings and errors stand out while you scan.
To narrow what you see:
- By severity: use the level dropdown (All Levels by default) to show only lines at or above a given severity.
- By text: use the Filter Logs box to narrow the visible lines to those matching what you type. The filter is debounced, so it applies as you finish typing rather than on every keystroke.
The panel toolbar also lets you pause the stream, clear the panel, and download the log. To keep the panels responsive, each stream keeps the most recent 5,000 lines.
A typical debugging loop: reproduce the problem on the device screen, watch the Device tab for the crash stack trace, check the Network tab if a backend call is involved, then fix the code and reinstall the build on the same session. All without leaving your IDE.
Run Appium tests against the live session
Run your local Appium tests against whichever live device session you have open, without editing test code or copying connection URLs by hand.
When you enable Appium injection, the plugin starts a Sauce-hosted Appium server for the active device session and injects its URL into your environment as the SAUCE_APPIUM_URL variable. Your tests read the variable and connect to the live device. When the toggle is off, they fall back to your local Appium server.
One-time setup
-
Start a live session on the device you want to drive.
-
Click
Appium: OFFin the status bar (bottom left). It flips toAppium: <device name>to indicate injection is active. You can also run Sauce RDC: Toggle Appium Injection from the Command Palette. -
Open a new integrated terminal (Terminal > New Terminal). Terminals opened before you flipped the toggle do not have the variable, so re-open them.
-
Verify the variable is set:
echo $SAUCE_APPIUM_URLYou should see a URL like
https://ondemand.us-west-1.saucelabs.com/wd/hub.
Make your test read SAUCE_APPIUM_URL
Open any .java, .kt, .py, .js, or .ts test file that constructs an Appium driver. An "Add SAUCE_APPIUM_URL support" code annotation appears above the driver initialization line. Click it to rewrite the code automatically. In Java, for example:
String appiumUrl = System.getenv("SAUCE_APPIUM_URL");
if (appiumUrl == null || appiumUrl.isEmpty()) {
    appiumUrl = "http://localhost:4723";
}
AppiumDriver driver = new AppiumDriver(new URL(appiumUrl), caps);
Equivalent transforms are available for Kotlin, Python, JavaScript, and TypeScript.
With this pattern, your tests run against the live Sauce Labs session when the toggle is on and fall back to local Appium at localhost:4723 when it is off. No branching logic in your code and nothing to undo before committing.
Debug configurations
The plugin also injects SAUCE_APPIUM_URL into launch configurations for ten supported debug adapter types (including Node.js/TypeScript, Python, Java, Kotlin, .NET, Go, Dart, and Ruby), so Run and Debug picks up the variable the same way your terminal does.
- The Appium server is co-located with your device session and its lifecycle is managed by the plugin. You do not need to start or stop anything on Sauce Labs yourself.
- If a test cannot connect, confirm the status bar shows
Appium: <device name>, that the session is still running, and that the terminal you are using was opened after you enabled injection.
Session lifetime
Every session has an expiry deadline:
- A countdown is shown in the device-view header and in the Sessions sidebar, color-coded as the deadline approaches.
- A warning notification fires five minutes before the session ends.
- When the countdown reaches zero, the panel closes itself automatically so you do not keep interacting with a dead session.
To end a session yourself, click Stop in the panel toolbar, or right-click the session in the Sessions section and choose Close Session.