Measuring Your Test Coverage
The Coverage report allows you to view and download the breakdown of browsers and mobile devices the tests across their organization have run against. Having insight into your coverage data helps companies:
- See at a glance whether their testing is in sync with the environments in which it is most often accessed
- Evaluate how evenly tests are being distributing across browsers and devices
- Design their test strategy to keep up with newly released browser and device versions
- Utilize their concurrency to spread testing across test environments for greater efficiency and comprehensiveness
Accessing the Coverage Reports
- Click the Insights tab to expand its submenu.
- Click Coverage.
- Specify the type of coverage you wish to view by selecting the Devices, Browsers or OS tab.
- If you choose Devices or OS, specify wheter you wish to see coverage data for:
- Virtual Cloud tests: desktop web-apps, mobile emulators and simulators.
- Real Devices tests: physical devices located in our data centers and connected to our platform.
- Apply the Owner and Time Period filters to show data for a particular user's tests and/or a specific time period.
- If you choose Real Devices, apply the Device Group filter to show data only for Public or Private devices.
Once you have completed your selections, the report shows a breakdown of all tests that have been run for the specified user during the specified time period, providing the exact number and total duration of tests run in each environment with a bar graph for easy visualization.
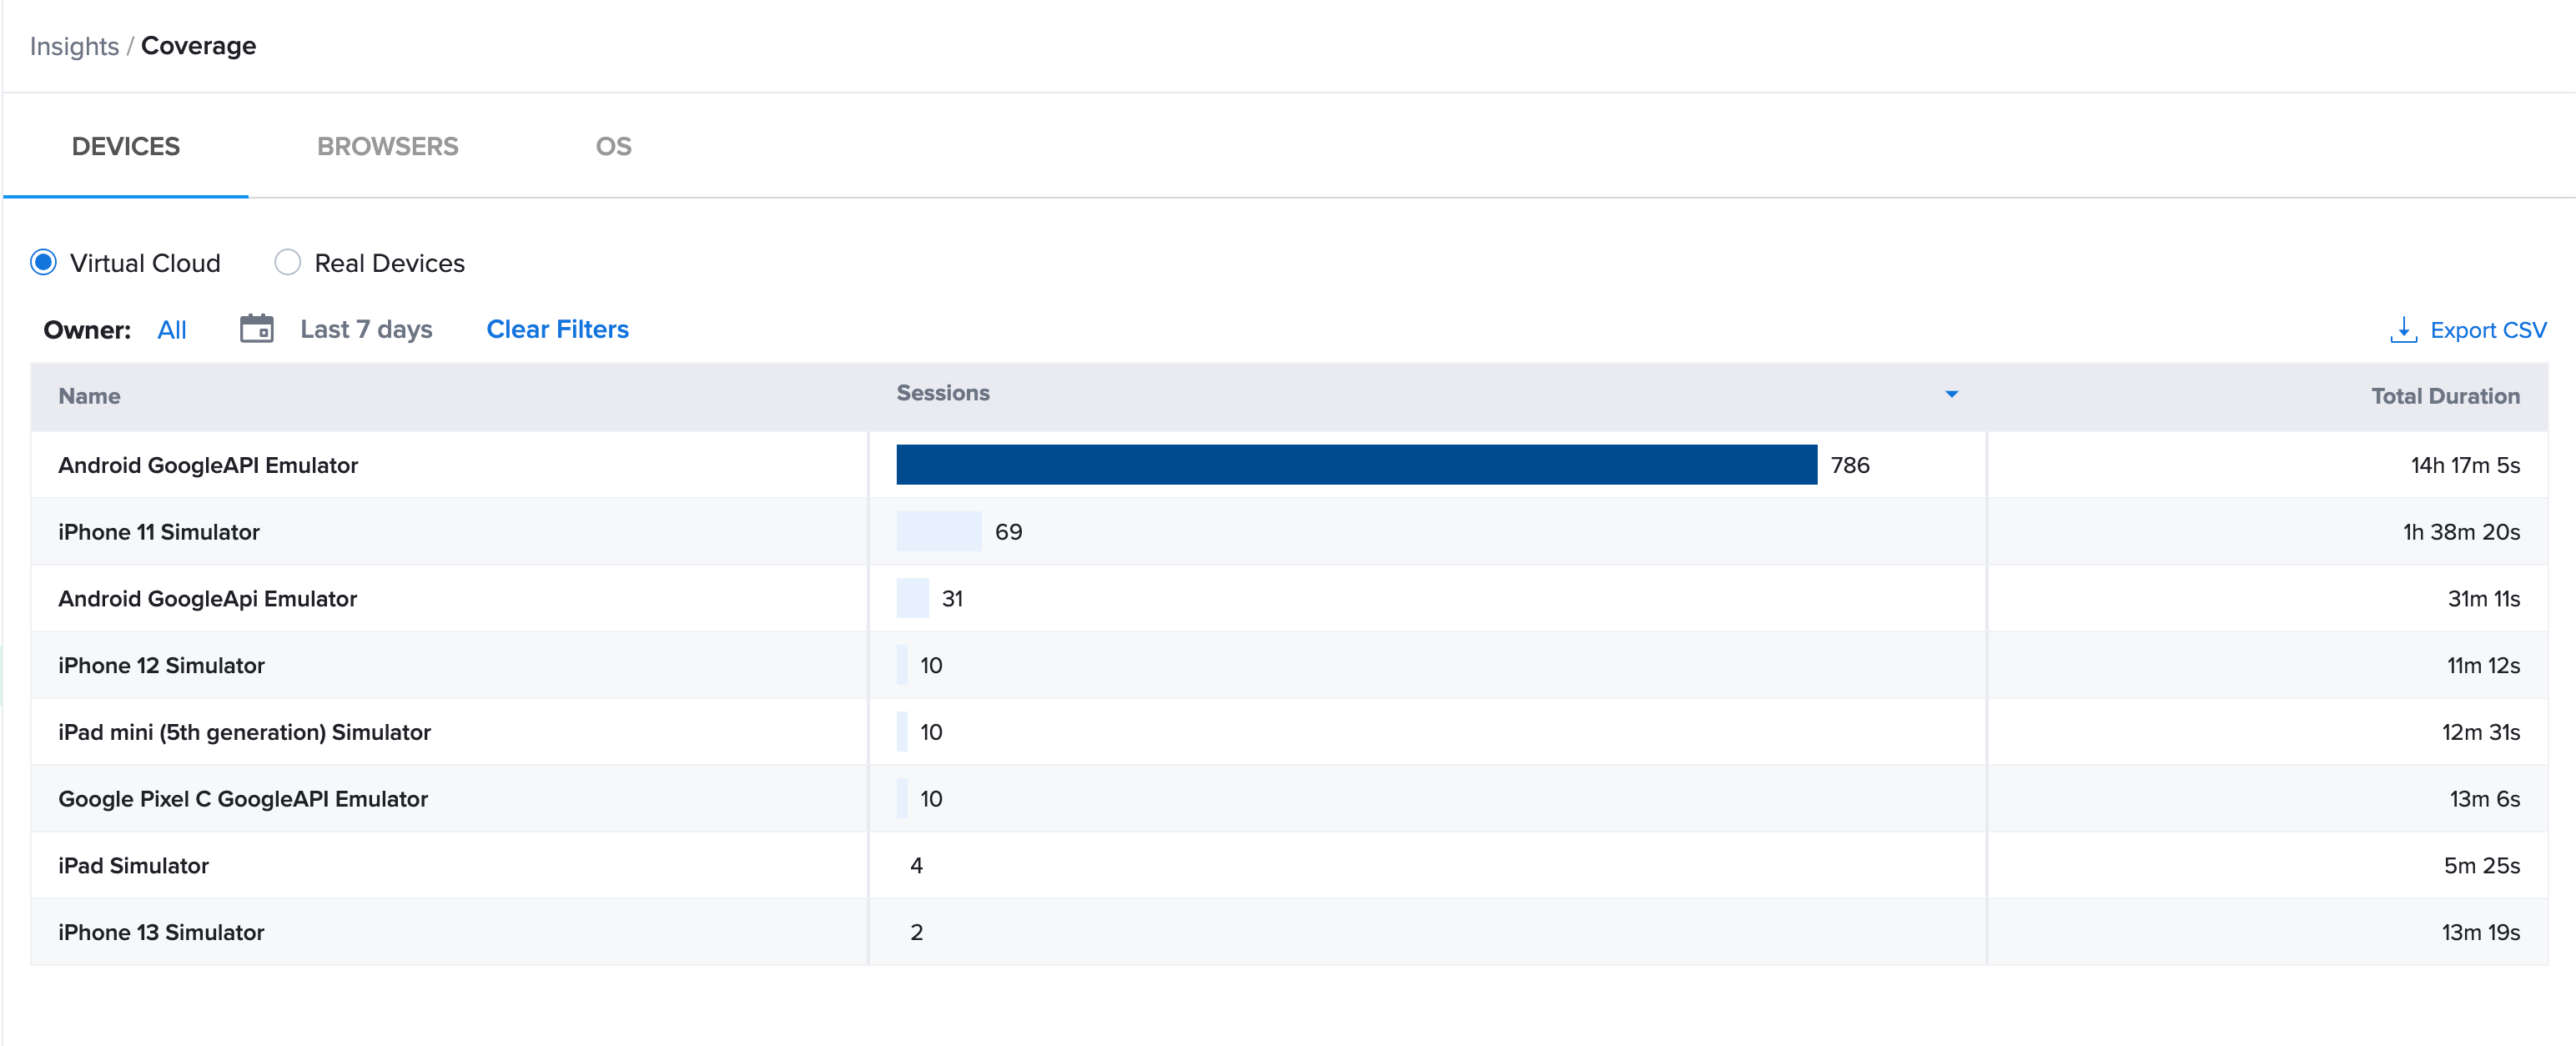
Browsers and devices that were not tested during the indicated period are omitted from the report.
Sorting the Data
By default, coverage is shown in descending order based on the number of tests run. You can modify the sort order by clicking on any of the column headings and then toggling the ascending/descending icon.
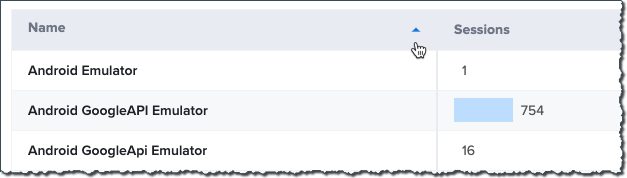
As the image shows, sorting by the Name column sorts the data alphabetically by the name of the browser, device or OS, allowing you to quickly discern how much coverage a particular environment has in your testing.
Downloading Your Report
You can download your report locally as a CSV file by clicking the Export CSV link.
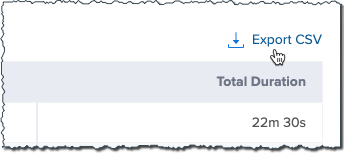
The resulting file includes the data as it is filtered (by environment, owner, and time period) in the default order, regardless of any sorting you have specified in the UI.
,name,sessions,total_duration
1,iPhone SE (2nd generation) Simulator,6640,149:56:54
2,iPhone XS Max Simulator,6630,163:13:55
3,iPhone XS Simulator,6618,155:56:57
4,Android GoogleAPI Emulator,753,9:49:41
5,iPad Simulator,112,2:00:02
6,Android GoogleApi Emulator,16,0:16:10
7,Samsung Galaxy S8 HD GoogleAPI Emulator,7,0:06:13
8,iPad mini (5th generation) Simulator,6,0:10:38
9,Google Pixel C GoogleAPI Emulator,6,0:06:24
10,iPhone 12 Simulator,2,0:01:48
11,iPad Pro (12.9-inch) (3rd generation),1,0:02:00
12,Pixel3GoogleAPI,1,0:03:07
13,Android Emulator,1,0:22:30