Concurrency Usage Report
Sauce Labs Usage provides you with an accurate view of your concurrency data and lets you compare it to your subscription limit. Your team can cull, filter, and break this data down to best suit your needs. Check your usage of both Virtual Devices and Real Devices to understand your teams' testing patterns. Finding the right cross-section of data is easy and intuitive with a few actions like:
- Visualizing the concurrency usage at organization level or by team level.
- Compare concurrency usage between teams.
- Adjust date-range filters to understand usage across time.
- Visualize the maximum concurrency usage as it approaches the subscription limit.
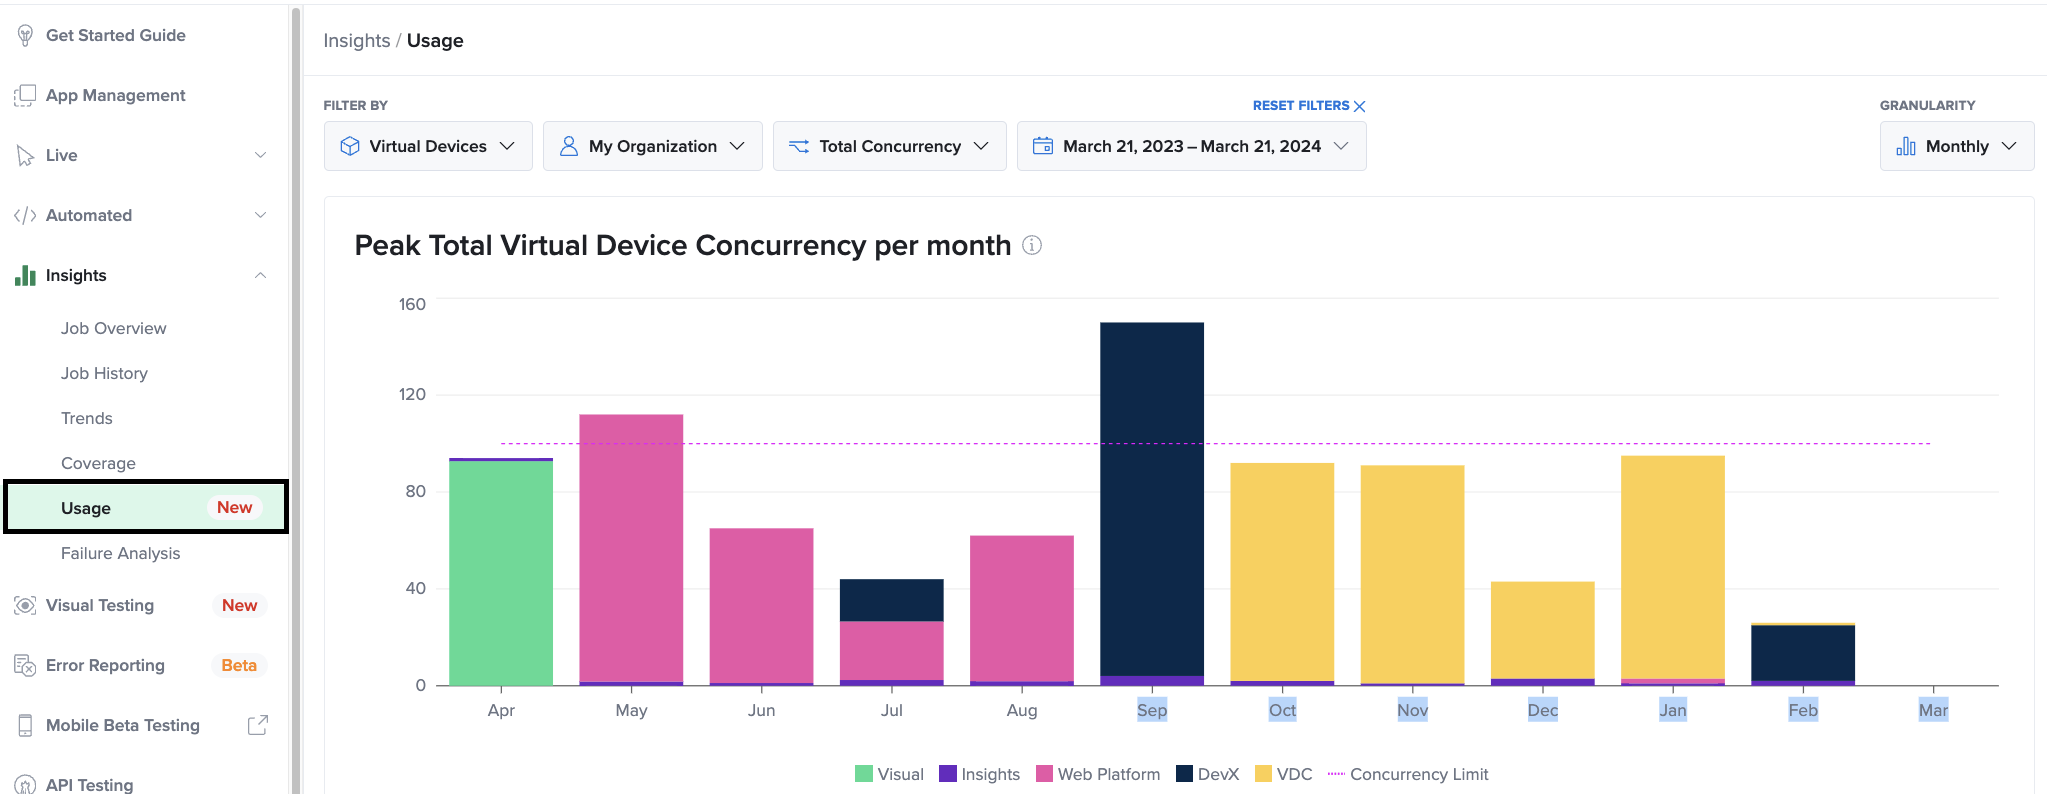
Taking advantage of Suace Labs Usage data is simple. Log into Sauce Labs and from the left panel, expand the Insights section and select Usage.
How it Works
Sauce Labs Usage reporting calculates the maximum concurrency during a given interval of time broken down by Month, Week, Day or Hour for each team with usage greater than zero during that period and presents the information using stacked bars to show how much each team contributed to that usage.
Available Views
Total Concurrency Usage
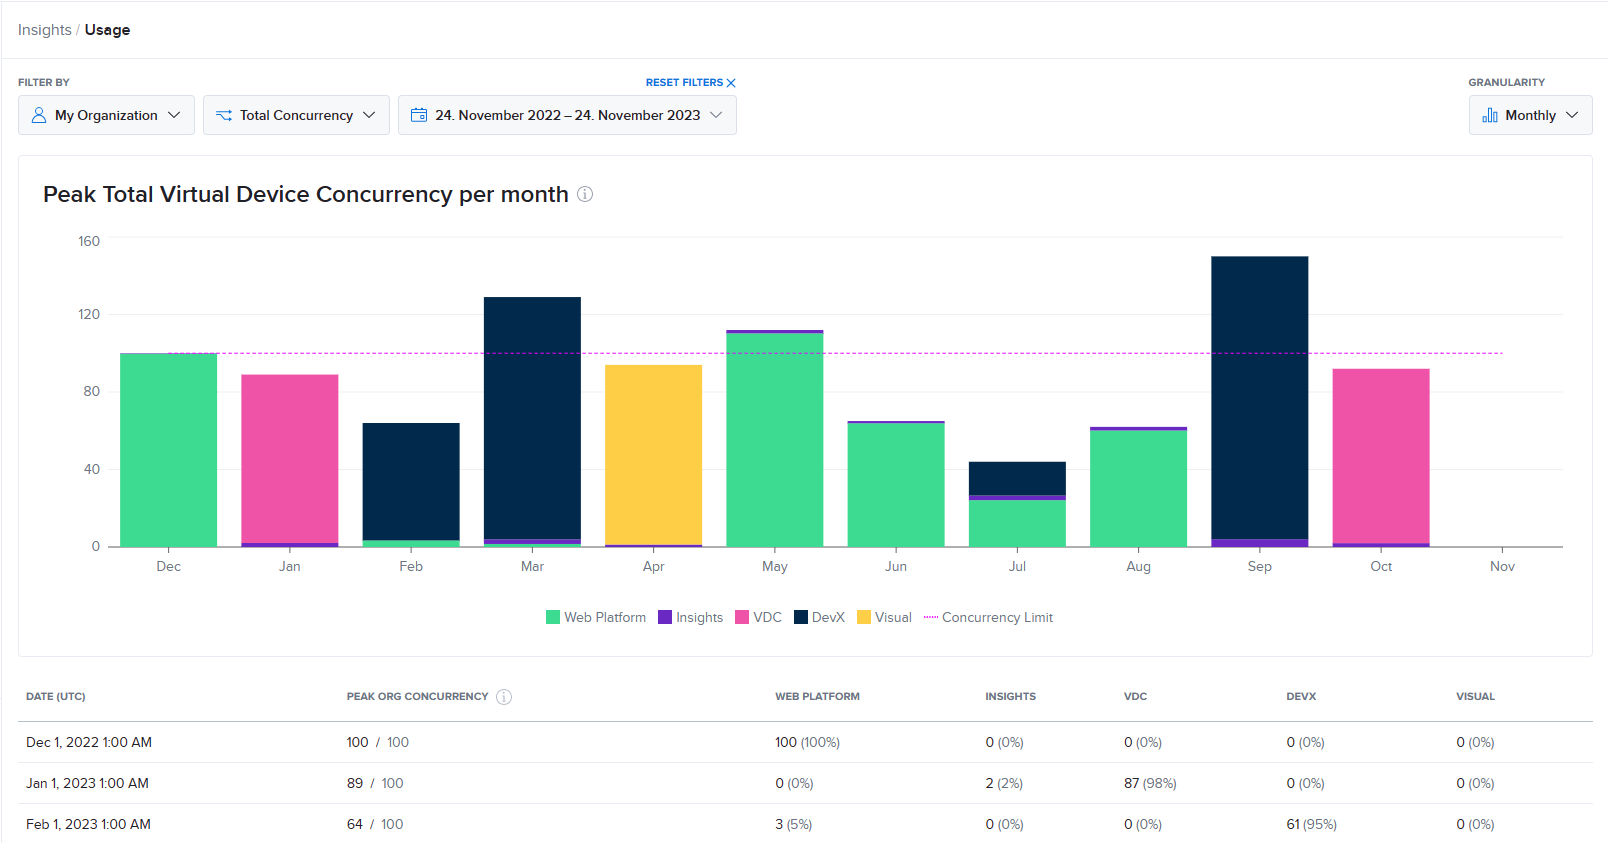
In this view, the chart shows the total concurrency usage at an organization level compared to the subscription concurrency limit for each month. Each bar shows the maximum number of concurrent executions and adds them up to create the total usage.
It is possible that this chart shows values above the organization limit even when teams have not gone above their individual limit. To see the usage at team level, select the corresponding team in the dropdown from the filters.
VM Concurrency Usage
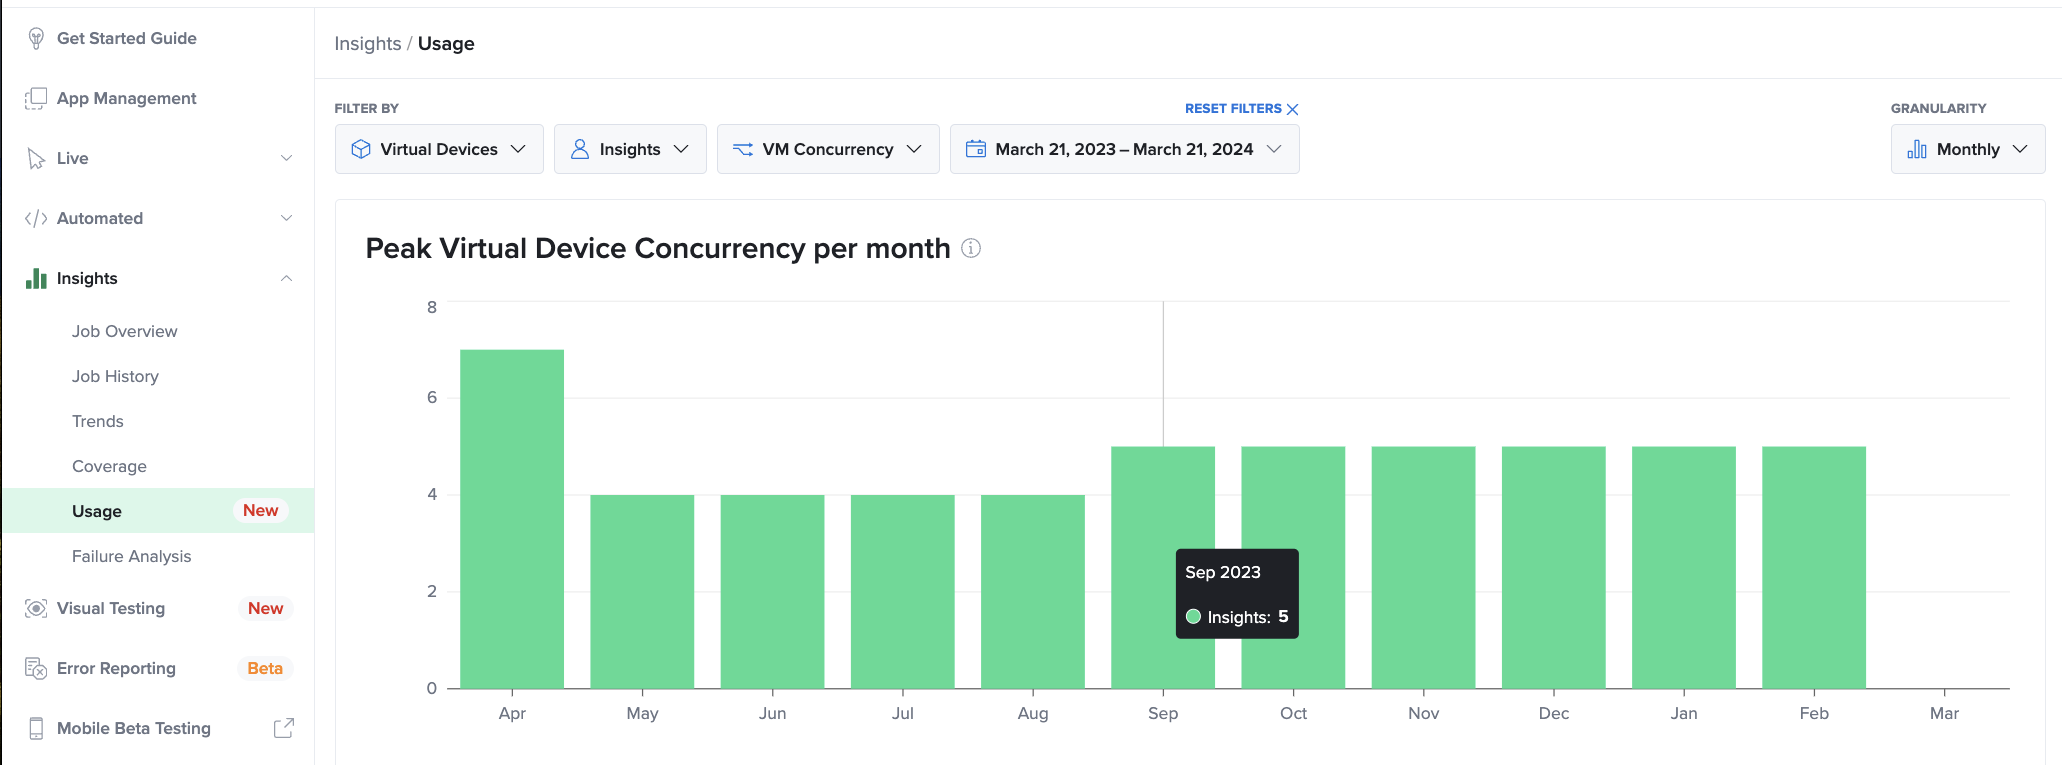
Shows the total concurrency, aggregating all devices grouped by team. This information can be broken down by:
- VM Concurrency: Shows the concurrent usage for tests executed on Linux Browsers, Windows Browsers and Android Emulators.
- Mac VM Concurrency: Shows the concurrent usage for tests executed on Mac OS, Mac OSX and iOS Emulators.
Real Device Concurrency and Usage
With Sauce Labs Real Device usage analytics your organization can get a view of both Public device concurrency usage as well as Private device usage to get the most of your Sauce Labs testing strategy. Our real dvice usage analytics give you many of the same benefits as our Virtual device usage reporting such as:
- Ability to visualize usage at organization level or by team level.
- Access to expanded date range data and granularity options.
- Comparison of usage between teams.
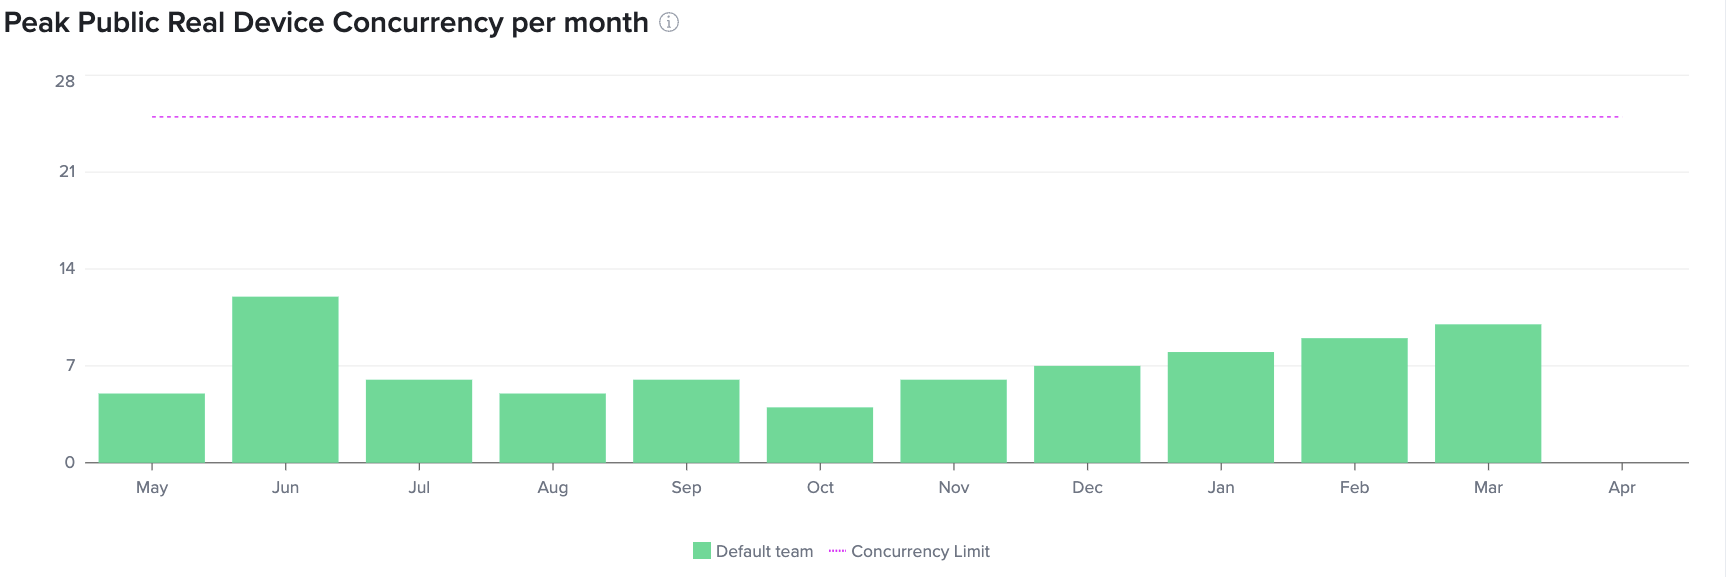
- Visualize the maximum Public device usage as it approaches the contractual limit.
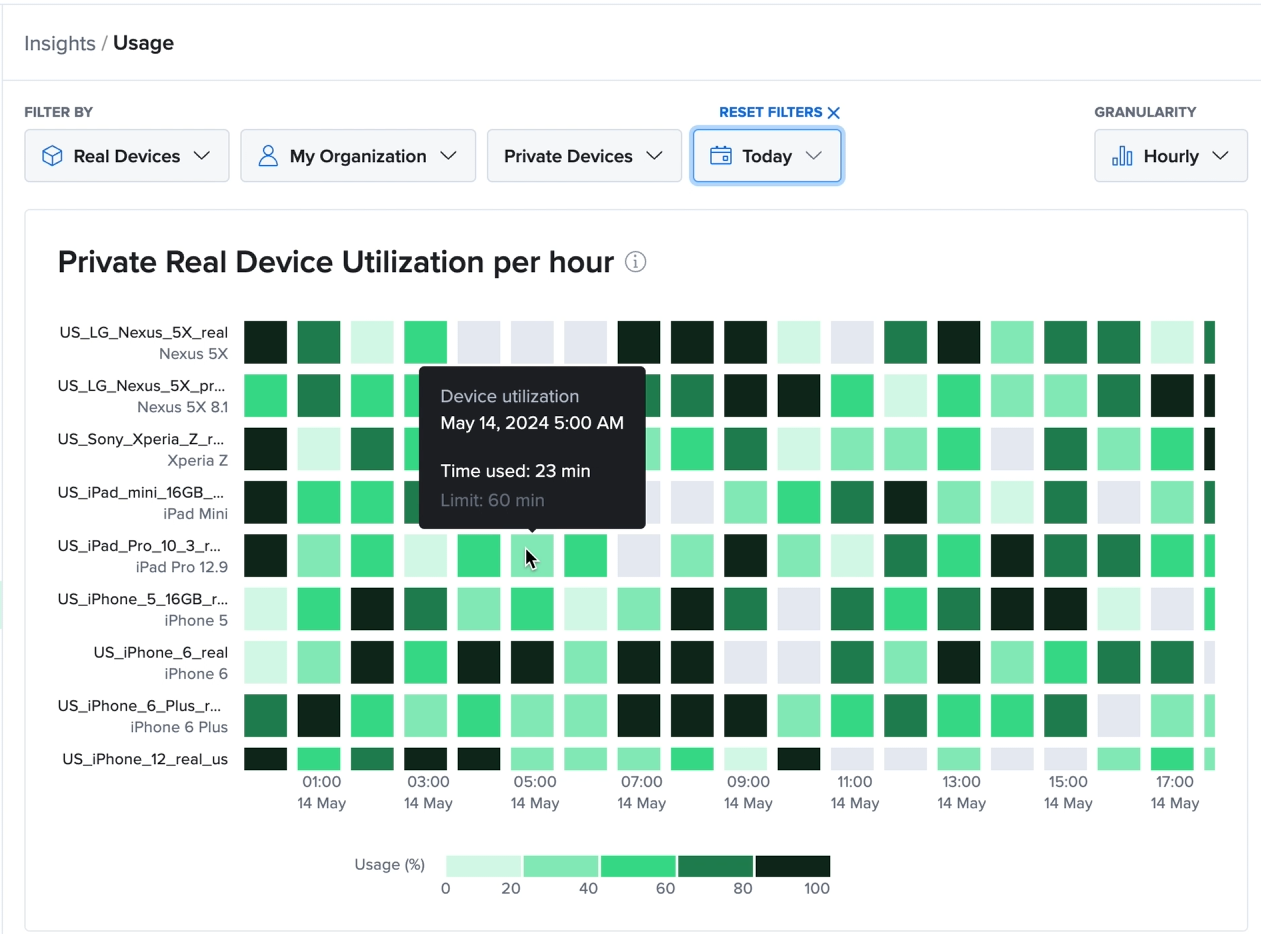
- Visualize Private device usage to best utilize your organization's devices.
- Access to usage data via the Sauce Labs UI and API.
Public Device Concurrency
Private Device Usage
Usage Reporting Email Notifications
Get clear and consistent updates delivered directly to your inbox when your organization is reaching or approaching different limits of your concurrency subscription. All the benefits of our Usage reporting like visualizing the concurrency usage at an organization level or by team level, comparing concurrency usage between teams, and visualizing the maximum concurrency usage as it approaches the subscription limit are still present in the Usage tab, now with the added benefit of getting better visibility into your subscription usage on a consistent basis via email.
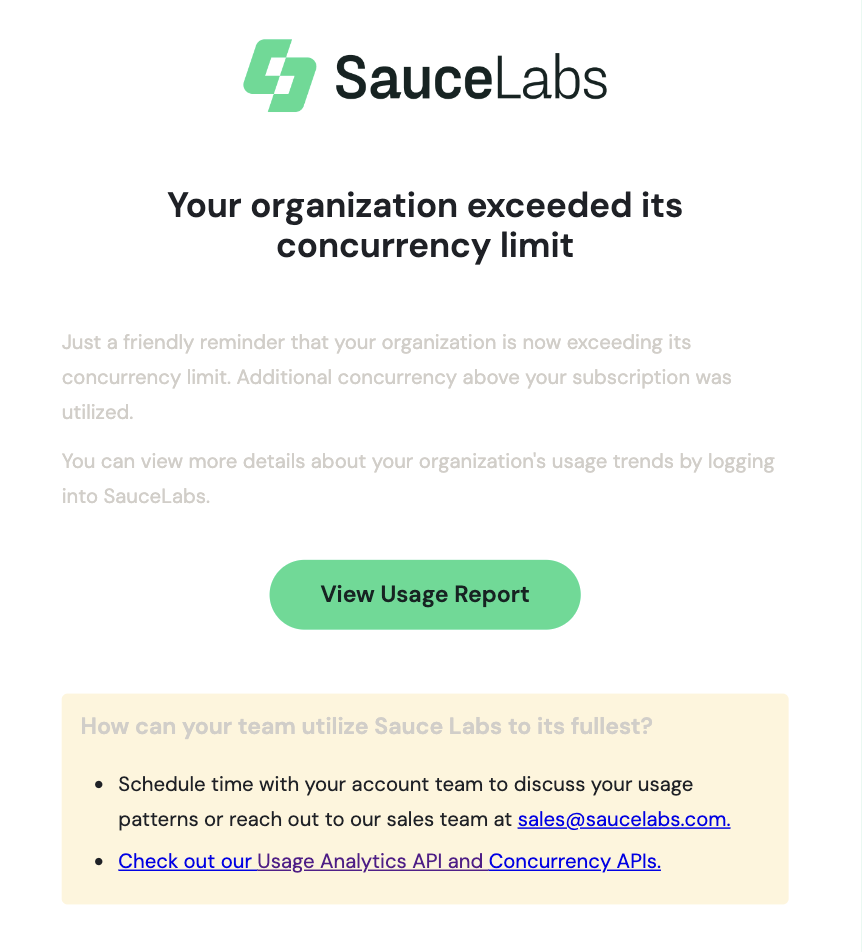
Org admins will be opted into the emails automatically but can choose to disable them via User Settings.
How it Works
There are two emails you may receive once opted into receiving Usage Reports via email.
- Concurrency limit approaching: This email will be sent when concurrency limit has reached 95 - 99.9%
- Concurrency limit exceeded: This email will be sent when concurrency limit has exceeded 100%
Opting Into Usage Report Emails
- Click Account in the top right of your Sauce Labs account on any page
- Select User Settings
- Scroll down to Email Settings and click the toggle to enable Usage Reports
How often are emails sent?
Once opted in, Usage Reports will be sent once a week on Monday mornings.