Evaluating a Test Over Time
The Job History page, accessible from the Insights submenu, provides a visual overview of test results over time. The bar chart representation of test outcomes reveals anomalies and patterns, aiding in the identification of issues related to test performance and flakiness across different platforms, operating systems, and browsers used for testing.
The Extended Debugging feature offers access to HAR files and JavaScript console logs, assisting in the identification of flaky tests. For more details, refer to Debugging Tests with JavaScript Console Logs and HAR Files (Extended Debugging).
Accessing the Job History Page
- Click the Insights tab to expand its submenu.
- Click Job History.
- Apply filters to narrow down the list of tests within a specific range.
Interpreting the Bar Chart Visualization
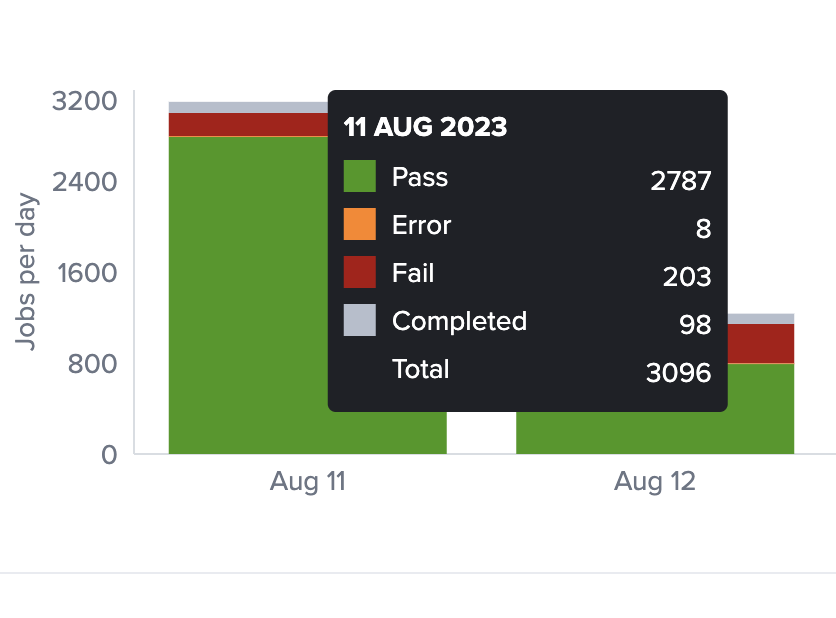
At the top of the page, the bar chart displays the number of jobs executed over time within the specified date filter, considering other filter criteria. You can further analyze trends on an hourly, daily, or weekly basis. Each bar represents the count of tests passed, failed, encountered errors, and completed. Hovering over a bar provides details about these counts.
Below the bar chart, four performance statistics are presented:
- Total Job Unique Names: The total count of aggregated groups of job runs sharing the same name.
- Total Errors: The overall count of test runs that did not complete.
- Total Failures: The total count of test runs recorded as "Failed."
- Average Run time: The mean runtime duration of all displayed test results.
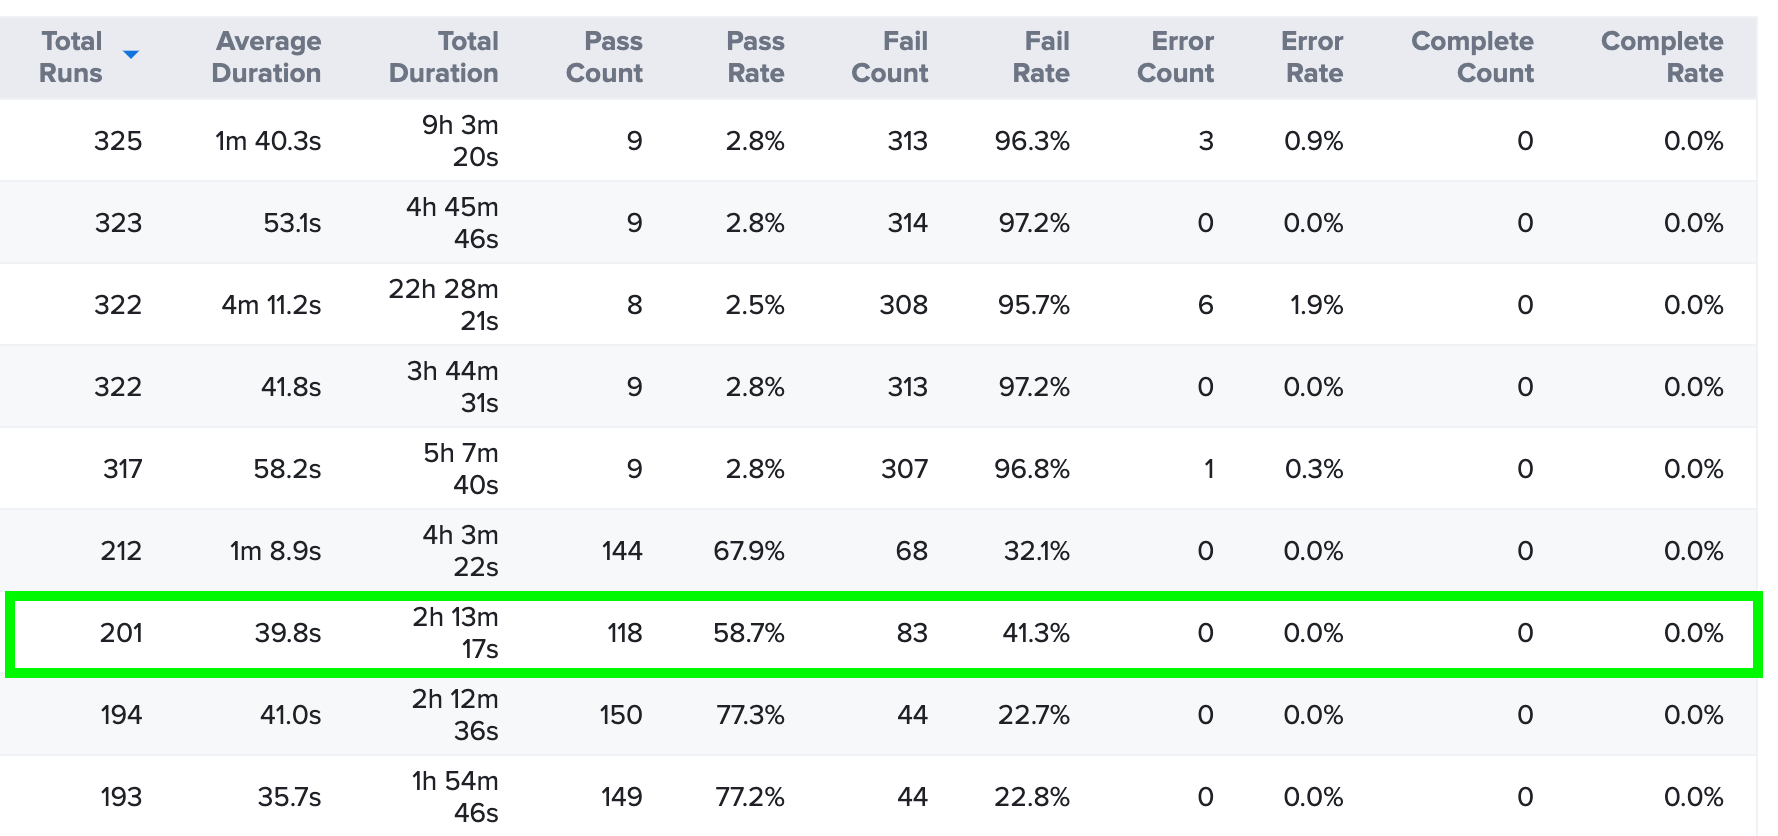
Towards the bottom of the page, a table lists jobs alongside their corresponding details, including total runs, average duration, total duration, count of successful runs, success rate, count of failed runs, failure rate, count of error exits, error rate, count of completed runs, and completion rate.
The default view displays All jobs, but filters are available for analyzing trends of jobs marked as Consistently Failing, Consistently Passing, Consistently Error, Missing Status, or Inconsistent Result.
Additionally, you can adjust the number of items displayed per page and export results as a CSV file.
Example Use Case: Job History Analysis
Choosing the Inconsistent Result option can help identify flaky test behavior. In the provided example, the test failed in nearly half of its executions.
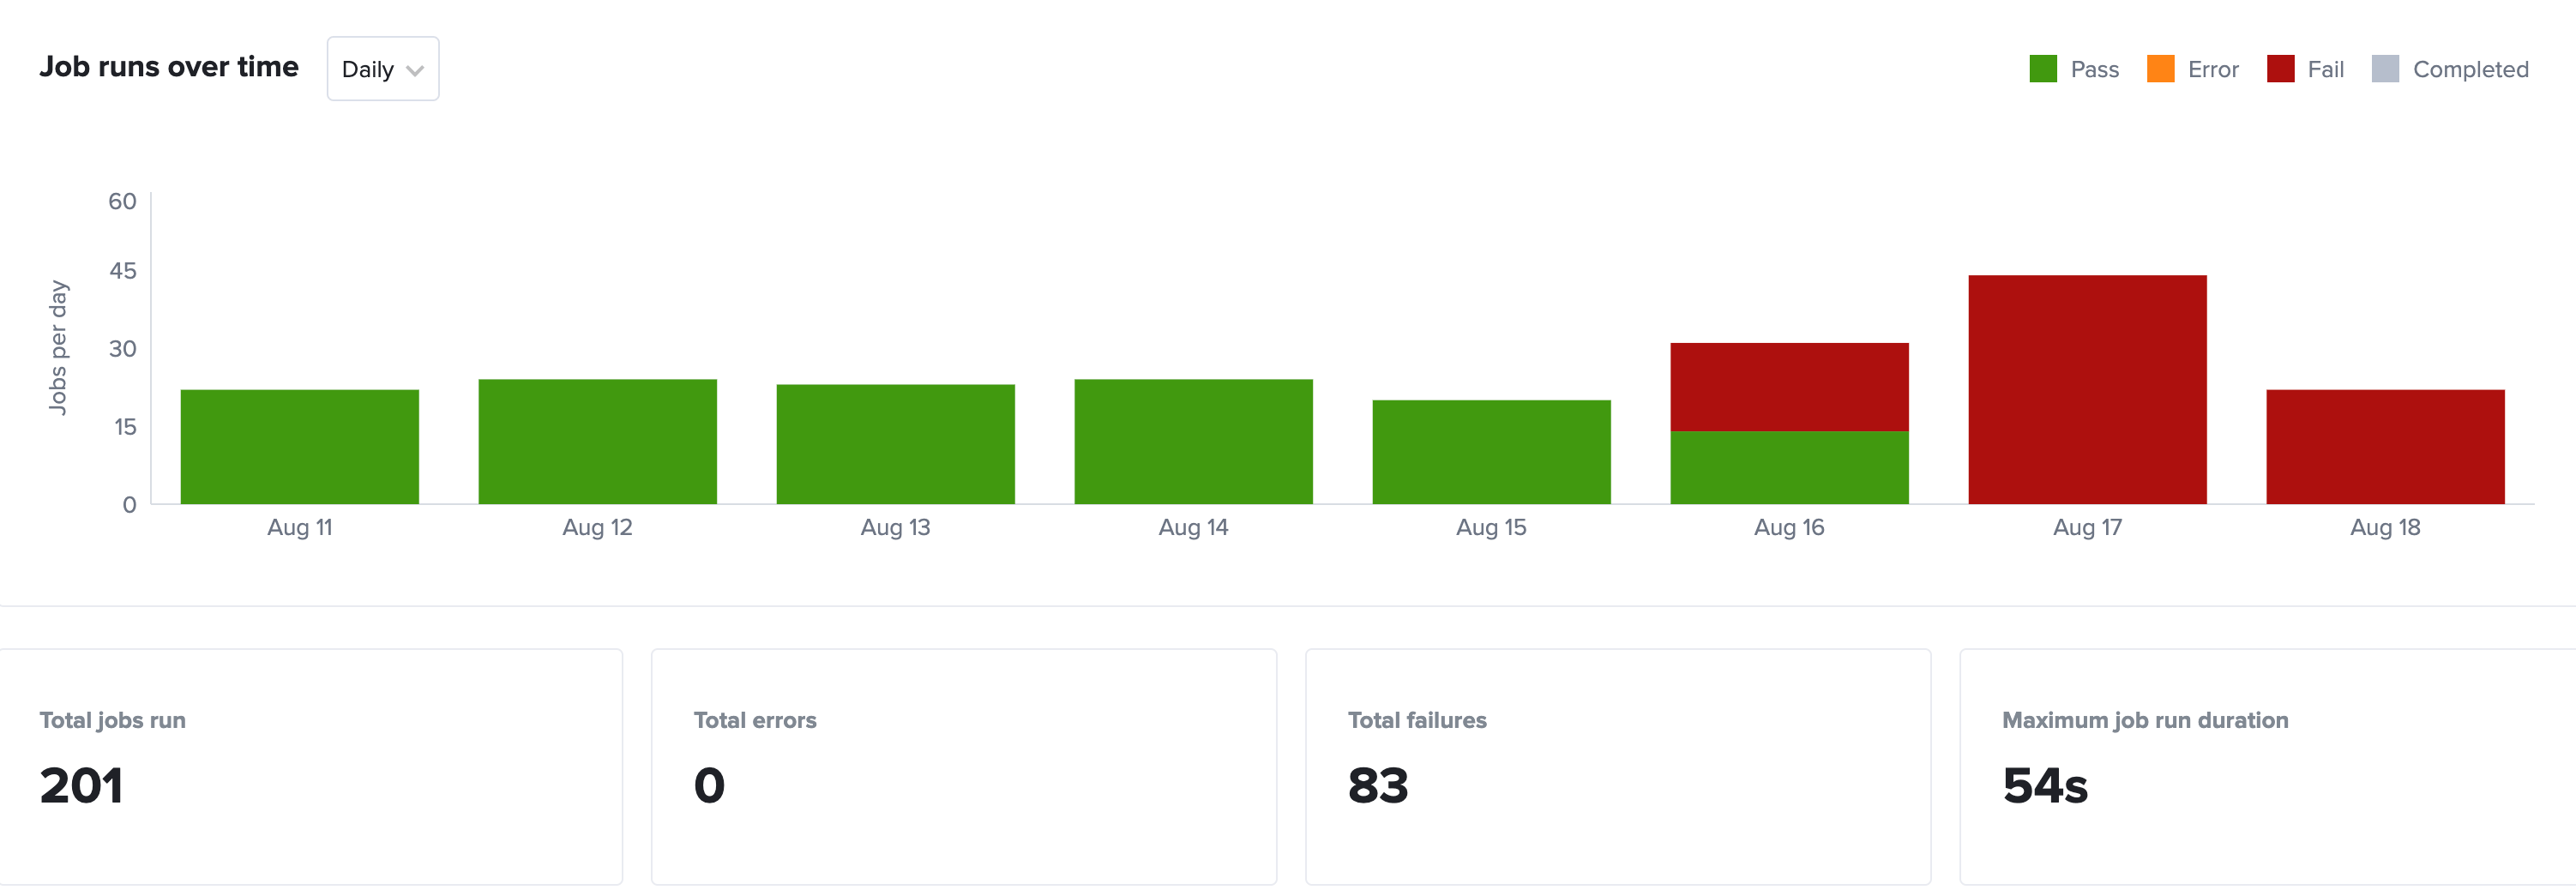
By clicking on the job name, detailed test information becomes accessible. In this case, the test started failing on August 16.
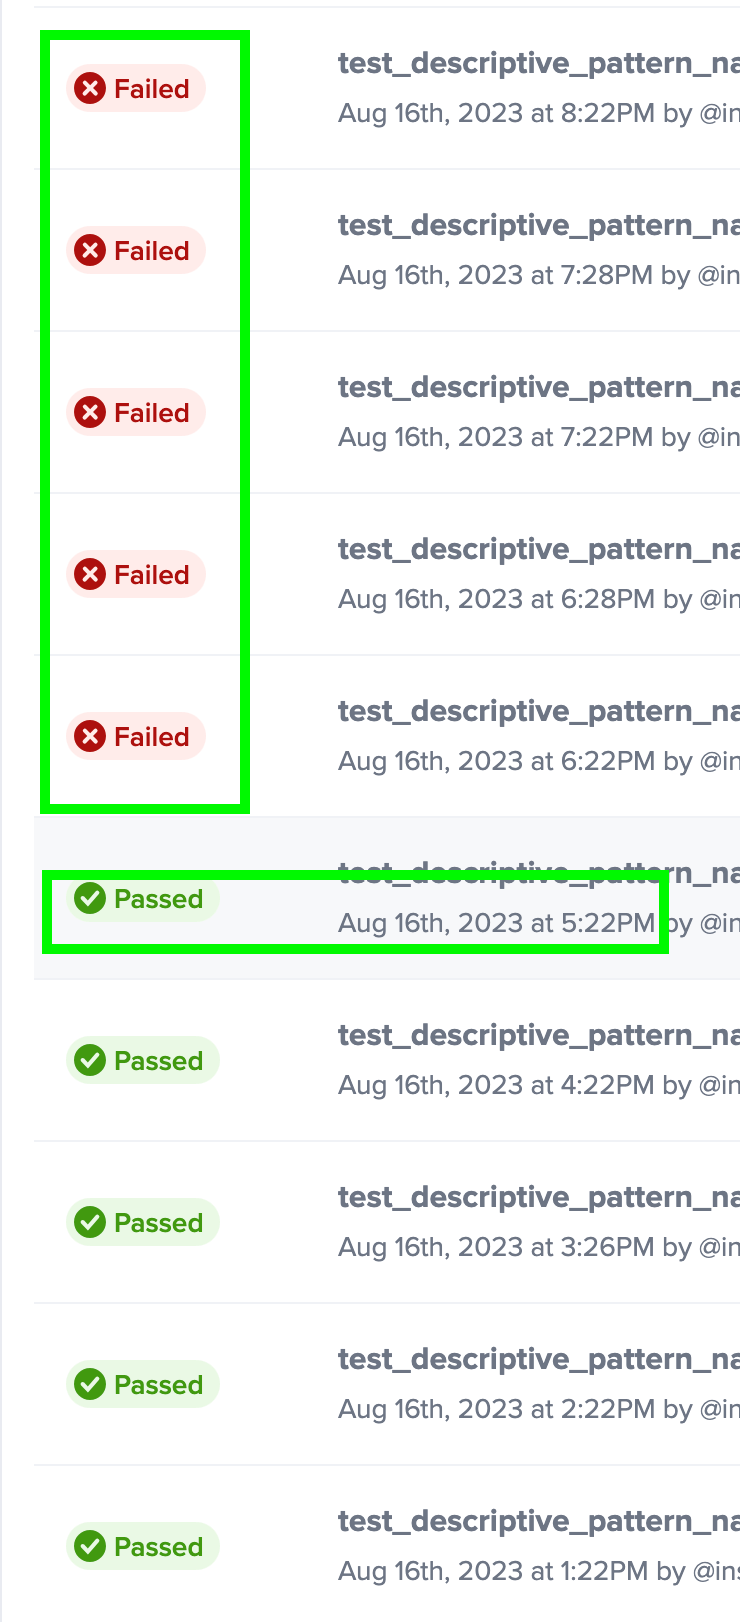
To focus on the day the test started failing, click the August 16 bar in the chart. Scrolling through the list of test results, it becomes evident that the test functioned correctly until 5:22 PM, after which it consistently failed.
This data allows for an investigation into changes made to the test at that specific time, potentially contributing to these failures.