Comparing Statistical Trends
The Trends section of the Insights feature provides a variety of data visualizations to give you a holistic perspective of your test outcomes. The following table describes each section.
| Section | Statistical Information |
|---|---|
| Number of Jobs | The total number of tests run during the specified time period, separated in increments relative to the overall duration. For example, increments may be every 10 minutes for a time period of one hour, while increments might be daily for a 30-day time period. |
| Pass/Fail Rate | For each increment in the time period, the percentage of tests that:
|
| Number of Errors | The total number or errors that occurred during the specified time period, sorted by individual error message. |
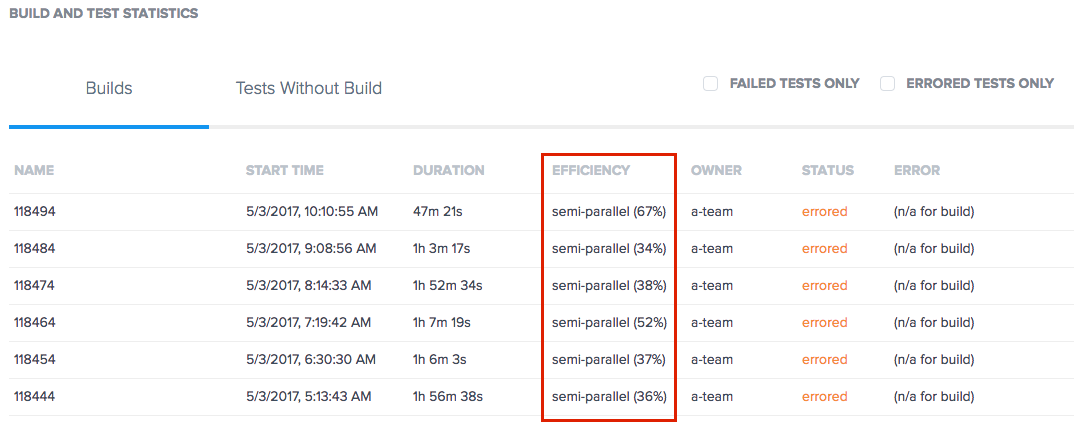
| Build and Job Statistics | A snapshot of all tests run during the time period, displayed in separate tabs based on whether the test is or is not assigned a Build ID. For each test listed, basic data about the time the test was executed, the time it took to run, the Sauce Labs user who ran it, and its outcome. Tests in the Builds tab have an additional statistic — Efficiency — that indicates whether the tests in the build run in parallel to optimize the execution time for the entire build. Tests in the Jobs without build tab have an additional statistic — Error — which displays the error message for the test where it was interrupted. This visualization can be further filtered to show only tests with a failed and/or errored status. |
The above sections are available for Virtual Cloud (VDC) and Real Device (RDC).
You can also filter the results by Owner, Build, Operating System (OS), Browser (in VDC) or Device (in RDC), Device Group (in RDC), Framework, Tag and Time Period. The Time Period is set by default to 7 days, but options are also available: 15 minutes, 1 hour, 6 hours, 12 hours, 1 day, and 30 days, or you can define start and end dates by switching to the Absolute tab in the date range filter.
Drilling Down on Visualizations
The visualizations shown in the Trends section are interactive; you can hover over any of the bars to view a statistics overview for that increment, or you can click-drag across the bars to redraw the graph for a narrower time period. The latter action updates the time period filter at the top of the page accordingly.
Using Trends Data to Improve Testing
The trend visualizations can provide you with a quick overview of what's going on with your tests as a whole, and applying filters to the visualizations enables you to dig into the data to generate answers to specific questions about test performance. Let's look at an example showing how we can use these tools to answer real questions about our site and our tests.
Comparing Test Results on Chrome 50 and 55
To find out how well a site under test performs against a browser update, we start by filtering our data to isolate only the relevant tests — those that are owned by the same organization — were run over the past seven days on Windows 7 for Chrome 55 and Chrome 50. This is a typical use case to compare a set of new tests for a recent browser release against the baseline of an established set of tests for a previous version of the same browser.
Chrome 50
As the figure below shows, more than 3,500 tests were run on Windows 7 for Chrome 50 in the past seven days, with a 41% pass rate.
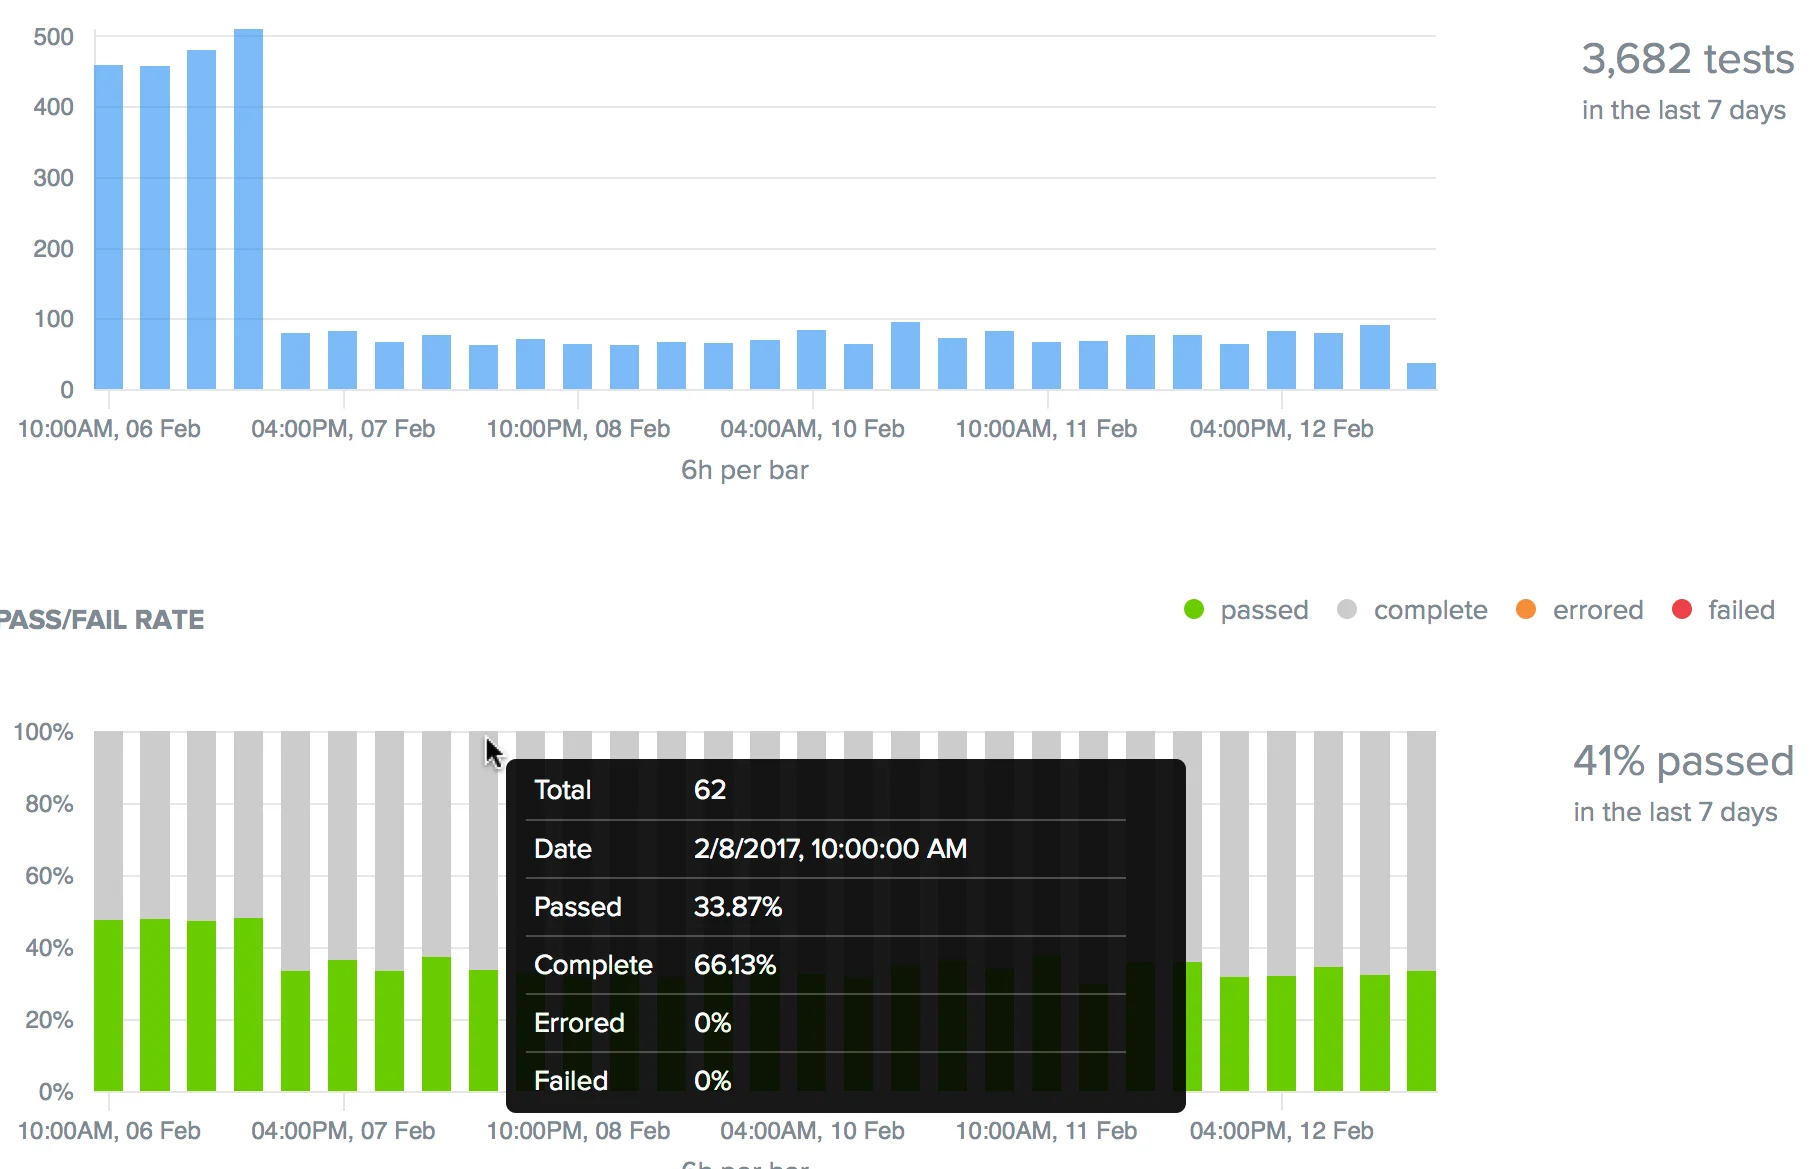
There are no errors, indicating that this is a robust set of tests, but a large number of tests ran to completion without reporting a Pass or Fail status. Hovering over one of the bars in the graph shows that these no-status completions account for about 65% of the tests in every time increment.
While the tests themselves perform well, it's difficult to judge how well the site functions when completed tests do not offer a definitive outcome. To provide a better baseline for cross-browser comparison, annotate these tests with relevant status using the Jobs API or the Selenium Javascript Executor.
Chrome 55
Now let's change the Browser filter to Chrome 55where nearly 4000 tests ran during the same seven-day period.
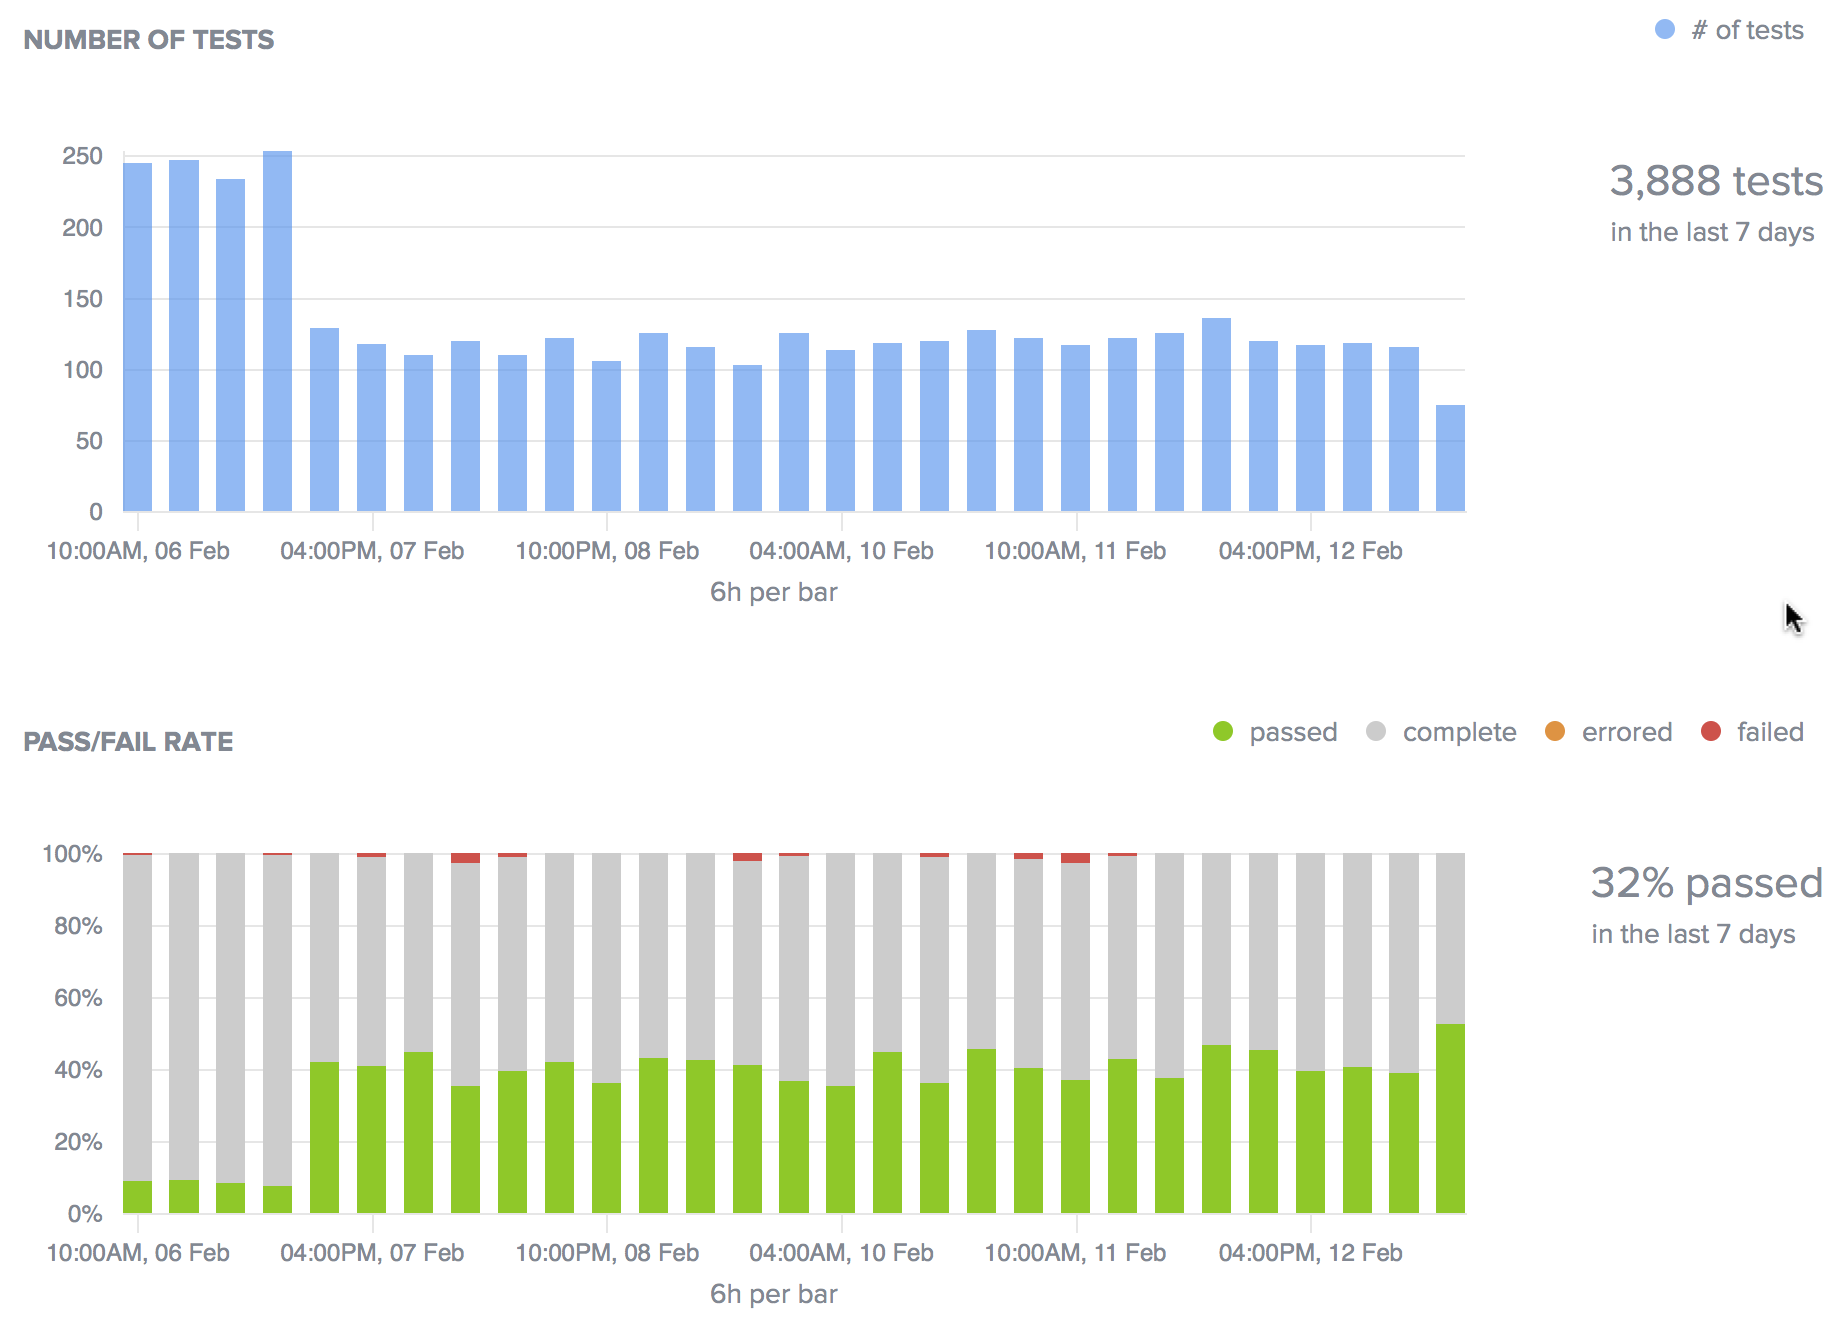
The pass rate for these tests is lower than Chrome 55, at 32% and we still see a lot of completed tests without status. We see some failures showing up, but there are no errors, indicating that the tests themselves seem to execute successfully for both browser versions.
Conclusions
In summary, we see from this browser version comparison:
- Overall coverage is consistent.
- Test performance is good for both, with low error rates.
- Site functionality is ambiguous for both browsers due to the high number of completed tests with no status.
Next Steps
Since our comparison suggests that the tests themselves are strong, but yielded some uncertainty about how well the site performs in either Chrome version, we isolate the time interval that contains the first failing test at 4:00PM on February 7. Then, we can drill down to the five-minute scale to find the exact test that failed.
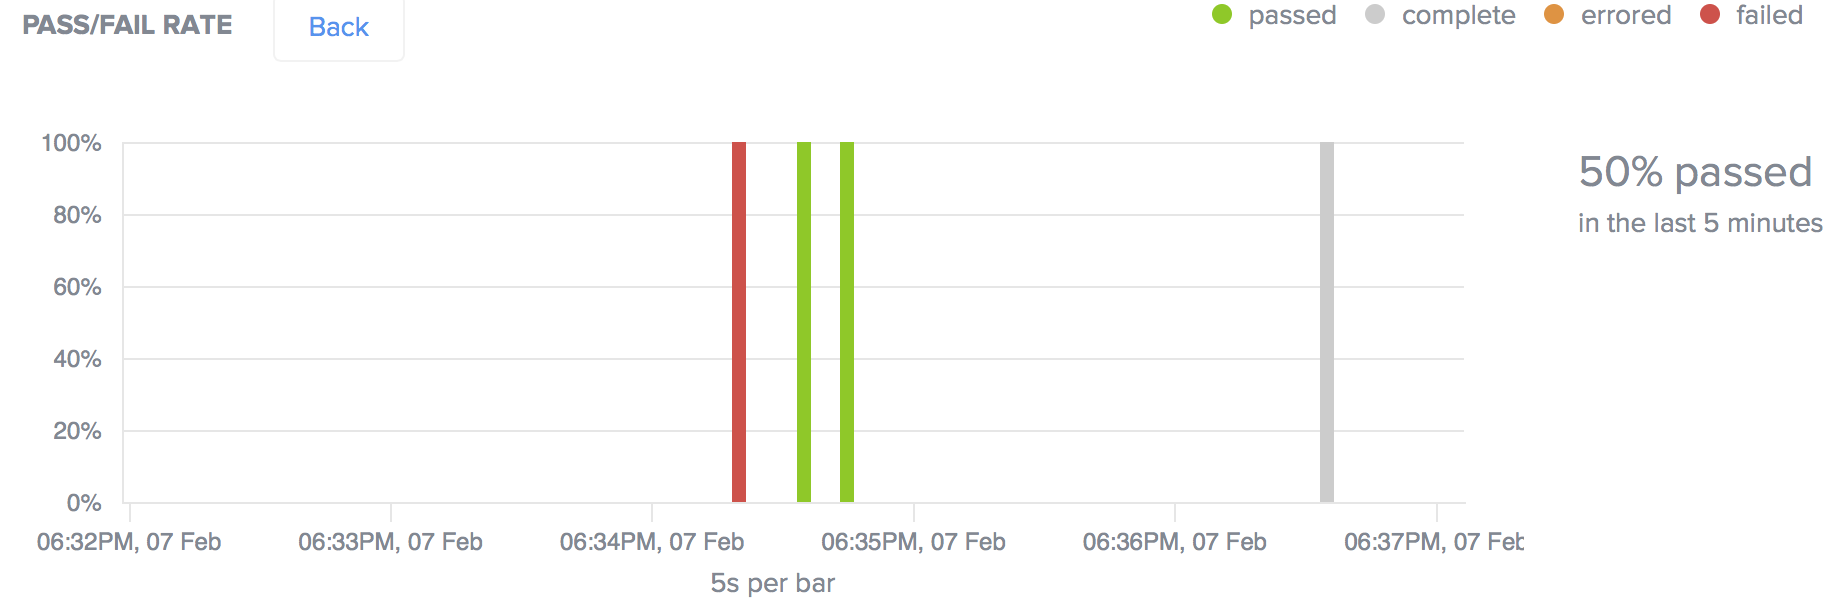
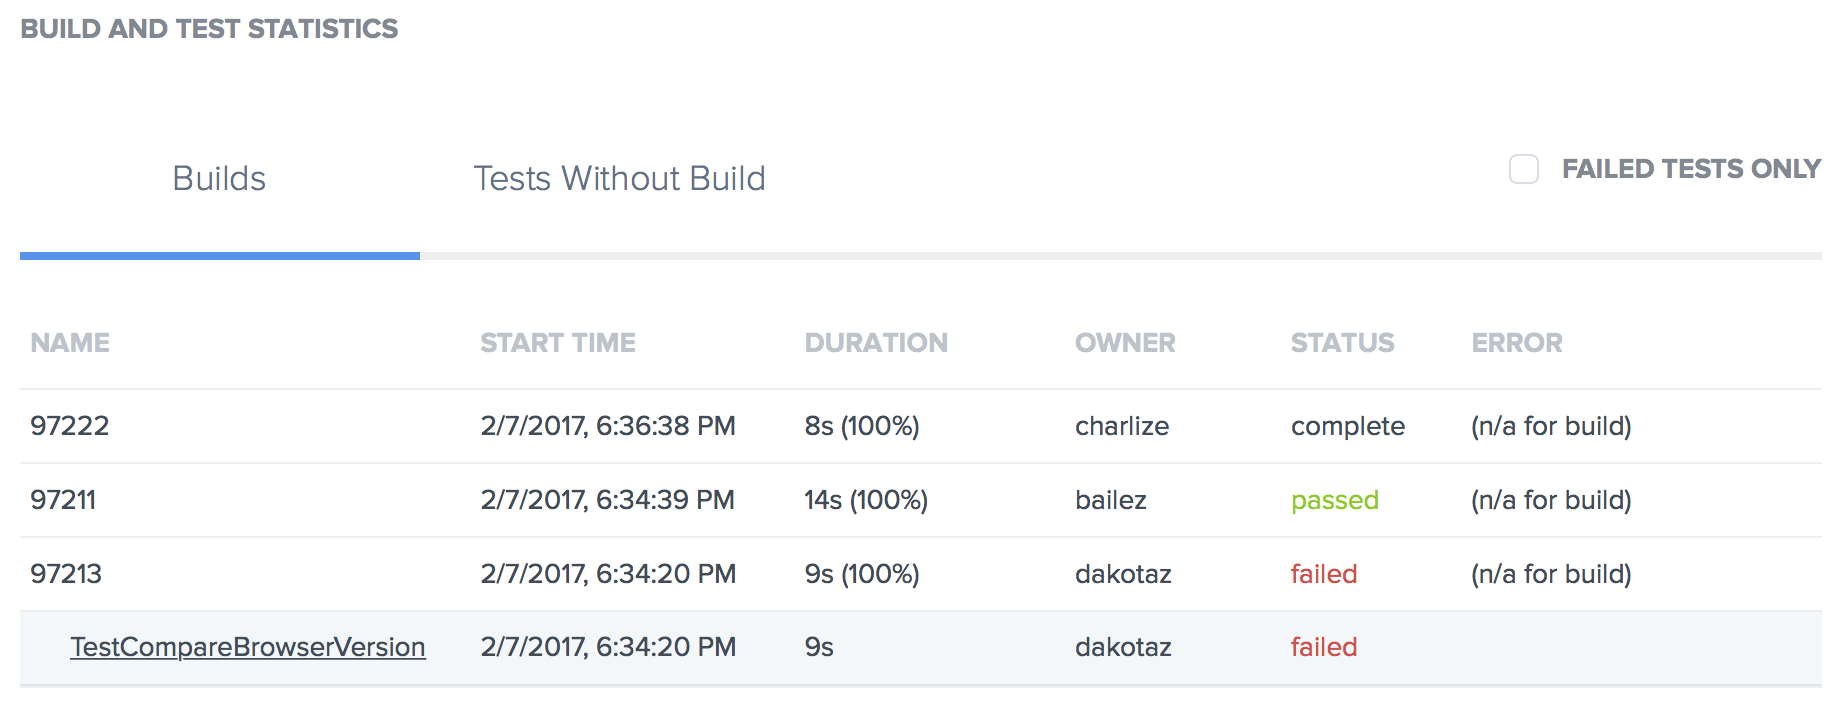
Once we have isolated the failing test, we can check the Builds list and find the failing test, TestCompareBrowserVersion. Click that test name to see the Test Details page, where you can review the videos, screenshots, logs, and metadata that can help you determine why the test failed for Chrome 55.
Using the Efficiency Metric to Optimize Tests
The Builds and Test Statistics section of the Trends page provides an Efficiency metric for builds that indicates the percentage of tests in the build that are running in parallel.
Benchmarking Efficiency
The Efficiency metric is expressed as a percentage because it is based on how long the build took to run as compared to the duration of the longest test within it. For example, let's say that Build A contains four tests with these run times:
| Test | Run Time |
|---|---|
| T1 | 30 secs |
| T2 | 60 secs |
| T3 | 45 secs |
| T4 | 30 secs |
In this build, T2 serves as the benchmark test because it takes the longest to run at 60 seconds. If the entire build takes 60 seconds to run, then it has achieved full efficiency, because all the tests are running in parallel, and the Efficiency metric would be 100%.
Consider another example, Build B:
| Test | Run Time |
|---|---|
| T1 | 15 secs |
| T2 | 20 secs |
| T3 | 10 secs |
| T4 | 45 secs |
| T5 | 30 secs |
| T7 | 10 secs |
| T8 | 20 secs |
| T9 | 15 secs |
In this example, T4 serves as the benchmark for the build efficiency, because it takes the longest to run at 45 seconds. However, even if the test has complete parallelization (the entire build runs in 45 seconds), given that the majority of the tests are considerably shorter than 45 seconds, the overall efficiency of this build is still not optimal. Reducing the run time of T4 (and even T5) would improve the build efficiency.
Improving Efficiency
An Efficiency score of less than 100% means that the entire build took longer to run than the longest test within it, which is an indicator that all the tests in the build are running in parallel. If, on the other hand, the build in our first example ran in 115 seconds compared to the longest test of 60 seconds, its efficiency would be around 52% because the tests are clearly not running in parallel.
The following table provides some guidance for how you might improve your build efficiency based on your score.
| Efficiency | Degree of Parallelization | Guidance |
|---|---|---|
| 0% | Sequential | The build took as long to run as the sum of each run time of all the tests within it, which means that the tests ran in sequential order. Consider using a test framework to run your tests in parallel. |
| 1 - 90% | Semi-parallel | The build took less time to run than the sum of all test run times, which means that some tests ran in parallel and some ran in sequential order. Consider reorganizing your tests into small, atomic, and autonomous validations of very focused functionality to make sure they aren't dependent on one another to complete before they can execute. |
| 91 - 100% | Parallel | The build took approximately the same amount of time to run as the longest test within it, meaning that most, if not all, the tests ran simultaneously. You can still potentially improve the overall efficiency of your build by breaking your longer running tests into smaller, shorter tests, if possible. In the benchmarking example for Build A, if T2 could be broken down into two tests that ran for 30 seconds each, you would improve the efficiency of that build by 25%, since the longest running test within it would be 45 seconds instead of 60 seconds. |
See our Short Tests in Parallel blog for a more comprehensive discussion about improving the speed and efficiency of your builds.