DWARF
Debug information plays a crucial role in enabling symbolic debuggers and the Backtrace platform to reconcile the process executable state with the source-code form familiar to most software engineers. This information facilitates the mapping of memory addresses and register values to function names, source code locations, and variable descriptions.
In some environments, debug information may be omitted for reasons such as disk utilization and intellectual property protection.
This article serves as a pragmatic introduction to debug information, providing insights on how to manage and deploy it effectively.
Background
On systems like Linux, FreeBSD, IllumOS, and Mac OS, the underlying executable formats either reference external files containing debug information or directly embed the debug information. The debug information on these platforms is expressed through the following sections:
.debug_aranges: A mapping from memory addresses to function compilation units in.debug_info..debug_info: The primary debug information section containing function names, types, variables, inline information, and more..debug_abbrev: Describes the structure of debug information in.debug_info..debug_line: Source-code location information described as a state machine mapping memory addresses to files and line numbers..debug_line_str: A section introduced in DWARF 5 that contains strings used by.debug_line..debug_str: Strings used by sections such as.debug_infoand.debug_line..debug_loc: Location lists used to describe the location of values across memory address ranges..debug_loclists: A more efficient representation of.debug_locintroduced in DWARF 5..debug_ranges: A mapping from memory addresses to debug information..debug_rnglists: A more efficient representation of.debug_rangesintroduced in DWARF 5..debug_types: Type specifications with pre-computed type signatures, allowing for efficient merging of common types and omission of unused type information. Introduced in DWARF 4, merged back into.debug_infowith DWARF 5..debug_pubtypes: Maps type names to compilation unit debug information..debug_pubnames: Maps function names to compilation unit debug information, and more.
To learn more about how these sections are used, refer to the additional reading section.
Performance Impact of Symbols
Debug Information Does Not Impact Performance
Some users may have concerns that directly embedding debug information can result in performance degradation. However, this is not true. Debug information does not impact executable code or the size of statically initialized memory. The size of your debug information generally does not impact the performance of your application. Your operating system only loads sections of the executable that are required for execution.
For example, the following is a list of sections loaded from our object store server executable during execution. The total size of the executable is 19MB.
$ pmap `pgrep coronerd|head -1`|egrep 'coronerd$'
0000000000400000   3244K r-x-- coronerd
000000000072c000     36K r---- coronerd
0000000000735000    252K rw--- coronerd
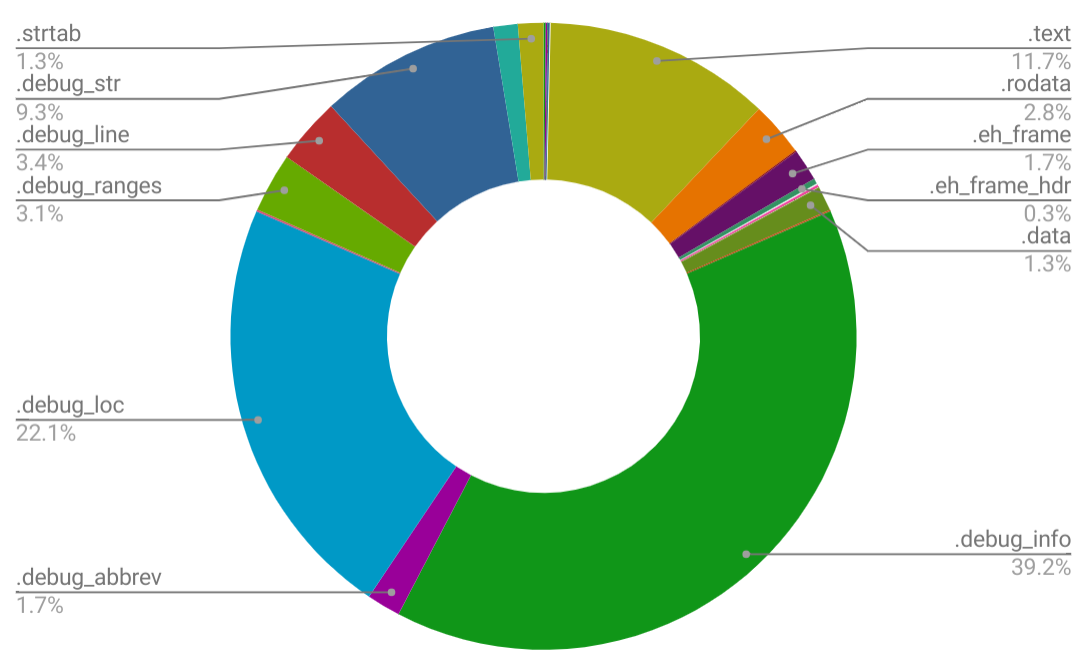
The graph below presents the size of different sections in the file. Over 80% of the 19MB executable consists of debug information. However, only approximately 3.6MB of the file is loaded, which corresponds to executable code, read-only data, and statically allocated data (including mappings that don't correspond to data on disk).
Stripping the executable removes the debug information sections, symbol strings, and more. This results in an executable size of 3.5MB. A process launched from this executable has the same virtual memory mappings as the one loaded from the unstripped executable.
$ pmap `pgrep coronerd|head -1`|egrep 'coronerd$'
0000000000400000   3244K r-x-- coronerd
000000000072c000     36K r---- coronerd
0000000000735000    252K rw--- coronerd
Some applications may explicitly wire pages of memory using facilities such as mlockall. This also has no impact, as sections related to debug information are not loaded into memory.
Reducing the Size of Your Debug Information
Compression
Many debuggers, including our own, support compressed debug sections. These sections are identified by a .z prefix to the debug section names. For example, .zdebug_info instead of .debug_info.
If you are using gcc, you can enable this functionality by passing the -gz flag. You can refer to Debugging Options to learn more. For other compilers, your objcopy facility may also expose a --compress-debug-sections option. Check out the objcopy documentation to learn more.
Below is an example of compressing the debug sections of the aforementioned coronerd executable:
$ objcopy coronerd --compress-debug-sections=zlib
This reduces the size of the executable from 19MB to 8.9MB. Your compression ratio may vary. This compression has a performance impact on many debuggers but is usually a fraction of the cost compared to actually parsing the debug information.
Debug Fission
DWARF 5 and recent compilers support several extensions referred to as split dwarf or debug fission. For more details, check https://gcc.gnu.org.
Tools
The dwz tool can be used to further reduce the size of your debug information. It relies on uncompressed debug information and works by replacing DWARF information with an equivalent smaller representation where possible. Below, we invoke dwz on the aforementioned coronerd executable:
$ dwz coronerd
This reduces the size of the coronerd file from 19MB to 16MB. This can be combined with compressed debug sections:
$ objcopy coronerd --compress-debug-sections=zlib
This results in an executable size of 7.6MB, down from 8.9MB.
It is also possible to utilize dwz on multiple files to achieve significantly higher compression ratios with stand-alone debug files.
Stand-Alone Debug Files
On Linux systems or systems with GNU strip, pass the --only-keep-debug flag to strip and use objcopy to add a debug link to the stand-alone file. This allows you to distribute your debug information independently of your executable. This has no impact on performance. Check the Linux page for more information.
Removing Debug Information
Depending on your requirements, you may not need all of the debug information. For example, if you only require accurate unwinding, you can retain only .debug_frame and .debug_line. The following objcopy invocation removes debug information unrelated to unwinding and source-code locations from the coronerd executable:
$ objcopy -R .debug_info -R .debug_abbrev -R .debug_aranges -R .debug_ranges -R .debug_loc -R .debug_str coronerd
This results in a 4.6MB executable, down from 19MB. The debugger can still unwind correctly, but some inline functions and function names may be missing (specifically, if no symbol is omitted for the function). However, the source code locations themselves are accurate.
You can utilize the other techniques mentioned in this article to further compress your debug information.