Introduction
Backtrace is a turn-key debugging platform that captures the application state at the time of an error, whether it's a run-time error or a fatal crash. Since the inception of our company, we have focused on improving the foundational technology behind modern symbolic debuggers. Our new debugger, called ptrace, is designed for automated analysis.
This document provides a brief overview of the features of the Backtrace debugger. It is recommended for integrating x86-64 applications and kernels running on Linux, FreeBSD, and IllumOS. For other platforms, Backtrace provides native support for minidump and seamless integration with popular crash reporting libraries like Google Breakpad and Google Crashpad.
Motivation
The Backtrace debugger aims to enhance root cause investigation of application errors in natively compiled software. Its design and development were motivated by several key problem areas with existing crash analysis and aggregation technologies, including data access and size, performance, and mean time to resolution.
Data Access and Size
Many modern systems rely on raw memory dumps to capture the application state, which is a crucial part of the post-mortem workflow. Core dumps contain vital information such as application memory, enabling a symbolic debugger to reconstruct variable values, call stacks, and more.
However, core dumps are often large, making it impractical to ship them to other systems or even generate them in the first place. Backtrace customers deal with workloads ranging from 24GB of RSS to 500GB+.
Additionally, working with core dumps requires access to the appropriate debug symbols for a traditional symbolic debugger to reconstruct the application state in a human-readable form. Setting up and managing this infrastructure for downloading symbols can be time-consuming for developers. Without this infrastructure, developers would need direct access to the machine with the core dump, which is both inefficient and poses a security risk.
Backtrace addresses these challenges with a self-contained structured snapshot format that doesn't rely on debug symbols after the snapshot is generated. The size of the snapshot format is significantly smaller than a typical core dump. Moreover, it is possible to generate a snapshot of live processes before resorting to core dump generation. The Backtrace debugger performs automated analysis of the application's state and selectively includes the relevant variables related to the fault.
Performance
Two components affect the performance of application recovery in a post-mortem state: memory dump generation and symbolic analysis for extracting a call stack and application state.
Let's compare the performance of the Backtrace debugger to that of GDB and LLDB on a complex C++ project, such as Google Chrome. For this experiment, we use Chromium 35.0.1916.144 with 466 mapped segments and 1 thread. The single executable contains approximately 2.6GB of debug data. We are requesting a backtrace of a running process.
Here are the performance results:
- GDB: Takes 2.6GB of resident memory and 54 seconds.
- LLDB: Takes 3.0GB of resident memory and 130 seconds.
- Backtrace: Takes 0.46GB of resident memory and 00.61 seconds.
This demonstrates complexity as the size of debugging information scales. Performance is also affected as the number of memory segments and threads scale. Below is a comparison of Backtrace with and without variables (bt and bt-nv, respectively) compared to GDB, LLDB, and Glider.
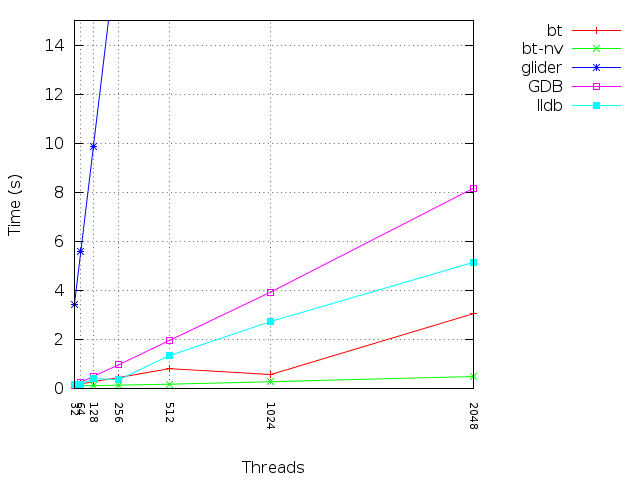
The memory dump generation process can be avoided altogether by having Backtrace snapshot live processes, only generating a full dump on disk if necessary. Regarding debugger performance, the Backtrace debugger is orders of magnitude faster than industry-standard debuggers such as GDB and LLDB. This performance allows quicker recovery times and enables the debugger to perform additional analysis.
Mean Time to Resolution
Traditional symbolic debuggers rely on engineers asking the right questions to identify the root cause. However, in the post-mortem state, many crucial details can be missed, leading to delays in resolving issues. Complex application states or lack of domain expertise in specific areas can contribute to these missed details.
The Backtrace debugger automatically analyzes variables, memory, executable code, and more to highlight important information that reduces the time to resolution.
Triage and Prioritization
Backtrace automatically analyzes application memory, executable state, and other factors to identify important clues related to variables, registers, and process states. This information assists in classifying issues, such as security problems, and helps understand the impact beyond simple deduplicated error counts. For example, a unique crash that occurs only once in a month may still be a critical security issue. By attaching classifiers to faults, Backtrace enables prioritization beyond simple deduplicated counts, taking into account the potential risk factor of a bug.