Hydra Usage
Hydra is a tool that takes a snapshot generated by running our ptrace tracer on an application and organizes the data in an easy-to-understand terminal interface.
Its main purpose is to help engineers focus on the most relevant information related to the root cause of a failure. The tool automatically selects the faulting frame, annotates suspect variables, and classifies the crash into a specific fault type (for example, null dereference, memory write). Hydra provides various commands and integrations to facilitate navigation through the application state, enabling faster access to more information and reducing tedious tasks.
Let's dive deeper into how Hydra can help you eliminate the complex bugs that impact your production applications.
Overview
Running Hydra
First things first: how do you run Hydra?
$ hydra
If you have configured coroner, you can also use:
$ coroner view
Running these commands instantly displays the exact root cause of the crash and, in some cases, even proposes a fix for you.
What you actually see is a colorful ncurses interface (unless you pass the -m flag to hydra, in which case it is displayed in black and white). The interface reminds you of some of your favorite tools, such as htop and tig. So, how is this interface organized?
Understanding the Panes
The interface is divided into several panes, each representing a different aspect of the application's state.
The panes, in order, are:
- Threads
- Frames
- Variables
- Router
We'll explain the Router pane in more detail later. For now, know that it contains various metadata about the application, including system information (memory/CPU usage), registers, kernel frames, and more. It also offers configurable integrations, such as source code management.
Among the panes, the only one that remains constant is the Threads pane (well, almost constant because you can still change how threads are displayed). The Frames, Variables, and Router panes dynamically update based on the selected context. We refer to these panes as context-aware. Frames are populated based on the selected thread, Variables and Registers depend on the current frame, and more.
Organizing Information with Rules
There are rules between each pane to prevent the panes from blending together and creating confusion. These rules not only add visual separation but also provide valuable information.
The rules, in order, are:
- Title: Shows a list of navigation hotkeys and the Hydra version.
- Application name and time of the trace.
- Basename of the object file and instruction/stack pointers for the current frame.
- Process map entry for the current variable and assembly instruction for the current frame.
- Router pane title bar, including the tab list and the name of the current pane.
- Context: Provides a brief indication/description of the current context. It often includes a position indicator on the right side, such as "Variable 30 out of 340 million; go faster." On the left side, it might display the current thread's TID or the type of the current variable. The content of this pane changes when you run a command, which we'll cover later. A status message may be temporarily displayed here if your command fails. For example, if you run
/samy_bank_password, you'll see "That's private!"
Navigating and Changing Context
With so many contextual panes, how do you actually change the context? How do you switch focus from threads to frames or from frames to the router pane? Navigation in Hydra follows a vim-like approach (apologies to Emacs users; I have small hands and want to avoid repetitive strain injury).
- Movement in a pane: Use the expected hjkl keys. Special keys like H (go to the top of the current view of a list) and L (same as H, but bottom) are also supported. Page Up and Page Down keys work as usual.
- Switching panes: Press the Tab key to switch focus to the next pane. If you reach the last pane, it wraps around to the first one. You can also use pre-set marks to switch directly to a specific pane. For example, press 1 for Threads, 2 for Frames, 3 for Variables, and 4 for Router.
Initial View and Fault Analysis
What does Hydra look like in action? Rather than explaining it in a thousand words, let's show you:
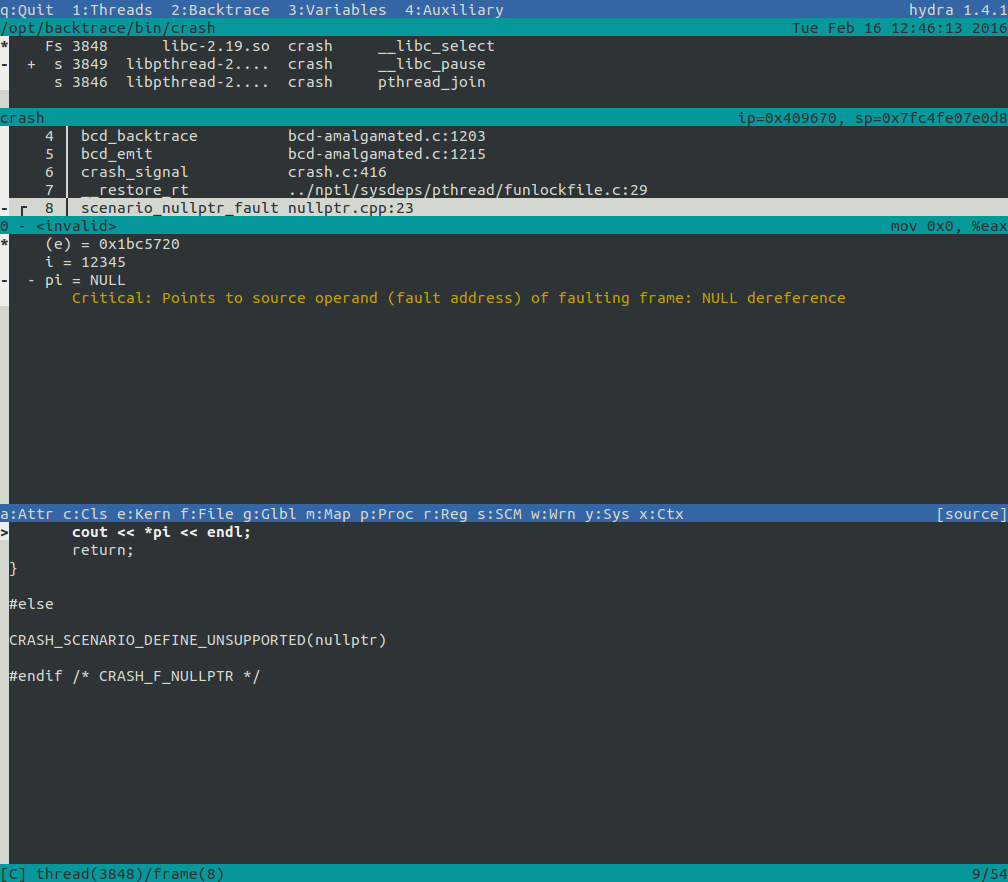
In the initial view, your attention is immediately drawn to the faulting frame, with the signal information displayed directly beneath it. No more parsing a gdb stack trace to find the frame you need to investigate.
Below that, you can see all the variables of the faulting frame (remember the mention of contexts earlier? Well, this shows the variable context for the faulted frame because it's selected). Notice the colorful text below each variable? Those are inlined annotations. We'll explain them later, but they indicate that our tracer automatically detected an issue with that variable. In this case, it appears that you dereferenced a NULL pointer.
Wait a minute, you remember your application having five threads, but only three are shown. And what's that peculiar symbol next to one of the threads? Well, that, my friends, represents two features in one: thread grouping and item collapsing. We'll cover these features in more detail later, but to give you an idea, Hydra has determined that a group of three threads in your application are nearly identical. Therefore, you probably only need to focus on one of them (unless you specifically require information from the other threads). If necessary, you can expand the group and explore its contents.
And what's in the bottom pane? Is that... your code? Yes, it is! Another great feature of Hydra is its source code integration. The default tab in the Router pane displays your code. We'll explain how to configure this feature later, but for now, know that it shows the line where the crash occurred (along with the entire file, not just the function call and line, as gdb typically shows). It even fetches the correct version of your code based on the tag/version associated with the crash.
Popular Features
We've covered the basics, but there's so much more you can do with Hydra. Let's explore some of the coolest features, because what's the point of a fancy ncurses UI without cool features?
Source Code Integration
Let's take a deeper look into one of the first things you'll encounter (and definitely want to see) when analyzing a crash: source code.
Configuring Source Code Integration
You can configure Hydra to display relevant sections of the source code in the peripheral pane.
To set up source code integration, edit your ~/.hydra.cf file and add a [scm] section. Here's an example:
[scm]
crash_app.map=object

:^libmtev[\.-],/home/user/projects/libmtev
crash_app.map=object:^libck[\.-],/home/user/projects/ck
crash_app.map=function:^ck_,/home/user/projects/ck
crash_app.map=function:^yajl_,/home/user/projects/yajl
crash_app.map=object:^libyajl[\.-],/home/user/projects/yajl
crash_app.ignore=object:^lib
crash_app.map=/home/user/projects/crash_app
crash_app.trigger=/home/user/projects/crash_app,version,git -C %s checkout -q %0
The .map commands associate an object file or function name with a source code folder for the application. After the colon, you specify a regular expression to match the object or function name, followed by the corresponding source code path. The commands are processed from top to bottom, and the first match determines the path where Hydra searches for the source code.
A .map command without a regular expression match acts as a wildcard, matching anything in the same directory.
When using .ignore= followed by a regular expression, Hydra ignores matches for subsequent lines. In the example above, object files that start with "lib" and haven't matched any earlier .map=object lines are ignored, preventing Hydra from associating them with source code.
Triggers
You can also trigger a command to run with .trigger=. The most common use case is triggering a git checkout of the correct branch when using Hydra.
To use a trigger, specify the source code path as the first parameter and the command to run as the last parameter. Between them, you can include key-value pairs that act as positional variables in the trigger command. In the example above, the version key-value maps to the %0 parameter. Additional key-value pairs correspond to %1, %2, and so on. %s refers to the project path.
Troubleshooting Triggers
If a trigger you've set up doesn't seem to be firing, keep in mind the following:
- A trigger fires only when code from the specified folder is accessed by Hydra, which occurs when a frame using that code is highlighted.
- A trigger fires only if:
- The path in the trigger line was previously matched by a
.map=line. - At least one key-value attribute is specified in the
.trigger=line. - The listed attributes are present in the snapshot (that is,
ptracewas called with the--kv=flag and included the specified attributes).
- The path in the trigger line was previously matched by a
Item Collapsing
Context: Any pane displaying a list with a hierarchy indicated by +/- symbols
Commands:
- Collapse or expand an item: +/- symbols next to the item
- Collapse or expand all items: Commands specific to each pane
Any item with an indicated hierarchy (such as a +/- symbol) can be collapsed or expanded to hide or show its "children." In the Threads pane, children may refer to members of a specific thread group; in the Variables pane, members of a struct or array; in the Process pane, structured heap metadata (arenas, thread caches, etc.); and more.
There is one exception to the default collapsing behavior: inlined variable annotations. See the Inlined Annotations section for details.
Inlined Annotations
Any annotations on a variable are displayed directly below the variable. If a variable chain collapses, but one of the variables in the chain is annotated, the minimum number of variables necessary (including the annotated variable and its owners) is displayed along with the annotation itself.
Annotation Jumping
Variables across frames are annotatable, and in a single frame, there may be thousands of variables, making it challenging to see any annotations. Annotation jumping proves valuable in this case. Open the Warnings tab in the bottom pane (press w), scroll through the list to find the annotation you're interested in, and press Enter. The thread, frame, and variable views update to the position of the annotation's owner.
Pane Maximization
Context: Any pane
Commands:
- Maximize or restore panes:
M (Shift + m)
All panes support maximization. When a pane is maximized, it has an associated context (for example, a maximized Thread pane has a Frame pane context). The maximized pane occupies most of the screen space, while the contextual panes occupy the rest. All other panes are hidden. To restore all panes and sizes, press M again or use a macro movement hotkey to switch to one of the hidden panes (moving between shown panes does not restore the sizes).
Regular Expression Search
Context: Any pane displaying a list
Commands:
- Search:
/ - Go to the next search result:
n - Go to the previous search result:
N
All panes displaying a list support regular expression searches. Each column is searched independently. For example, in the Threads pane, the search applies to status, TID, basename, thread name, and top frame symbol.
Index Jumping
Context: Any pane
Commands:
- Jump to a specific index:
:
All panes support index jumping. Except for the Source Code Management (SCM) pane, the indices are 0-based. The SCM pane uses a 1-based index (similar to a vim file). If an index is outside the valid range, it jumps to the first or last elements, respectively.
Thread Grouping
Context: Any pane for commands, Thread pane for display
Commands:
- Group threads:
:group - Supported group types:
callstack - Ungroup threads:
:ungroup - Sort threads:
:sort [sort-type] - Supported sort types:
tid - Reverse sorting order:
:rsort
Threads are automatically grouped based on the selected group type and sorted according to the specified sort type.
With callstack grouping, threads with identical callstacks are grouped together. Using the tid sort type orders threads based on their thread IDs. No other supported group and sort types are available.
By default, threads are grouped by callstack and sorted by tid. You can ungroup all threads using :ungroup and reverse the current sorting order in each group with :rsort (for example, reverse sorting threads by tid).
Faulted threads are always grouped separately from non-faulted threads and appear first in the thread list (faulted threads are indicated with an 'F' next to them).
Configuration
By default, Hydra looks for a configuration file at ~/.hydra.cf.
Here's a sample configuration for the crash application:
[scm]
crash.map=/home/djoseph/projects/crash/src
crash.map=object:^libck[\.-],/home/djoseph/projects/ck
crash.map=function:^ck_,/home/djoseph/projects/ck
crash.trigger=/home/djoseph/projects/crash,version,git -C %s checkout -q %0

editor=vim +%l %s

[general]
alias_detection=true
collapse_threshold=3
A Deeper Dive
Remember all those explanations we postponed earlier? Well, if you're still looking for more clarity, here they are:
Navigation Hotkeys
j: Move down one itemk: Move up one itemh: Scroll left (if there is text off the screen)l: Scroll right (if there is text off the screen)H: Move to the top of the current view (vim behavior)L: Move to the bottom of the current viewPgUp: Move up one full page of itemsPgDn: Move down one full page of itemsHome: Move to the first itemEnd: Move to the last item:Jump to the specified positiontab: Move to the next pane1-4: Move to the pane associated with the number1: Threads2: Frames3: Variables4: Router
State Jumping/Linking
Context: Any non-router pane
Commands:
u: Show the position of the current selection in the current pane:j: Refocus to the provided position
Any state in the top three panes (Threads, Frames, and Variables) can be immediately refocused by "jumping" to its position, similar to annotation jumping. Press u to show the position URL of the current selection and use the global :j command to refocus on that state.
Global Commands
:s:!:j:/:sort:rsort:group:ungroup:q
Immediately Run Global Commands
Context: Hydra command-line parameter
Commands:
- -e "command"
All global commands, except regular expression search, can be executed immediately upon starting Hydra. This is beneficial for sharing the state with other users. Provide them with a snapshot and a position URL (using the u command) and have them open it using: hydra -e "j <position URL>".
Router Pane
System
Displays general application and system statistics at the time of the crash. Some examples include:
- Number of threads
- Process memory (RSS, RSS Peak)
- System memory (Total, Free)
- CPU usage (User, Kernel, I/O Wait)
Context
Shows any contextual data associated with a particular variable, such as heap allocation statistics.
Process
Provides process-wide metadata associated with the application/crash. This contains all trace-wide annotations, such as heap metadata/statistics.
KVs
Displays all key-value attributes associated with the application/crash. Some attributes are automatically generated, while others can be specified by the user via ptrace (refer to the ptrace documentation for more details). Examples of KVs include hostname, uname, process age, and process tag/version.
Registers
Lists all registers for the currently selected frame.
Pmap Entries
Shows the process map entries for the application (for example, from /proc/[]/maps on Linux). The selected entry changes based on the variable selection (it corresponds to the entry containing the variable).
Attached Files
Commands:
- Save a file to disk
:s: Save all attached files to a specified directory
It lists all files attached to the snapshot using ptrace (refer to the ptrace documentation for instructions). The metadata and full path of each file are displayed.
Classifiers
Displays the classification(s) of the crash, generated by ptrace. Examples of classifications include segmentation violation, null dereference, and memory write error.
Kernel Frames
Shows the stack of the most recent kernel frames for the current thread. Keep in mind that these frames were not necessarily executed after the thread's last user-space frame.
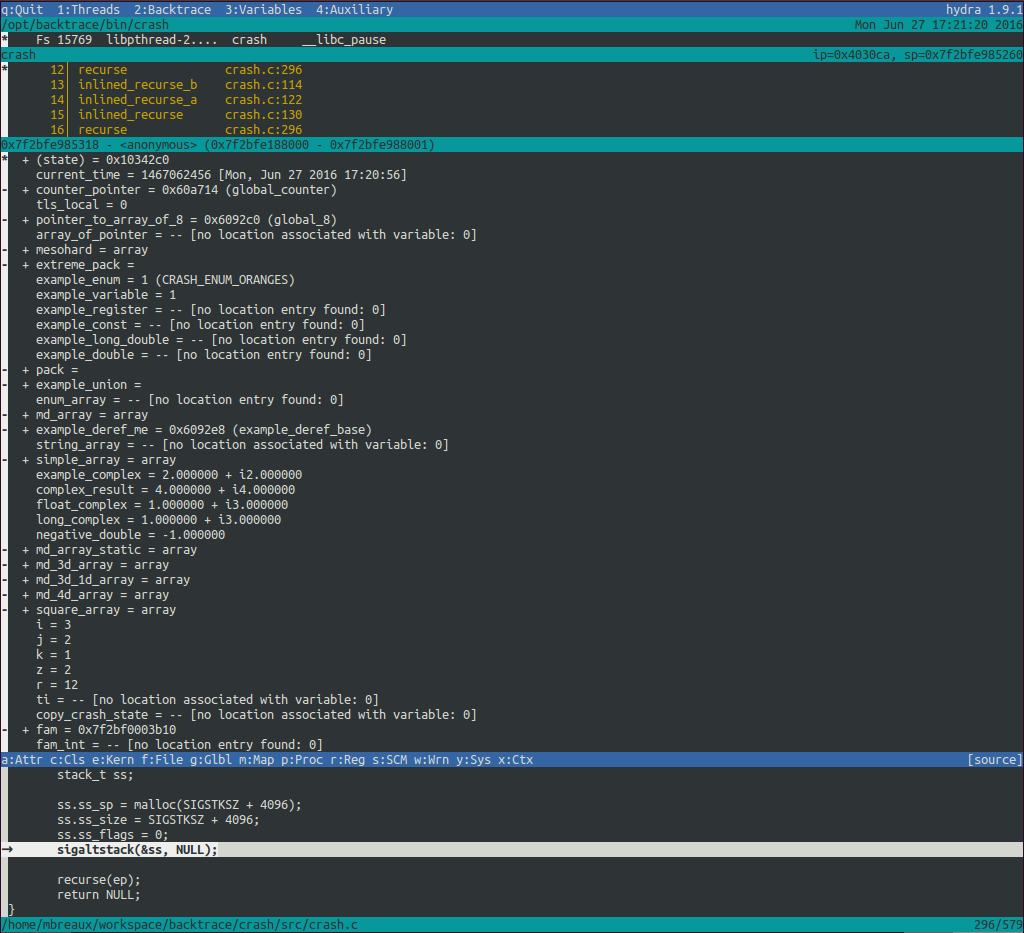
Global/TLS Variables
Displays the variables with global and thread-local storage that were requested at the time of the trace using ptrace (refer to the ptrace documentation for instructions). Variables are organized into a hierarchy of [Thread (for TLS variables)] - [Object] - [Compilation Unit (CU)].
Source Code Integration
Commands:
- Open a source file in the configured editor
- Center view on the last-executed line of the frame
Shows the source code for the presently selected frame. Index jumping is supported, but regular expression searches are not. The initial line selected is the last-executed line of the frame.
Annotations
Commands:
- Jump to the annotation owner (Hydra refocuses on the thread, frame, or variable owning the annotation; Backtrace annotations are not jumpable.)
Lists all annotations contained in the snapshot, excluding JSON-type annotations. You can jump to a selected annotation by pressing Enter.
JSON-type annotations are shown in either the Process or Context router tabs. Refer to those sections for more details.
Column Specification
The following is the column specification for each pane, from left to right (panes with a single column or containing key-value lists are omitted):
- Threads
- Thread state: F (faulted), s (sleeping), S (stopped), D (disk), T (traced), Z (zombie), X (dead), ? (unknown)
- TID
- Basename of the object file of the top frame
- Thread name
- Thread's PID (Only appears for kernel-space core files)
- Symbol of the top frame
- Frames
- Frame number
- Symbol (or address if symbol resolution fails)
- Source code location (directory/source file/line)
- Signal information is shown under the faulting frame but does not follow the frames pane's column specifications.