Feature Overview
The Backtrace debugger generates stand-alone structured snapshot files that contain significantly more information than a callstack without the bloat of a traditional core dump. All crashes are automatically aggregated and deduplicated, enabling your team to respond quickly to instability and triage more effectively. Learn more about deduplication.
Automated Analysis and Assistive Debugging
Backtrace continuously improves the automated analysis capabilities of the Backtrace Debugger based on real-world fault data.
Accuracy
The Backtrace debugger supports DWARF2, DWARF3, DWARF4, and DWARF5 debug information, including popular GNU extensions. It also supports multiple unwinding personalities, allowing for behaviors that match both GCC ABI and standard DWARF ABI. Backtrace marks suspect frames when heuristics are applied to frame unwinding, preventing developers from guessing the integrity of the fault data. Even when variables are optimized out, Backtrace indicates the optimization and provides relevant information for investigation.
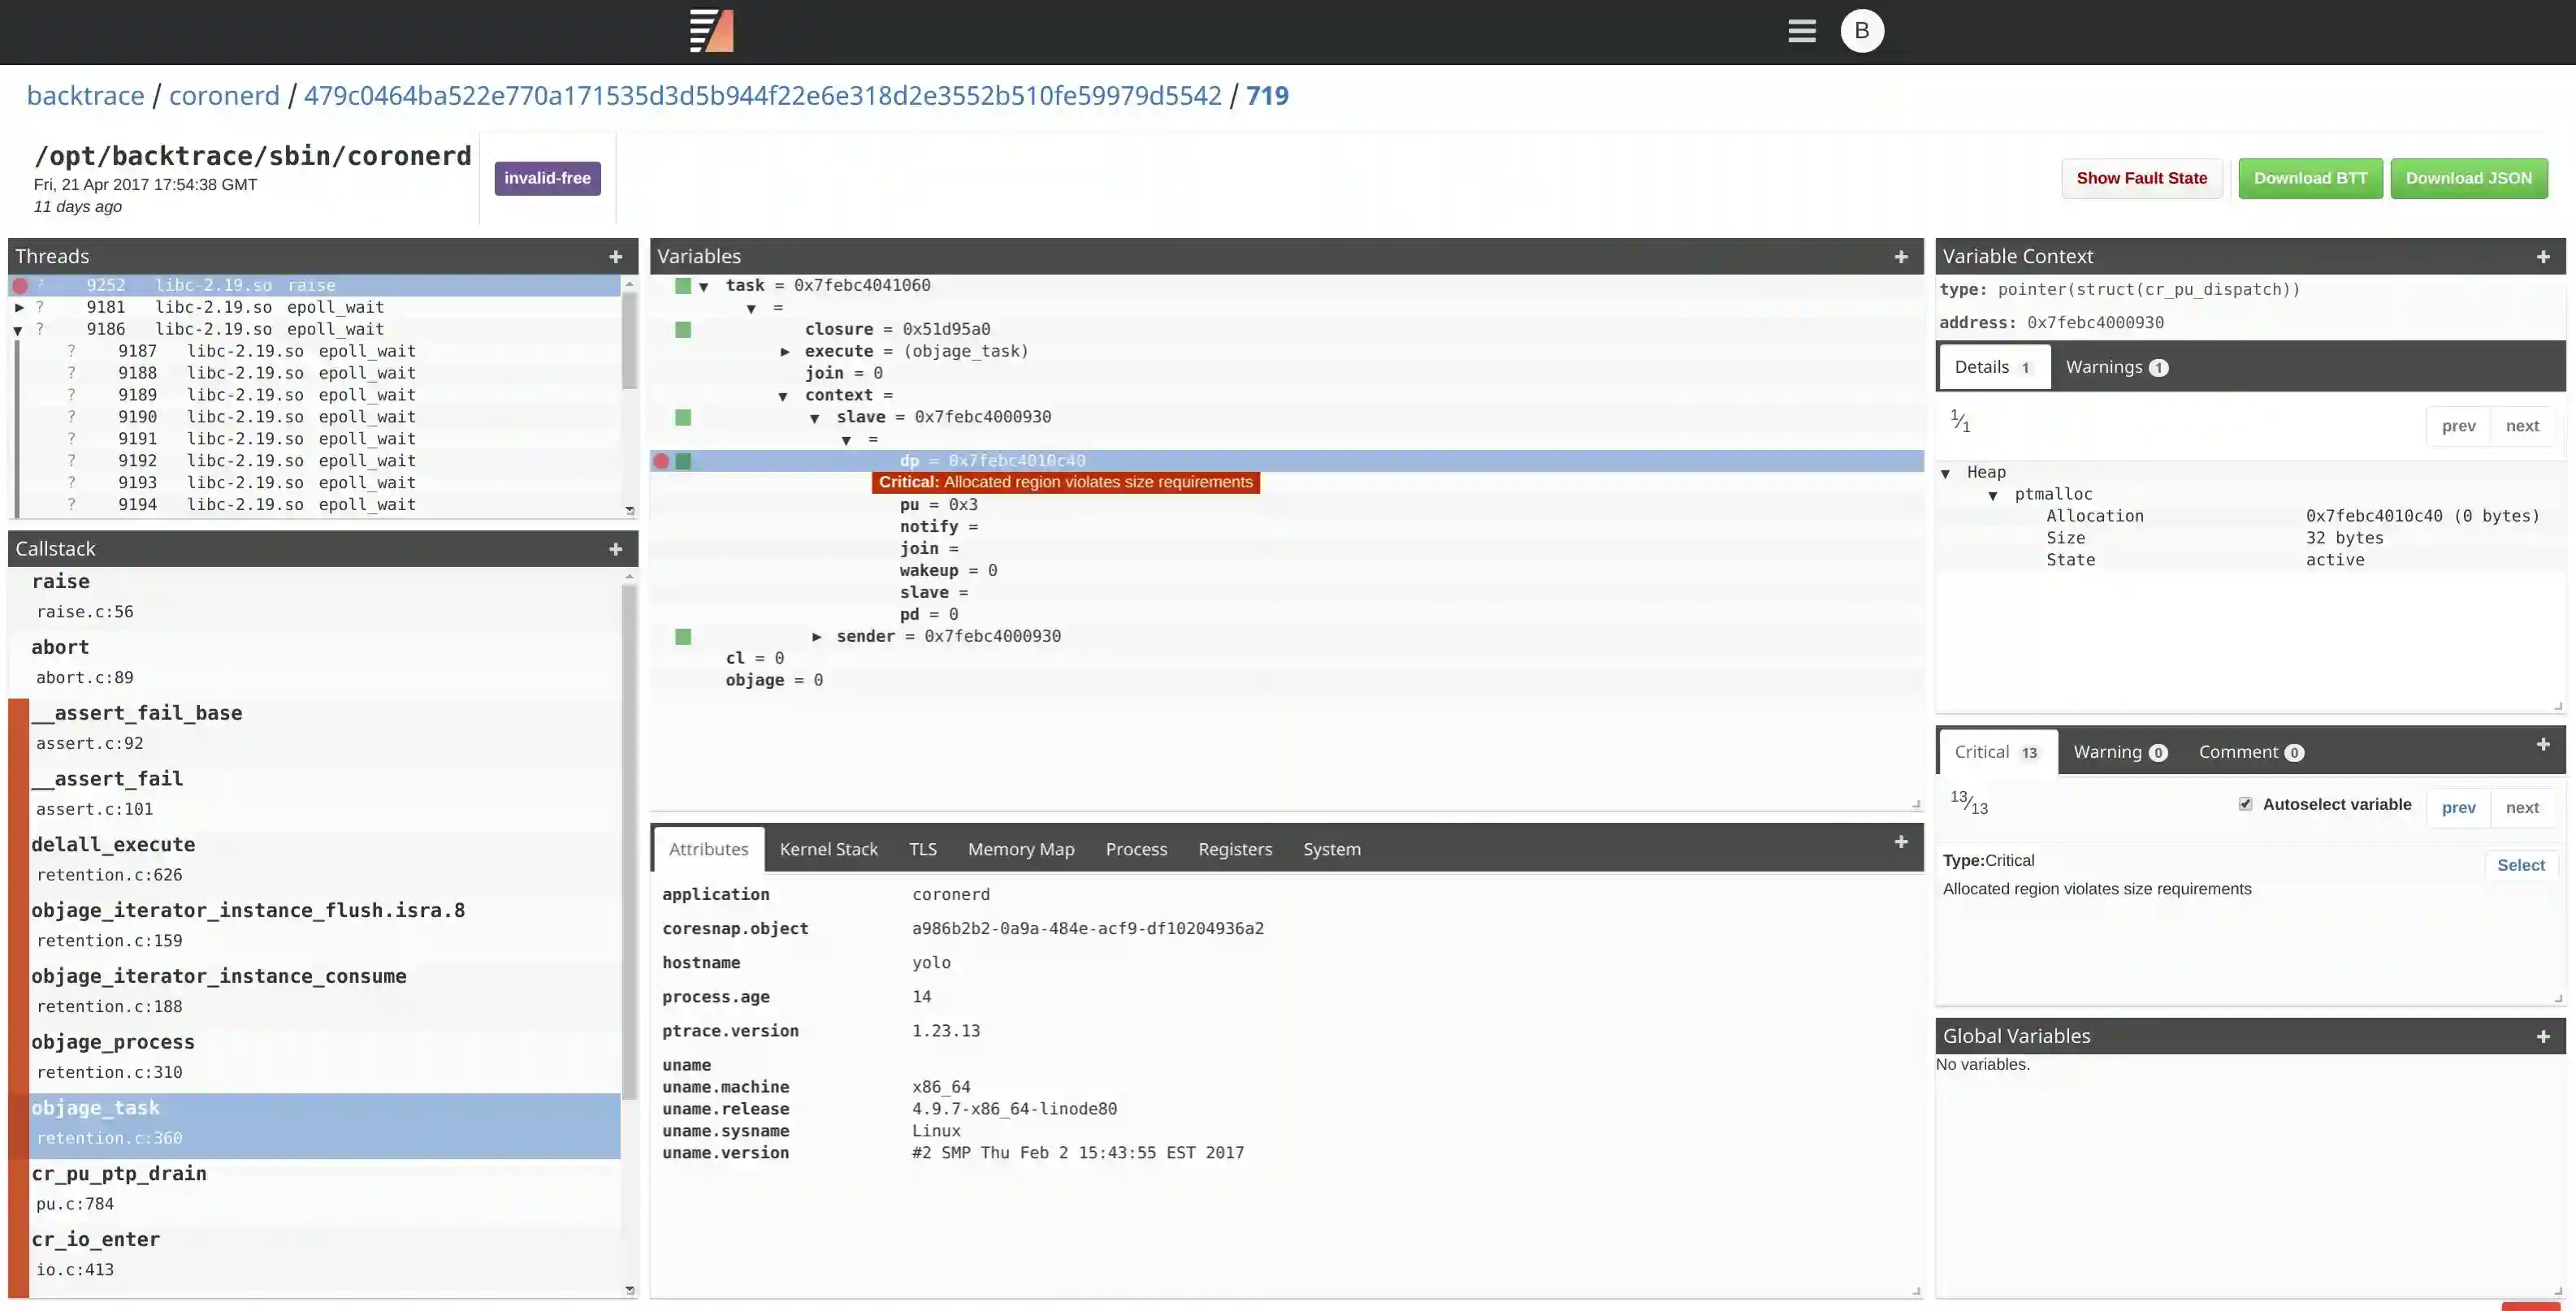
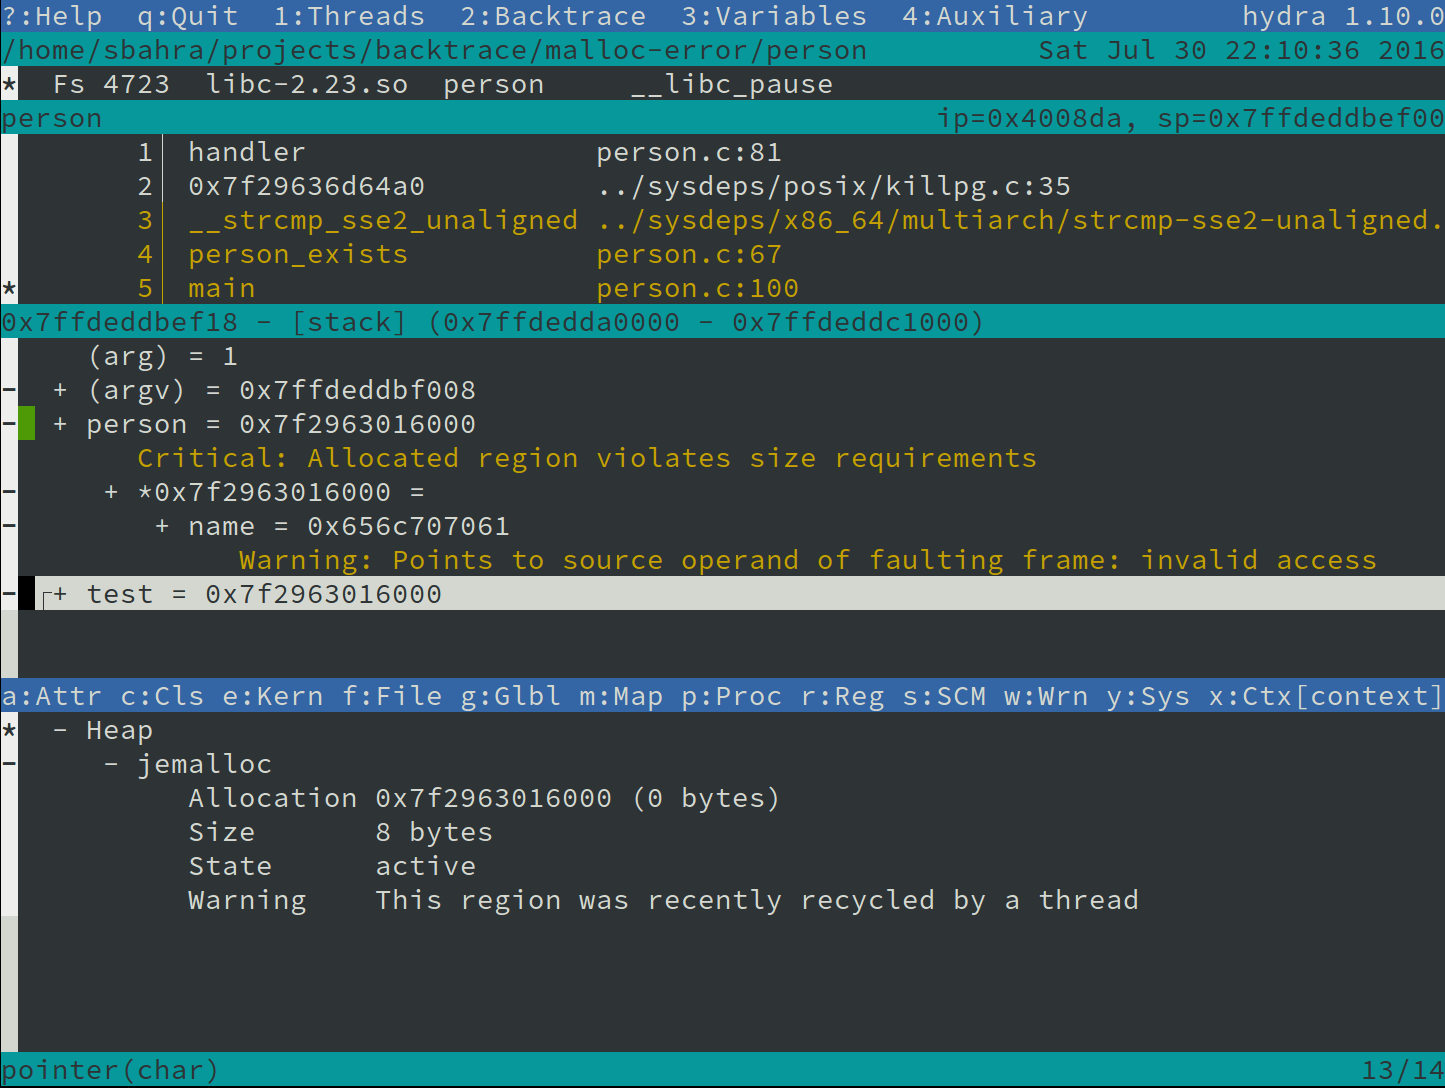
Automatically Highlight Variables Associated with an Invalid Access
One of the initial tasks developers often perform is manually tracing pointers and object hierarchies in their debugger to identify relevant variables. This process needs to be repeated for every dump analysis, and due to its manual nature, it is prone to errors. For instance, it's possible to miss aliases to the same variable or memory region across different threads. Backtrace saves valuable time by automatically tracing these aliases for you.
Here's an example: When a crash occurs (due to a use-after-free error) while accessing the name variable, Backtrace automatically tags the variable for quick reference. It performs this action across all threads, automatically tracing object references.
Backtrace accomplishes this by examining executable code, variable addresses, and values in an acceptable error margin, allowing for heuristic matches.
Fault Disambiguation
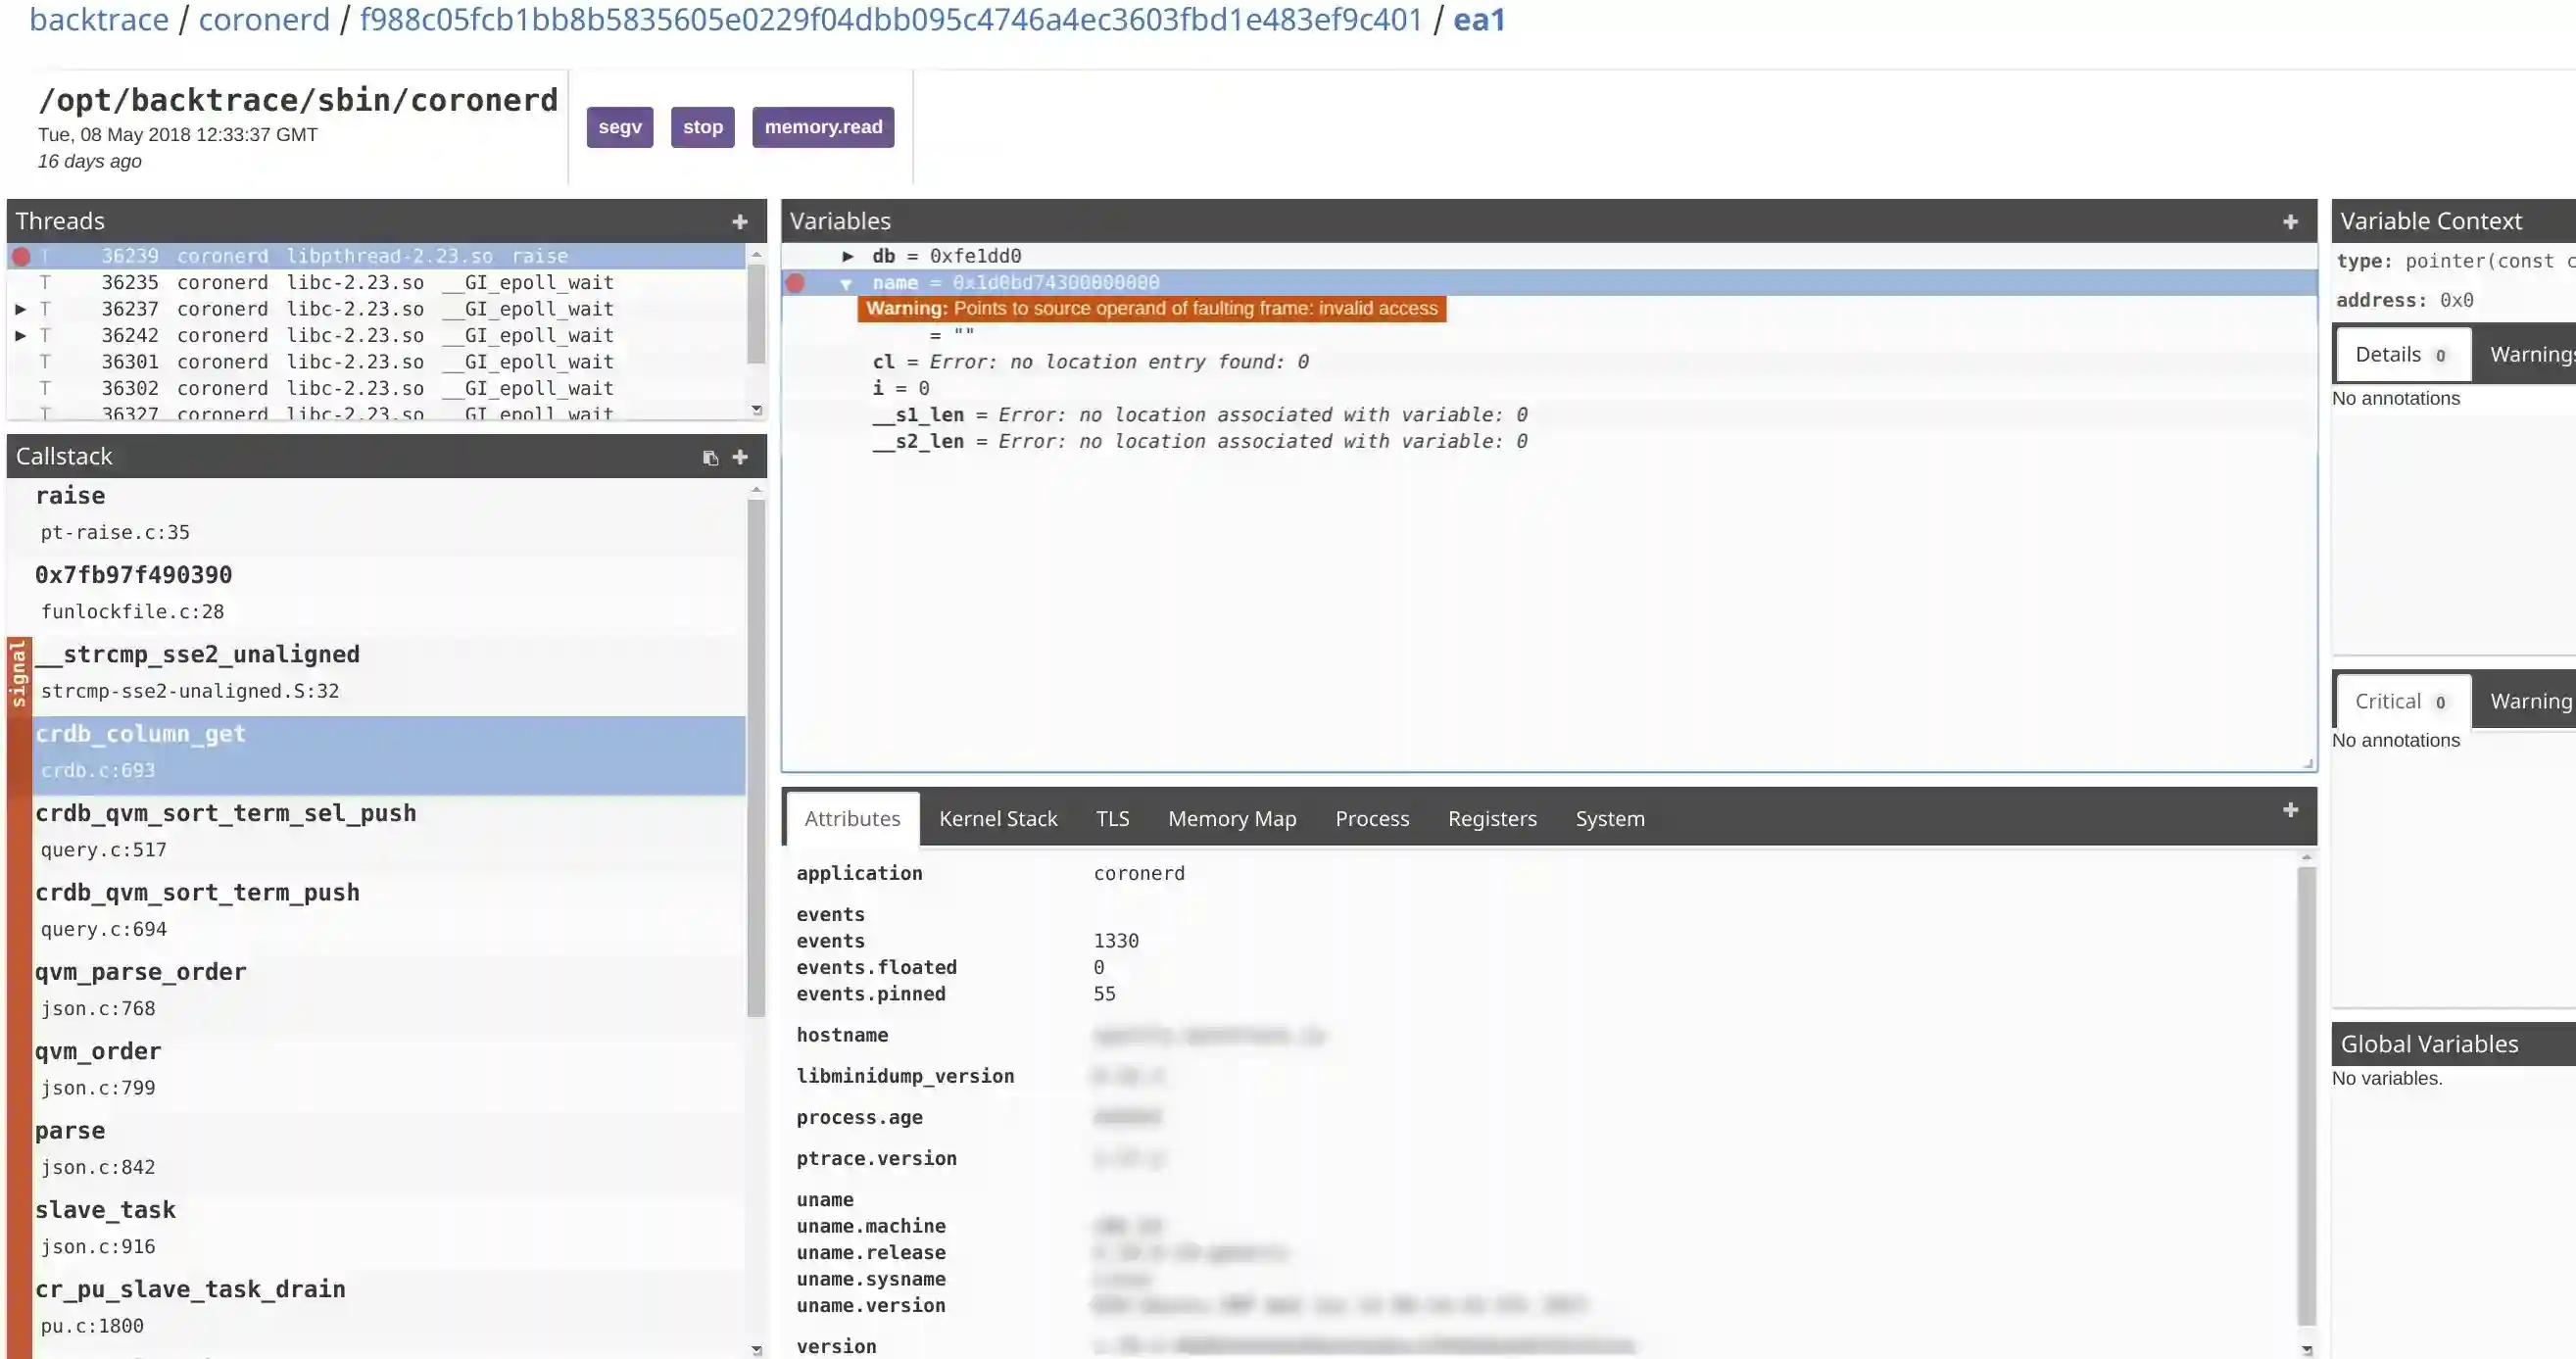
Backtrace accurately disambiguates the type of fault, helping to identify important bugs. Unlike traditional debuggers that struggle to distinguish between invalid memory reads and writes, stack overflows, or alignment errors, Backtrace analyzes memory, registers, and executable code to provide precise disambiguation.
Below is an example of what an alignment bug might look like with a traditional debugger. Unless the engineer understands the underlying instruction, this looks like the program is crashing while accessing perfectly valid memory locations.
[Switching to Thread 0x7ffff6d4d700 (LWP 6876)]0x0000000000403c29 in ck_pr_cas_64_2 (set=0x7ffff6d4c8b0, compare=0x7ffff6d4c8b0, target=0x7ffff6d4c8b8) at /opt/backtrace/include/gcc/x86_64/ck_pr.h:461
461 __asm__ __volatile__("movq 0(%4), %%rax;"
(gdb) bt
#0 0x0000000000403c29 in ck_pr_cas_64_2 (set=0x7ffff6d4c8b0, compare=0x7ffff6d4c8b0,target=0x7ffff6d4c8b8) at /opt/backtrace/include/gcc/x86_64/ck_pr.h:461
#1 scenario_align_fault (e=0x61f2c0) at align.c:15
#2 0x0000000000402d01 in recurse (state=state@entry=0x61f2c0) at crash.c:301
#3 0x0000000000402d22 in inlined_recurse_b (e=0x61f2c0) at crash.c:114
#4 inlined_recurse_a (e=0x61f2c0) at crash.c:122
#5 inlined_recurse (e=0x61f2c0) at crash.c:130
#6 recurse (state=state@entry=0x61f2c0) at crash.c:296
#7 0x0000000000402e58 in crash_thread_begin (ep=0x61f2c0) at crash.c:321
#8 0x00007ffff74276aa in start_thread (arg=0x7ffff6d4d700) at pthread_create.c:333#9 0x00007ffff715ceed in clone () at ../sysdeps/unix/sysv/linux/x86_64/clone.S:109
(gdb) p *target
$1 = 2
(gdb) p *compare
$2 = 1
Backtrace validates the constraints of the underlying instruction against registers, and memory automatically identifies this as an alignment bug at snapshot generation time. Below is the same dump being viewed using the terminal-based snapshot viewer of Backtrace.

Backtrace can disambiguate various types of faults, including failed assertions, alignment errors, stack overflows, security-related bugs, dispatch errors, machine check errors, and memory accesses.
Highlight Invalid Function Calls
Backtrace includes a ruleset that specifies constraints for how functions are called. Users can add their own rules as well. For example, a rule can be defined for memcpy(a, b, c) specifying the following invariants:
-
[a, a + c)must be writable. -
[b, b + c)must be readable. -
cmust be an integer that looks sane concerning the address space constraints of the host architecture. If a crash was to occur and a variable contained amemcpycall violating these constraints, it would be explicitly flagged. As another example, a rule is specified forrealloc(a, b)requiring that: -
a is NULL or allocator-managed memory.
-
b is an integer and must appear sane concerning the host architecture address space.
-
It must not execute in signal context (it is not signal-safe).
If a crash was to occur and a thread contains a call to realloc violating any of these constraints, it is flagged.
By default, Backtrace provides rules for standardized functions, and the ruleset is regularly updated.
Disambiguate and Detect Heap Corruption
Backtrace performs a comprehensive analysis of registers, variables, memory, and memory allocator metadata in a single application snapshot to detect various forms of heap corruption. This analysis is carried out without impacting the runtime performance of your application.
Backtrace seamlessly integrates with the following memory allocators:
- jemalloc
- ptmalloc
- tcmalloc
- FreeBSD Kernel UMA Allocator
It can effectively detect multiple forms of heap corruption, including but not limited to:
- Double free: This occurs when a dynamically allocated object is erroneously freed twice.
- Invalid free: This happens when an invalid address is requested for reclamation.
- Use after free: It indicates that an active alias still refers to a reclaimed object.
- Type violation: This refers to a situation where the size of the allocation pointed to by the type does not meet the size requirements of the underlying type.
Additionally, Backtrace is capable of detecting latent bugs in your software and can be applied to live processes. This capability not only aids in root cause investigation for faults but also helps uncover hidden bugs that could potentially lead to instability.
Environment and Architectural Constraints
Backtrace automatically highlights faults caused by environmental or architectural conditions, saving potentially hours of research on false leads. It allows for quick identification of cases where an assertion related to failed resource acquisition or memory lock is a result of exceeding environmental or architectural limits.
The debugger validates the resource utilization of your application at fault time and immediately highlights any violations, including limits defined by getrlimit(3).
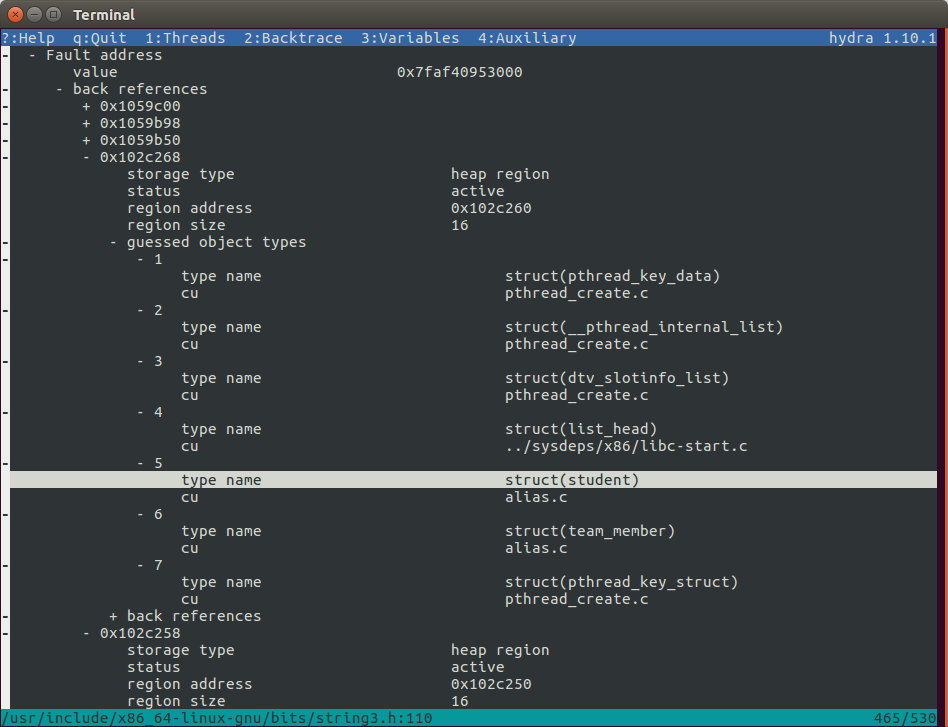
Stale Pointer Detection
A stale pointer is a subtle and common memory error, making it one of the most challenging issues to debug. It occurs when a memory region is freed or reallocated, but the old references, also known as aliases, to that memory are not correctly updated. Using these stale references after the memory change leads to unpredictable consequences. Stale pointers can manifest as intermittent failures or even cause crashes. Even when no immediate error is observed, a stale pointer is like a ticking time bomb that can become catastrophic with minor contextual changes or the addition of new code. In multi-threaded programs, race conditions often result in stale pointers, further complicating the debugging process.
When the --stale-pointer option is passed to the Backtrace debugger, it performs a process-wide mark-sweep on the faulty memory location up to a configurable number of levels deep. This analysis helps detect back-references to the faulting memory address. Once these aliases are identified, Backtrace applies heuristics using type information and allocator metadata to determine the potential types that are mutually aliasing each other. For example, it can identify that struct A is a stale reference to a memory region pointed to by a reference of type struct B. This capability helps isolate the family of data structures and subsystems with invalid memory management.
The screenshot below illustrates an example where a stale pointer is narrowed down to seven potential types:
Security and Malware Analysis
The Backtrace debugger includes features for detecting security vulnerabilities, exploitable crash conditions, and more. It can help identify malware in executables and post-mortem crashes that present security problems. By default, Backtrace automatically highlights faults involving execution attempts of non-executable pages, faults involving instructions controlling execution flow, stack overflows, and fortification assertion failures indicate heap and stack smashing possibilities.
Advanced security and malware analysis features can be enabled using --security with ptrace. These features include detection of inconsistencies in memory regions, infected functions, modifications to executable code, presence of ROP chains and shellcode, and invalid constructor and destructor functions.
If --security is passed to ptrace, it is possible to enable advanced security and malware analysis features. These features are configurable and include:
- Detection of dynamically shared objects and other file-backed memory regions containing executable code inconsistent with linker data associated with the executable.
- Detection of loaded memory segments that are both writeable and executable.
- Detection of inconsistencies in the PLT/GOT, constructs, and destructors with linker and executable information to detect infected functions.
- Detection of modifications to executable code and the text segment, identifying potential malware.
- Analysis of executable code and instruction pointer to detect the presence of ROP chains and shellcode indicates potential exploitation attempts. This requires a snapshot to be generated from a live process.
- Invalid constructor and destructor functions.
Performance
Two components significantly impact the performance of application recovery in a post-mortem state: memory dump generation and symbolic analysis for extracting the callstack and application state.
To illustrate the performance comparison of the Backtrace debugger with GDB and LLDB, let's consider a complex C++ project like Google Chrome. In this experiment, we use Chromium version 35.0.1916.144, which consists of 466 mapped segments and runs on a single thread. The executable contains approximately 2.6GB of debug data. We are requesting a backtrace of a running process.
Here are the performance metrics for each debugger:
- GDB: It consumes 2.6GB of resident memory and takes 54 seconds.
- LLDB: It consumes 3.0GB of resident memory and takes 130 seconds.
- Backtrace: It consumes 0.46GB of resident memory and takes 0.61 seconds.
These results demonstrate the impact of debugging information size and the scaling effect of the number of memory segments and threads on performance. The provided image below illustrates a comparison of Backtrace (with and without variables, represented as "bt" and "bt-nv" respectively) against GDB, LLDB, and Glider.
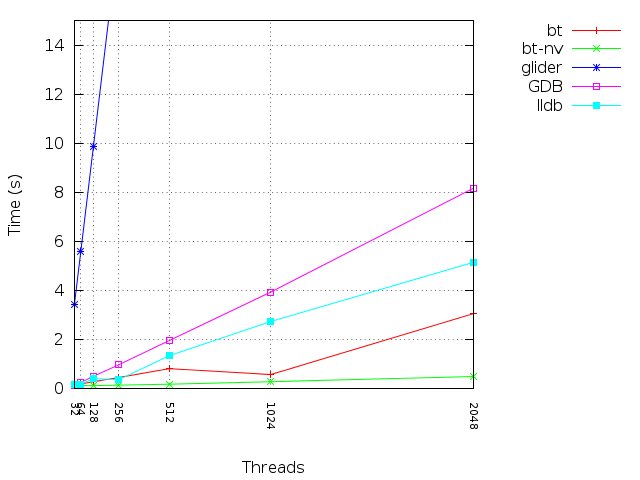
It's worth noting that the memory dump generation process can be entirely avoided by using Backtrace to snapshot live processes. A full dump on disk is generated only if necessary. In terms of debugger performance, the Backtrace debugger outperforms industry-standard debuggers like GDB and LLDB by orders of magnitude. This superior performance enables faster recovery times and allows the debugger to conduct additional analysis efficiently.
Detailed Snapshots
Custom Attributes
You can attach an unlimited number of custom attributes to your dump files, including attributes like version, data center, hardware model, and more. This flexibility allows for a quick assessment of the impact of instability when using the query builder, enabling you to aggregate and analyze data based on these custom attributes. For example, you can determine which version of a crash was introduced, analyze specific data centers, or identify the number of events dropped in a specific timeframe.
Environment Information
Aggregate statistics on scheduler, process, memory, and other factors to identify external influences on software stability. Backtrace provides around 50 attributes by default, including memory utilization and scheduler utilization.
File Attachments
You can attach files and directory trees to snapshot files with ease, which can then be extracted and downloaded through the web browser or terminal. This facilitates triage and investigation of instability.
Variable Information
Backtrace includes global, static, and thread-local variables in snapshots, along with all variables reachable on the stack. Objects are dereferenced and serialized into the snapshot, improving the mean time to resolution.
View Dumps in your Terminal
The Backtrace hydra tool allows you to view Backtrace snapshots in your terminal. It offers advanced source-code integration, regular expression search, and more.
Learn more about hydra.
View Dumps in your Web Browser
The Backtrace web debugger and web console enable you to view dumps directly in your web browser without additional tools. Dumps are automatically aggregated into a centralized object store, providing convenient access for engineers.
Learn more about web debugger.