Analyzing Test Case Errors
Errors
Using the Errors breakdown and trends from the Errors page will allow you to use the same familiar filters like OS, test owner, or Framework to analyze your testing errors and understand what actions to take based upon the resulting set of errors. Errors shows visualization of errors over time based upon your selected filters, and then surfaces the most pervasive errors in that data set for you to debug and take action on.
Filtering Your Error Data
To get the most out of the Errors page, start by narrowing down your data using the filter bar at the top of the dashboard. By default, the page displays data for the last 7 days across all your tests, but you can isolate specific problems by filtering by:
- Platform: Toggle between Virtual Cloud and Real Devices to see if an issue is hardware-specific.
- Test Metadata: Use filters like OS, Framework (e.g., Appium, Selenium), Device, or custom Tags to drill down into specific test suites.
- Build & Owner: Filter by Build to see if a recent code deployment introduced new failures, or filter by Owner to view errors specific to your team's test executions.
Understanding the Error Rate Graph
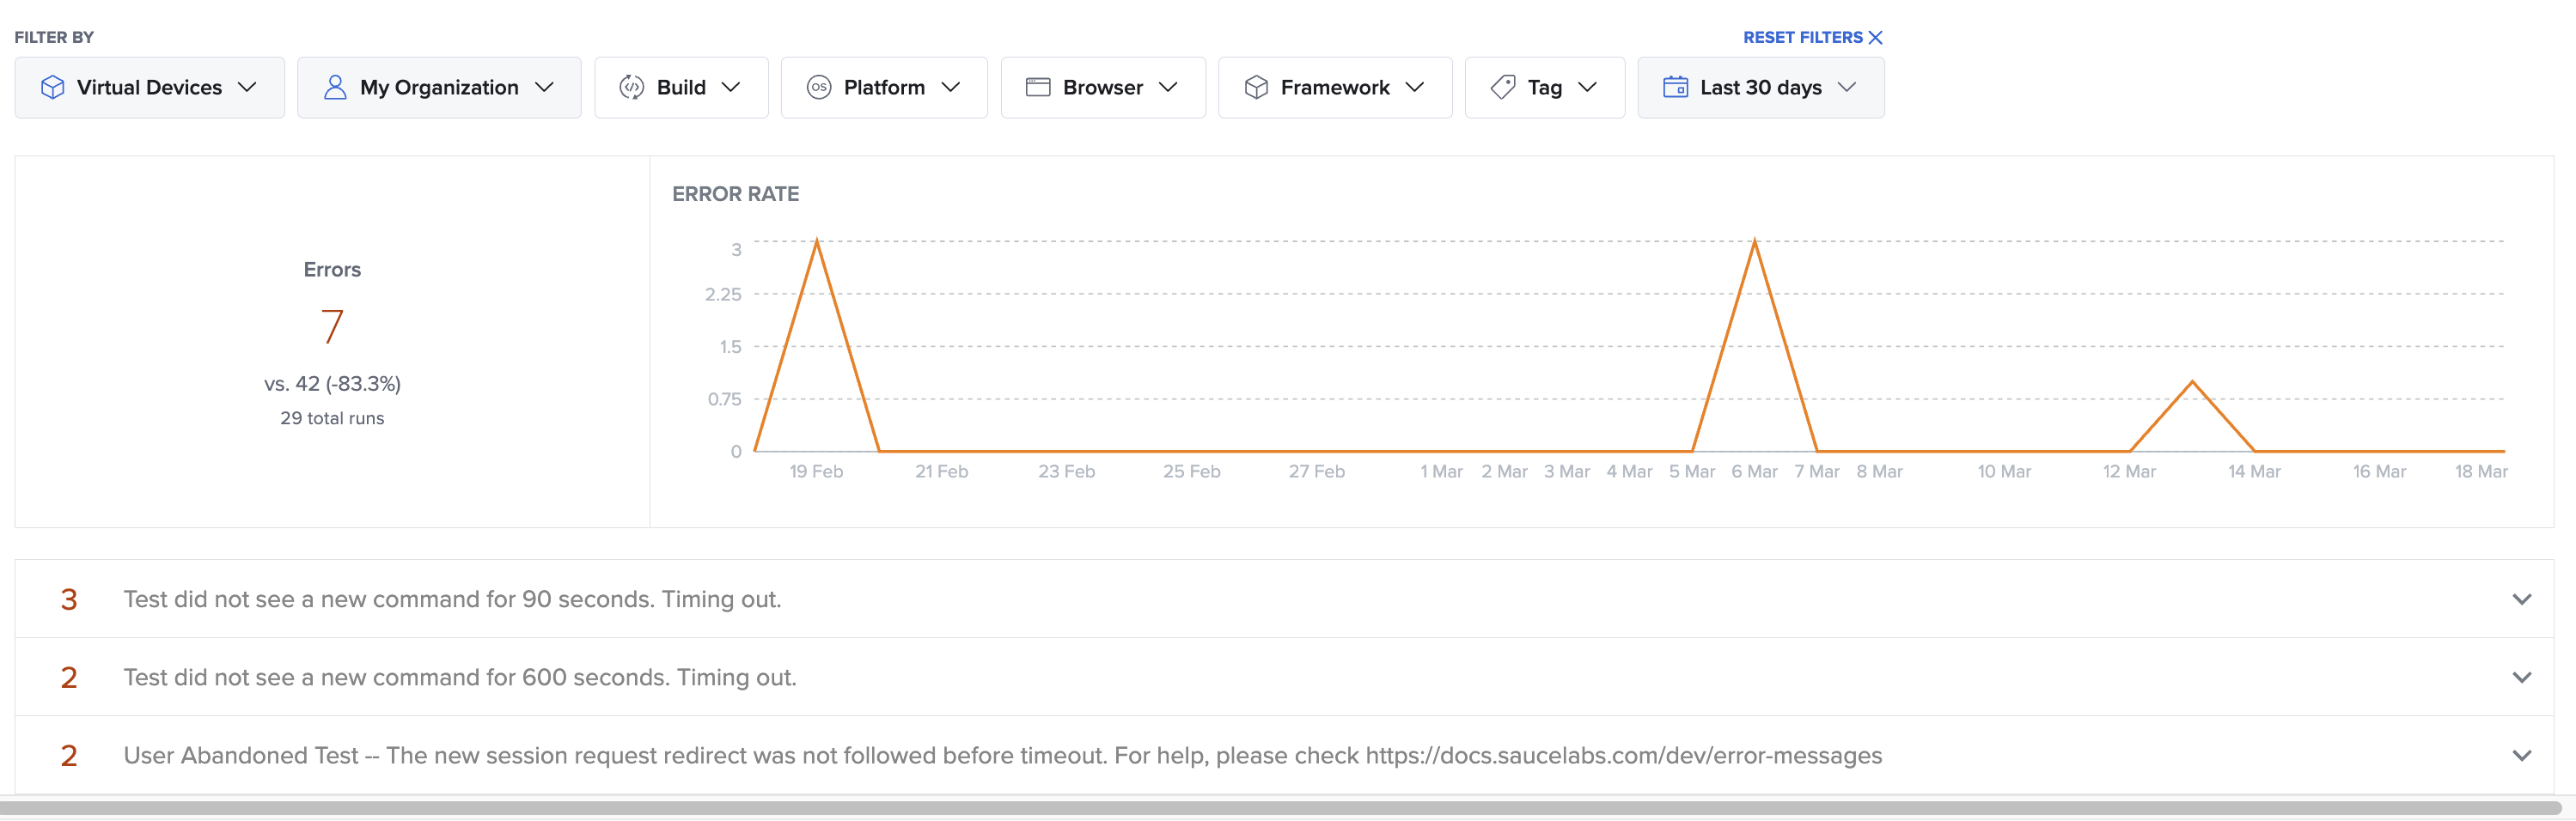
The Error Rate line chart provides a visual representation of your test health over time.
- Identify Spikes: Sudden spikes in the graph often indicate a systemic issue, such as a localized outage, a broken build deployment, or a poorly configured test suite.
- Track Improvements: The summary on the left displays your total error count compared to the previous time period (e.g., vs. 94 (-7.4%)). Use this metric to track whether your team's debugging efforts are successfully reducing overall test flakiness and failure rates.
Debugging Pervasive Errors
Beneath the trend graph, Sauce Labs automatically groups and ranks the specific error messages returned. Instead of digging through thousands of individual test logs, you can use this list to identify the highest-impact issues:
- Prioritize by Volume: The number on the left indicates exactly how many times that specific error occurred within your selected timeframe. Start with the most frequent errors to fix the largest number of failing tests at once.
- Investigate the Root Cause: Expand any error in the list to read the full stack trace or error message.
- Take Action: Click into the specific test sessions associated with an error to view video recordings, Appium/Selenium logs, and device vitals to pinpoint exactly what went wrong.
Best Practices for Error Analysis
- Monitor new releases: After a major code merge or release, check the Errors page and filter by your most recent Build to ensure no new pervasive errors were introduced.
- Clean up your test suite: Regularly check for "User Abandoned Test" or configuration timeout errors. These often point to inefficient test design or incorrect timeout capabilities in your script rather than a bug in your application.