Getting to know Sauce Home
Sauce Home is the main dashboard for viewing testing data across your Sauce Labs organization. It provides a consolidated view of test execution metrics, build information, device coverage, visual testing results, failure analysis, and production error reporting.
The dashboard organizes this information into widgets, with each widget displaying metrics for a specific area of your testing environment. Most widgets provide links to dedicated pages where you can view additional details and investigate the underlying data.
Use Sauce Home to monitor testing activity, review quality metrics, identify failures, and access detailed reports from a single location.
Access Sauce Home
Sauce Home is the default landing page after signing in to your Sauce Labs account. You can return to the dashboard at any time while working in Sauce Labs.
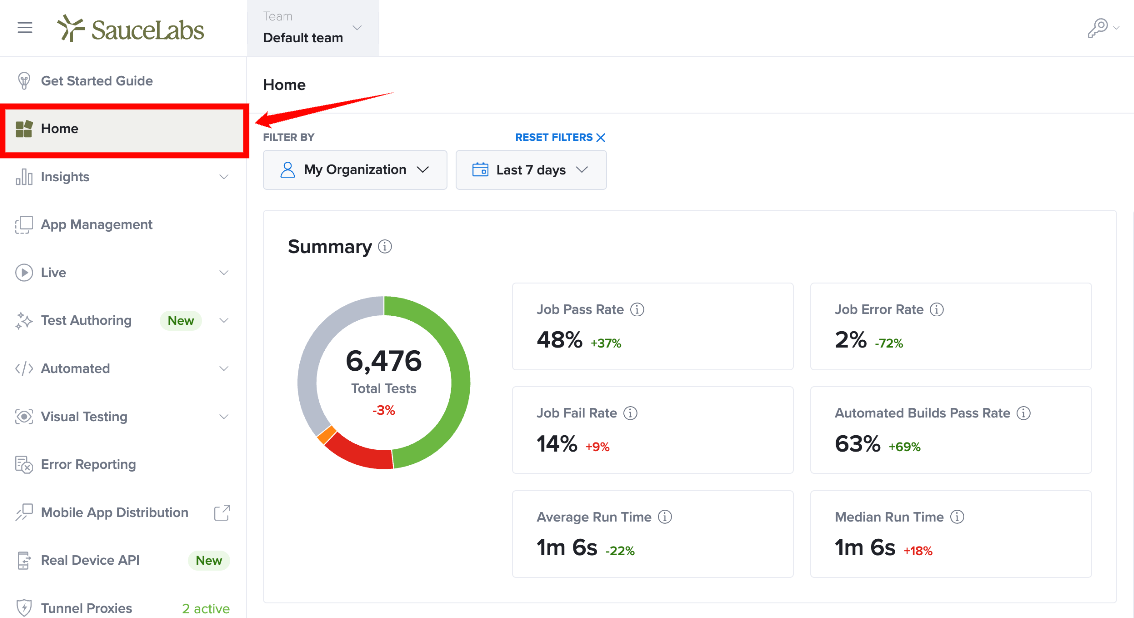
Step 1: From the left navigation menu, click Home. This opens the Sauce Home dashboard and displays the latest testing insights for your selected organization, team, or user.
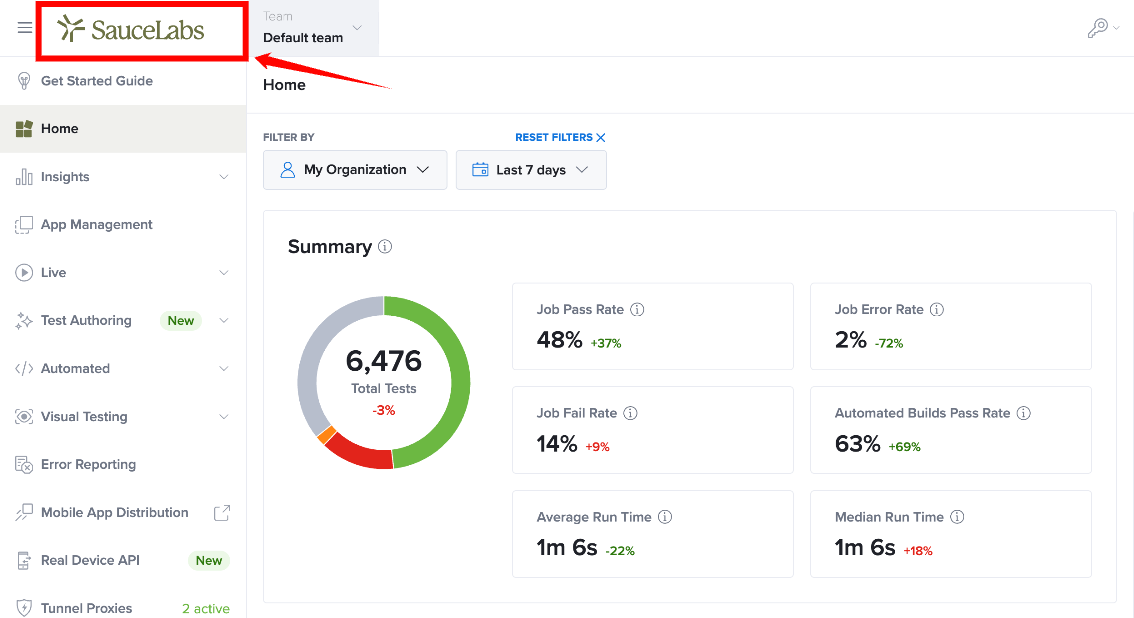
Step 2: Click the Sauce Labs logo in the upper-left corner of the page to return to the Sauce Home dashboard from anywhere with in the Sauce Labs platform.
The Sauce Home dashboard opens and displays testing metrics based on your current organization and filter selections.
Dashboard Layout
The Sauce Home dashboard is organized into several sections that provide insights into different aspects of your testing environment. Each section is displayed as an individual widget that summarizes key metrics and provides quick access to detailed reports.
Depending on the Sauce Labs products enabled for your organization, the dashboard may include widgets for:
- Summary
- Automated builds
- Device coverage
- Most failing devices
- Visual builds
- Failure analysis
- Production Error Reporting
Each widget displays real-time information based on the filters applied to the dashboard.
Summary
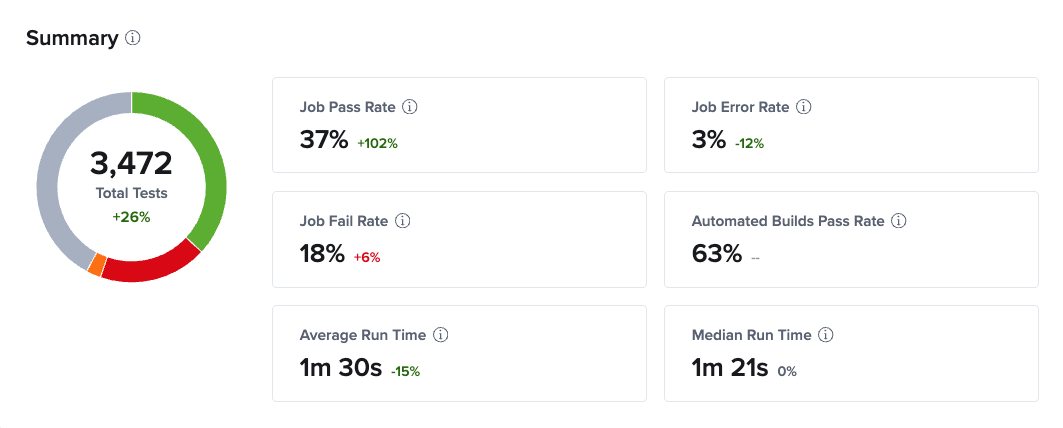
The Summary widget provides a high-level overview of your testing activity for the selected organization, team, user, and date range. It displays key performance indicators that help you quickly evaluate the overall health of your testing environment.
The widget includes metrics such as the total number of tests executed, job pass rate, job error rate, job failure rate, automated build pass rate, average test execution time, and median test execution time. These metrics provide an at-a-glance summary of your testing performance and help identify changes or issues that may require further investigation.
Automated Builds
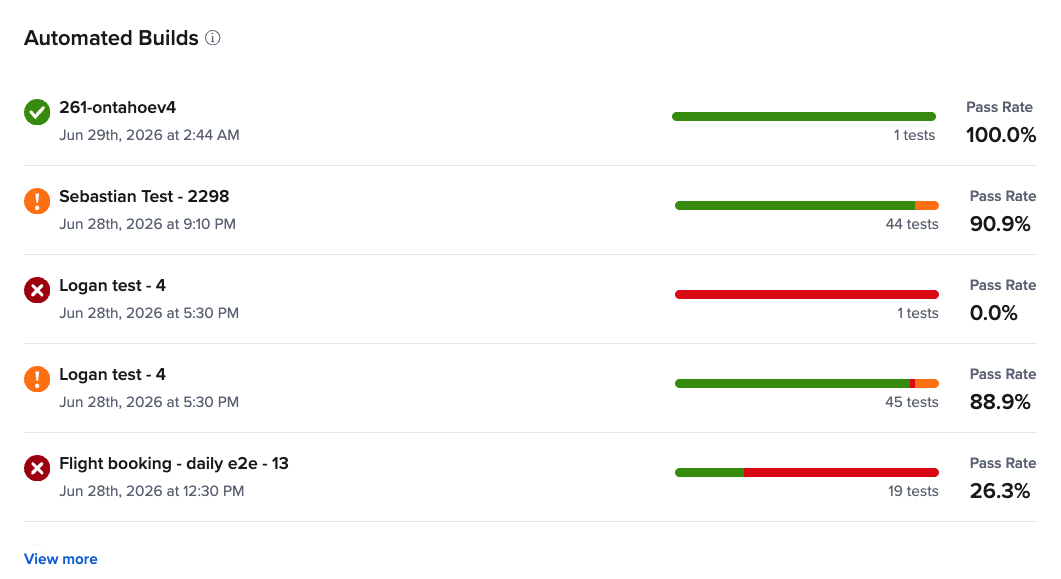
The Automated Builds widget displays recently executed automated test builds and their execution status. Each entry includes information such as the build name, execution time, overall pass rate, and the number of tests executed with in the build.
This widget allows you to monitor build quality, identify failed or unstable builds, and quickly determine which builds require further investigation. Selecting View More opens the complete Builds page, where you can access additional build details and test results.
Device Coverage
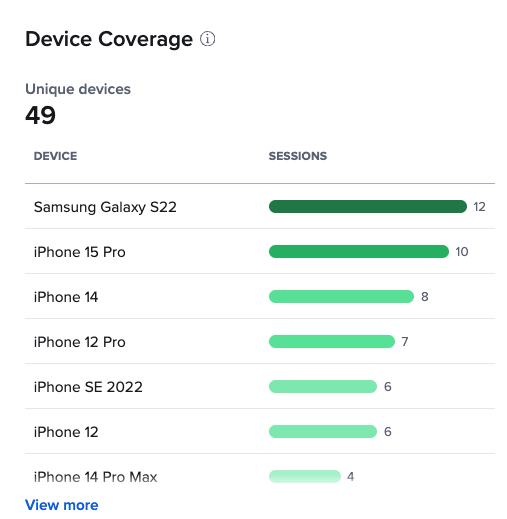
The Device Coverage widget provides an overview of the devices used during automated and live testing. It displays the total number of unique devices used with in the selected time period and highlights the devices that generated the highest number of test sessions.
This information helps you evaluate your device testing strategy, understand which devices are being tested most frequently, and identify opportunities to expand testing coverage across additional devices or operating system versions.
Selecting View More opens the Device Coverage page, where you can explore detailed device usage metrics and session information.
Most Failing Devices
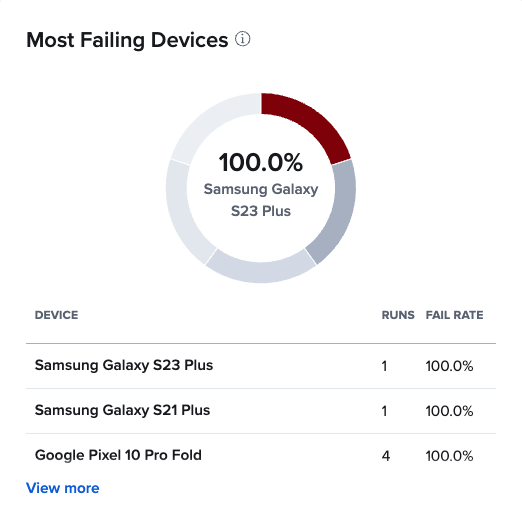
The Most Failing Devices widget highlights the devices with the highest number of failed test executions. Each device entry includes the number of executed tests, failed tests, and the corresponding failure rate.
By identifying devices that consistently experience test failures, this widget helps you detect device-specific issues, prioritize debugging efforts, and determine whether failures are isolated to particular hardware models or operating system versions.
Selecting View More opens the Job History page with filters applied for the selected device, allowing you to investigate the associated test executions.
Visual Builds
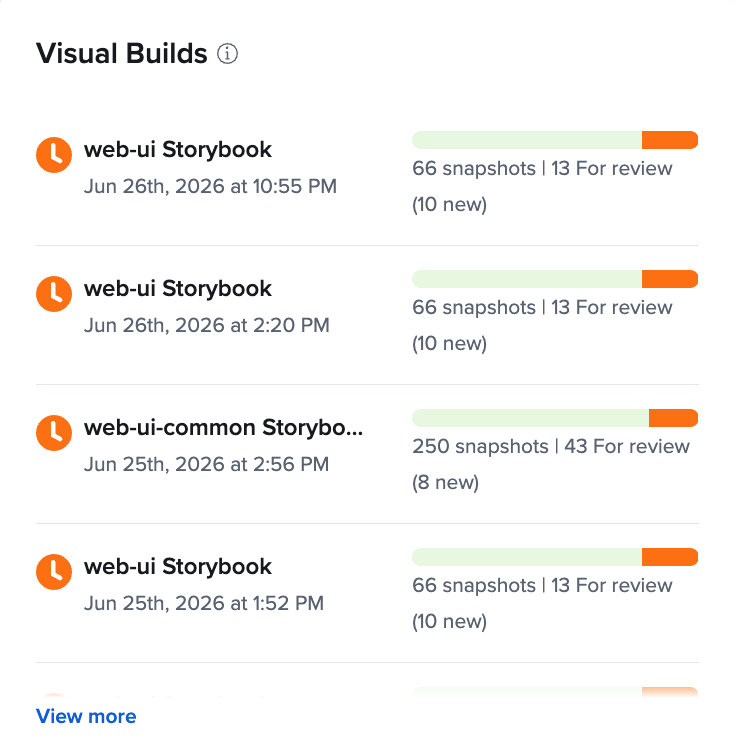
The Visual Builds widget provides an overview of recent visual testing builds. Each build displays information such as the build name, execution time, total snapshots captured, and the number of visual differences detected.
This widget allows you to monitor visual testing activity, identify builds that require review, and quickly determine whether user interface changes have introduced unexpected visual regressions.
Selecting View More opens the Visual Testing Builds page, where you can review snapshots, compare visual differences, and manage visual test results.
Failure Analysis
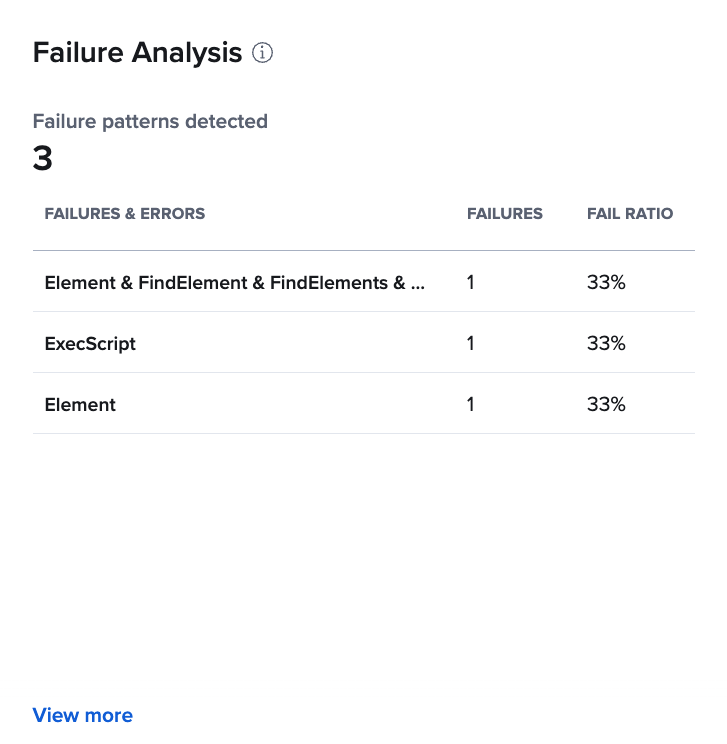
The Failure Analysis widget identifies recurring failure patterns detected across automated test executions. Similar failures are grouped together into patterns and displayed with the number of affected jobs and the percentage of failures associated with each pattern.
This helps teams quickly identify common causes of test failures, prioritize investigation based on impact, and focus debugging efforts on issues affecting the largest number of test executions.
Selecting View More opens the Failure Analysis page, where you can explore each failure pattern, review associated jobs, and investigate additional diagnostic information.
Production Error Reporting
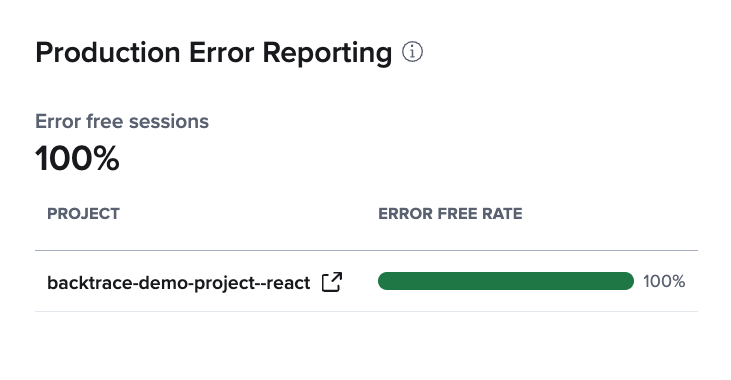
The Production Error Reporting widget displays application stability metrics collected from connected Sauce Labs Error Reporting projects. Each connected project displays its current Error-Free Rate, representing the percentage of unique users who used the application without encountering an error during the selected reporting period.
This widget helps bridge pre-production testing with production monitoring by allowing teams to compare testing results with real-world application stability. It also helps identify applications that require attention after deployment.
To populate this widget, Error Reporting must be configured for the project and stability metrics must be enabled through the Error Reporting SDK. Selecting View More opens the Error Reporting project for additional investigation.(Setup Guide)