Configure Sauce Home Filters
The Sauce Home dashboard includes filters that let you customize the testing data displayed in all insight widgets. Use the Scope and Date Range filters to focus on testing data for a specific organization, team, user, service account, or reporting period.
When you apply or change a filter, all widgets on the dashboard are automatically refreshed to display data that matches the selected criteria.
Available Filters
The filter bar is located at the top of the Sauce Home dashboard and includes the following filters:
| Filter | Description |
|---|---|
| Scope | Displays testing data based on the selected scope, such as Myself, My Organization, My Team, Users, Teams, or Service Accounts. |
| Date Range | Displays testing data for the selected reporting period. |
Configure the Scope Filter
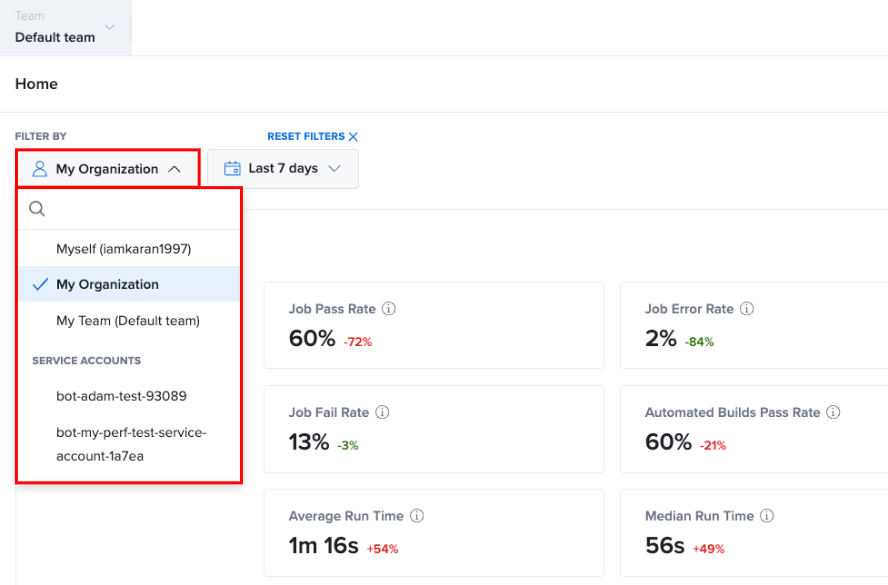
The Scope filter determines whose testing data is displayed throughout the dashboard. Depending on your account permissions, you can view testing insights for yourself, your organization, a specific team, an individual user, or a service account.
The available scope options depend on your organization's configuration and your account permissions.
| Scope | Description |
|---|---|
| Myself | Displays testing data generated by your own Sauce Labs account. Use this option to review your personal testing activity and testing metrics. |
| My Organization | Displays testing data aggregated across your entire Sauce Labs organization, providing an organization-wide view of testing activity and quality metrics. |
| My Team | Displays testing data for your default team. Use this option to monitor testing activity performed by your team members. |
| Service Accounts | Displays testing data generated by service accounts, which are commonly used for CI/CD pipelines, automation frameworks, and scheduled test executions. |
| Users | Displays testing data for a specific user with in your organization. After selecting this option, choose a user from the available list to view their testing activity. |
| Teams | Displays testing data for a specific team with in your organization. After selecting this option, choose a team from the available list to view its testing metrics. |
Configure the Date Range Filter
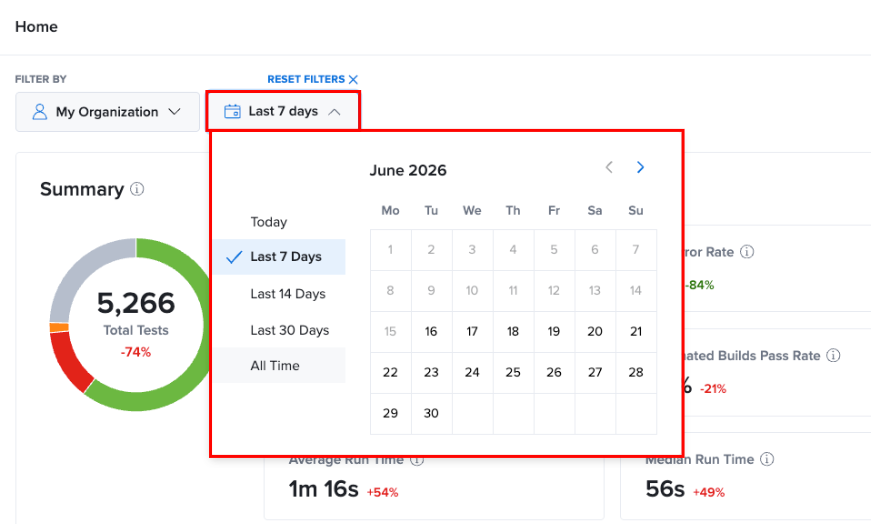
The Date Range filter controls the reporting period used to display testing data throughout the dashboard.
Select a predefined reporting period to view testing metrics collected during that time frame. All insight widgets are automatically updated using the selected date range.
| Date Range | Description |
|---|---|
| Last 7 Days | Displays testing data collected during the previous seven days. This option helps monitor recent testing activity and identify newly introduced issues. |
| Last 14 Days | Displays testing data collected during the previous fourteen days, providing a broader view of testing trends and build performance. |
| Last 30 Days | Displays testing data collected during the previous thirty days. Use this option to analyze longer-term testing metrics and quality trends. |
| All Time | Displays all available testing data for the selected dashboard scope, regardless of when the tests were executed. |
Reset Filters
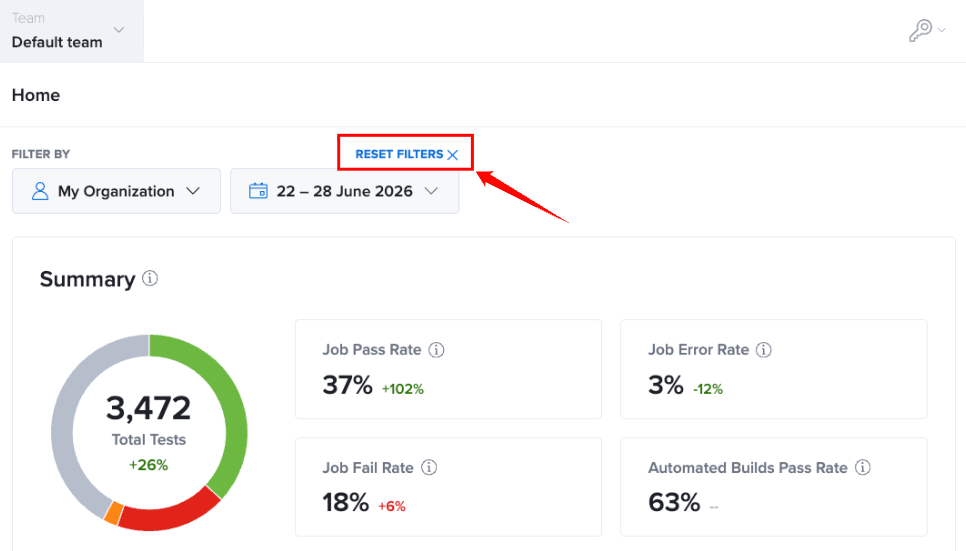
To restore the default dashboard view, click Reset Filters at the top of the dashboard. All dashboard widgets automatically refresh and display data using the default filter settings.