Analyzing Failure Patterns Across Your Test Suite
Failure Analysis is a powerful tool designed to optimize test efficiency and efficacy by identifying common failure patterns within your test suite. Leveraging proprietary machine learning algorithms, the tool reviews the test pass/fail data to uncover patterns that impact the overall test suite. Each organization has its copy of the machine learning algorithm trained only on its data. It takes three failures on tests with the same name before patterns can be established. This document provides an overview of how Failure Analysis works and explains the different views available for analysis. Using Failure Analysis:
- Improves developer efficiency, streamlining detection and triage of the most pervasive errors
- Validates investment in test automation by showing larger patterns as a source of failure, allowing for global mitigation and faster time-to-market with better quality
Failure Analysis supports Selenium and Appium on Virtual and Real devices. At this time Visual testing does not work with Failure Analysis. However, for Selenium and Appium to be effective, the tests must be configured to report a pass/fail outcome. Additionally, Appium is supported only for mobile web applications and not for native applications.
Where to access Failure Analysis
Failure Analysis can be accessed from a few different places within the Sauce Labs platform. Failure Analysis is primiarly avaliable via the left-hand navigation, under the Insights heading. Clicking the Failure Analysis heading will take you straight to your Failure Analysis based on the tests of your team or organization for the past 7 days by default. As we talk about below, Failure Analysis can also be accessed directly from Test Details within Live or Automated Test Results. Both these views and entry points can give you a sense of how individual tests are performing and their associated failure patterns.
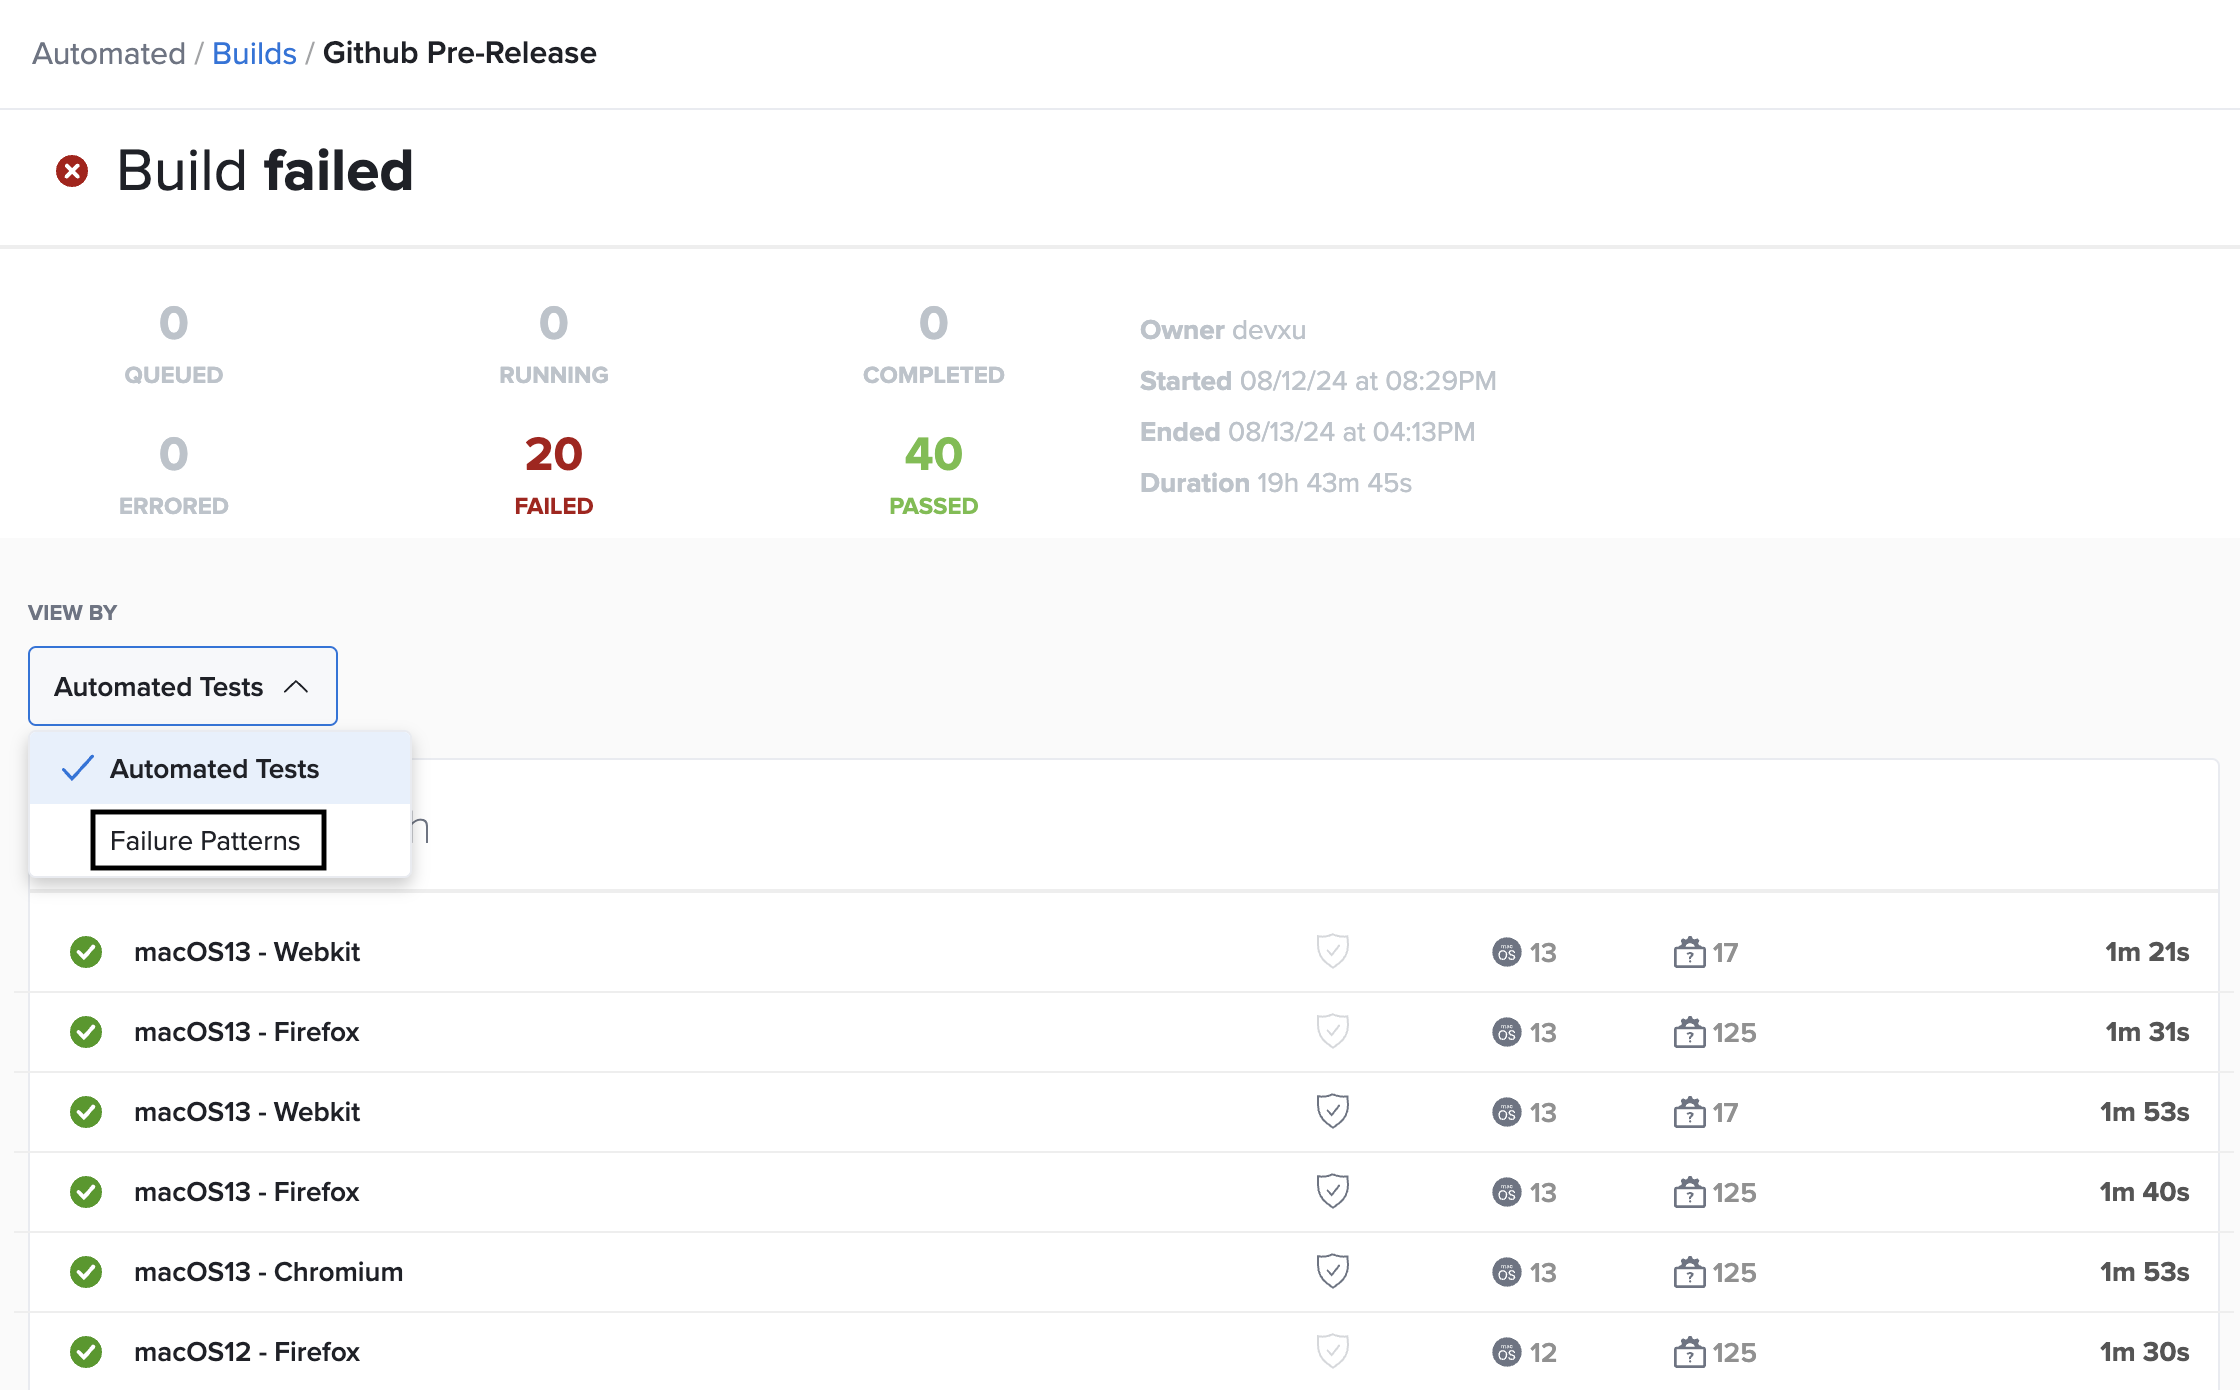
Analyzing failures across builds can also be extremely helpful to understand trends over time of your builds. This view can help you identify pervasive failures in invidvidual builds, debug those failures swiftly, and get your code to production quicker. Accessing Failure Analysis from builds is simple. Navigate to Automated tests and then the build menu. Select the build you want to analyze or debug deeper and then select Failure Patterns from the drop-down to starting debugging.
How it Works
Failure Analysis utilizes your test data to identify potential failure patterns based on aggregate test errors. The process involves the following steps:
- Identifies failed tests
- Aggregates failures on test names
- Detects common failure patterns
- Ranks and prioritizes patterns by most pervasive impact
As of August 2024 Failure Analysis uses an improved command decoder to help you identify what actions have been taken during a test. Normally, test commands can be difficult to read because they contain hashes or element IDs that don't mean much to a human being, but are necessary for the test to know what is happening. Sauce Labs' improved decoding gives a near test command like structure and language convention to these failure patterns. When viewing Failure Patterns, Sauce Labs now gives you an improved naming scheme that more closely resembles what is happening during a test step as seen below. This enhanced decoder is accessible through any of the views below.
Available Views
Two different views are available:
View by Jobs
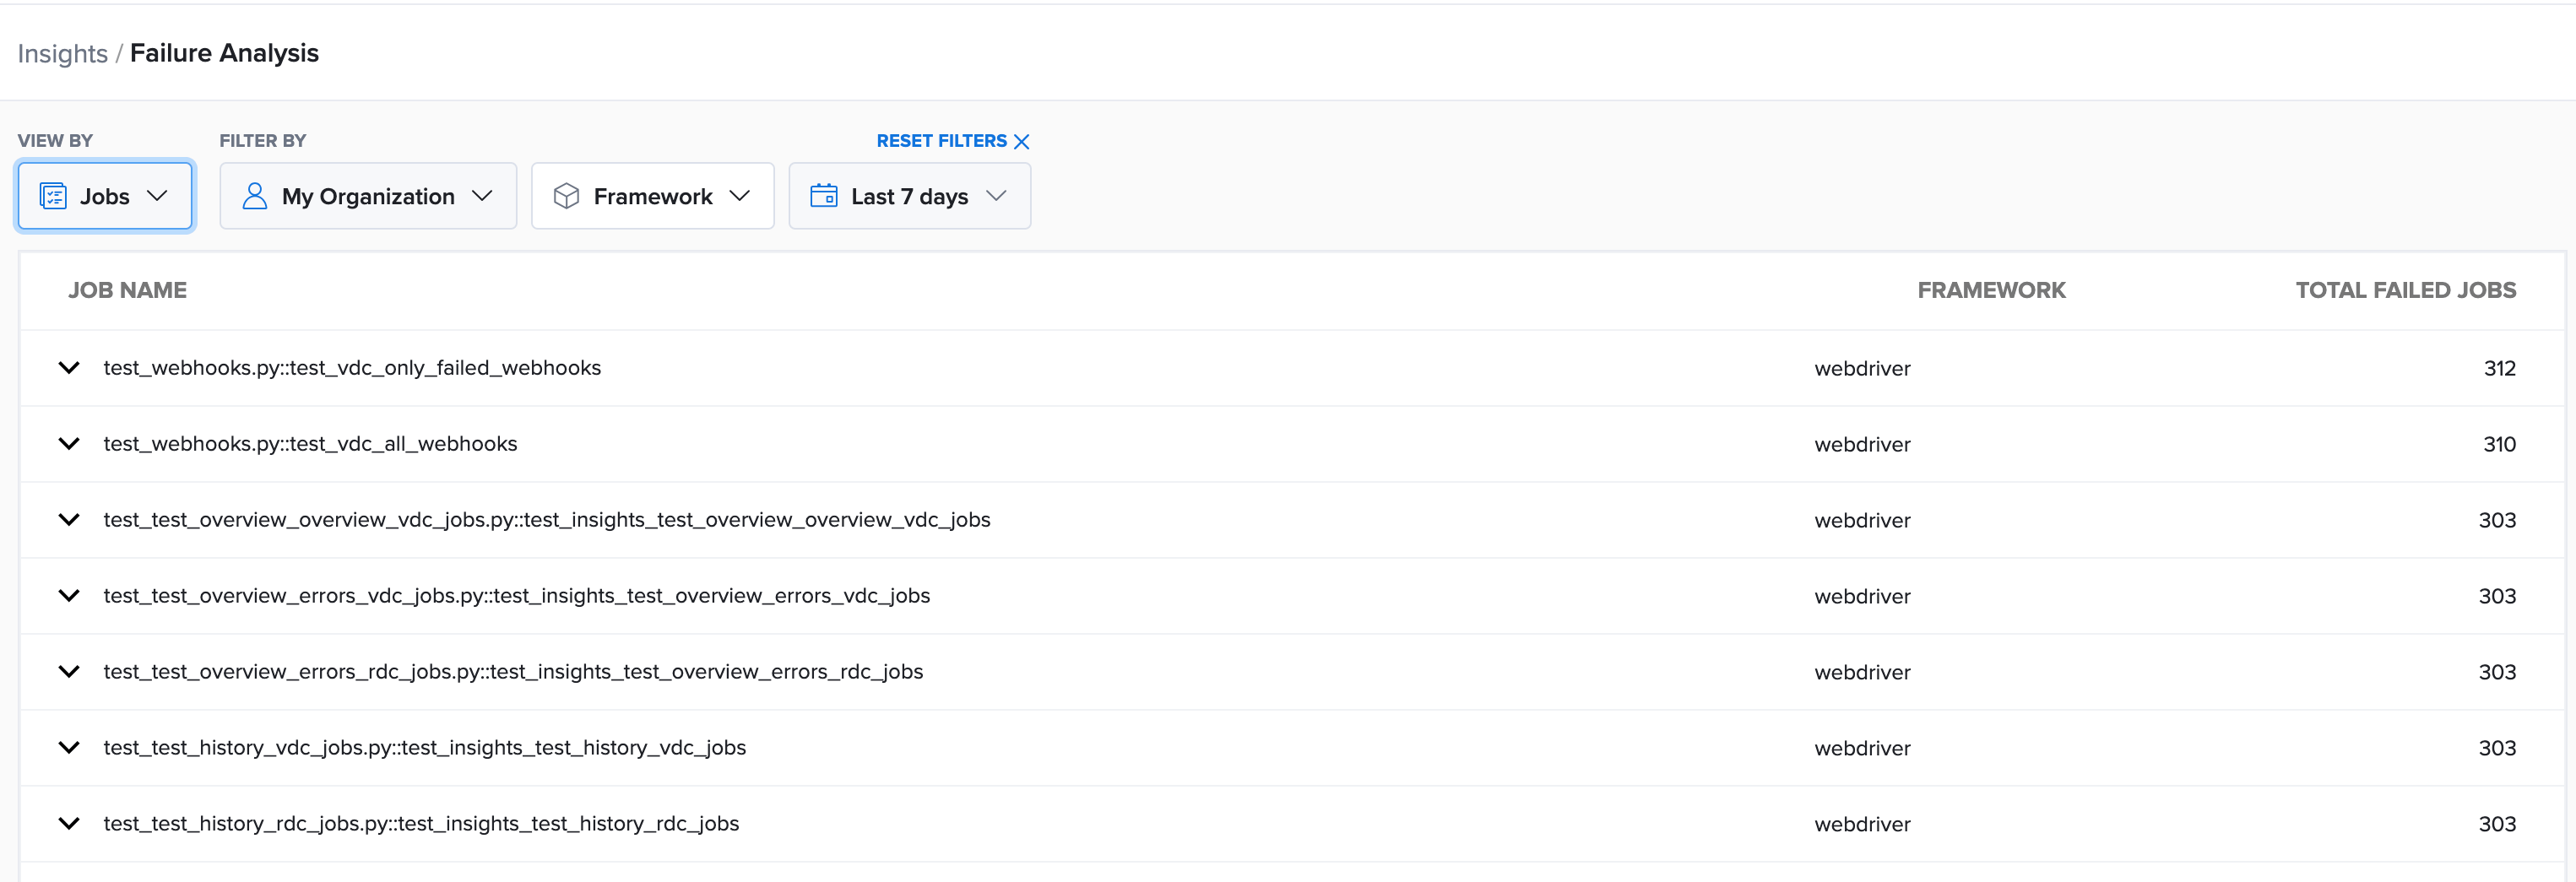
In this view, you can filter results to focus on specific jobs. Additionally, you can filter by your team’s tests, your organization’s tests, or failures belonging to a specific team member if you are a team member or team admin. If you are an org admin, you can filter failures belonging to any organization member. Additionally, you can apply filters based on the testing framework and time range.
This view displays all the failed jobs with the total number of occurrences. You can access Failure Patterns details associated with a specific test by clicking on a specific test. Each test may have more patterns, and the number of tests involved in each pattern is visible.
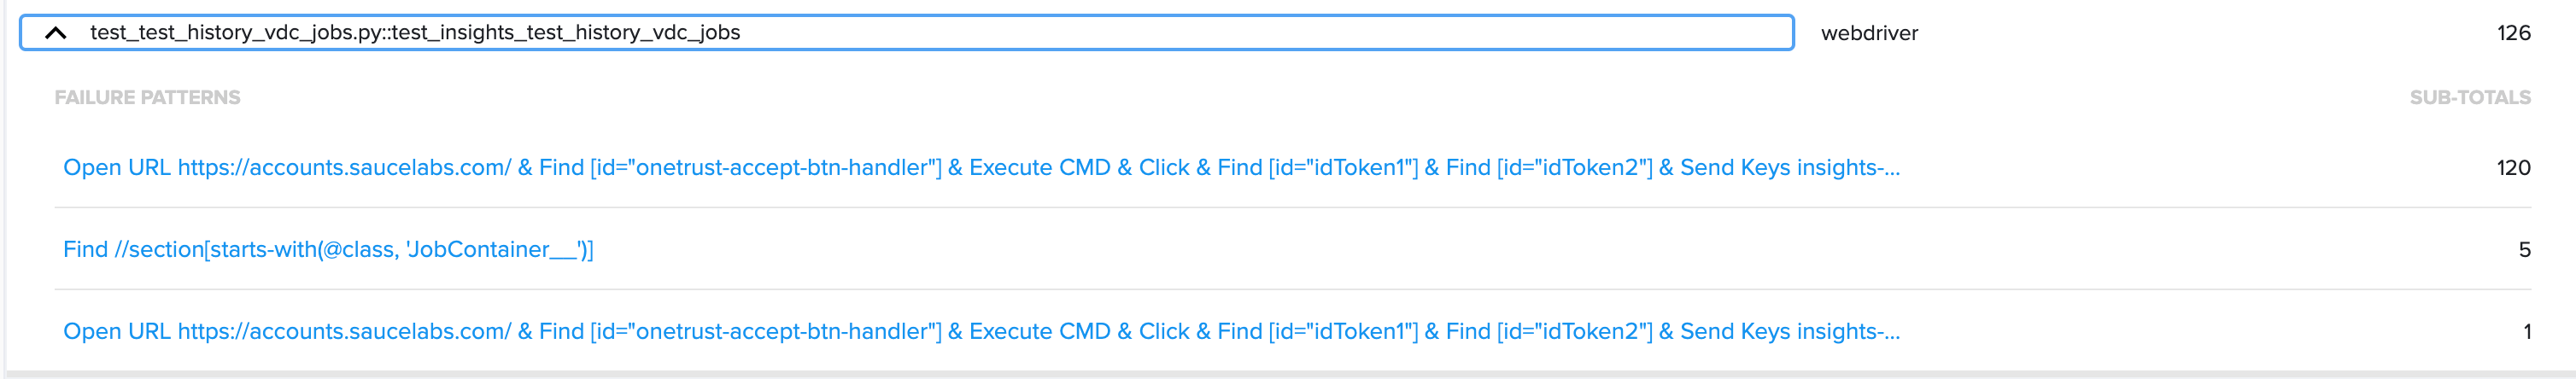
For example, the image below shows a failed test with 126 failures in total, with 3 different failure patterns: the first for 120 times, the second for 5 times, and the last for 1 time only.
View by Failure Patterns
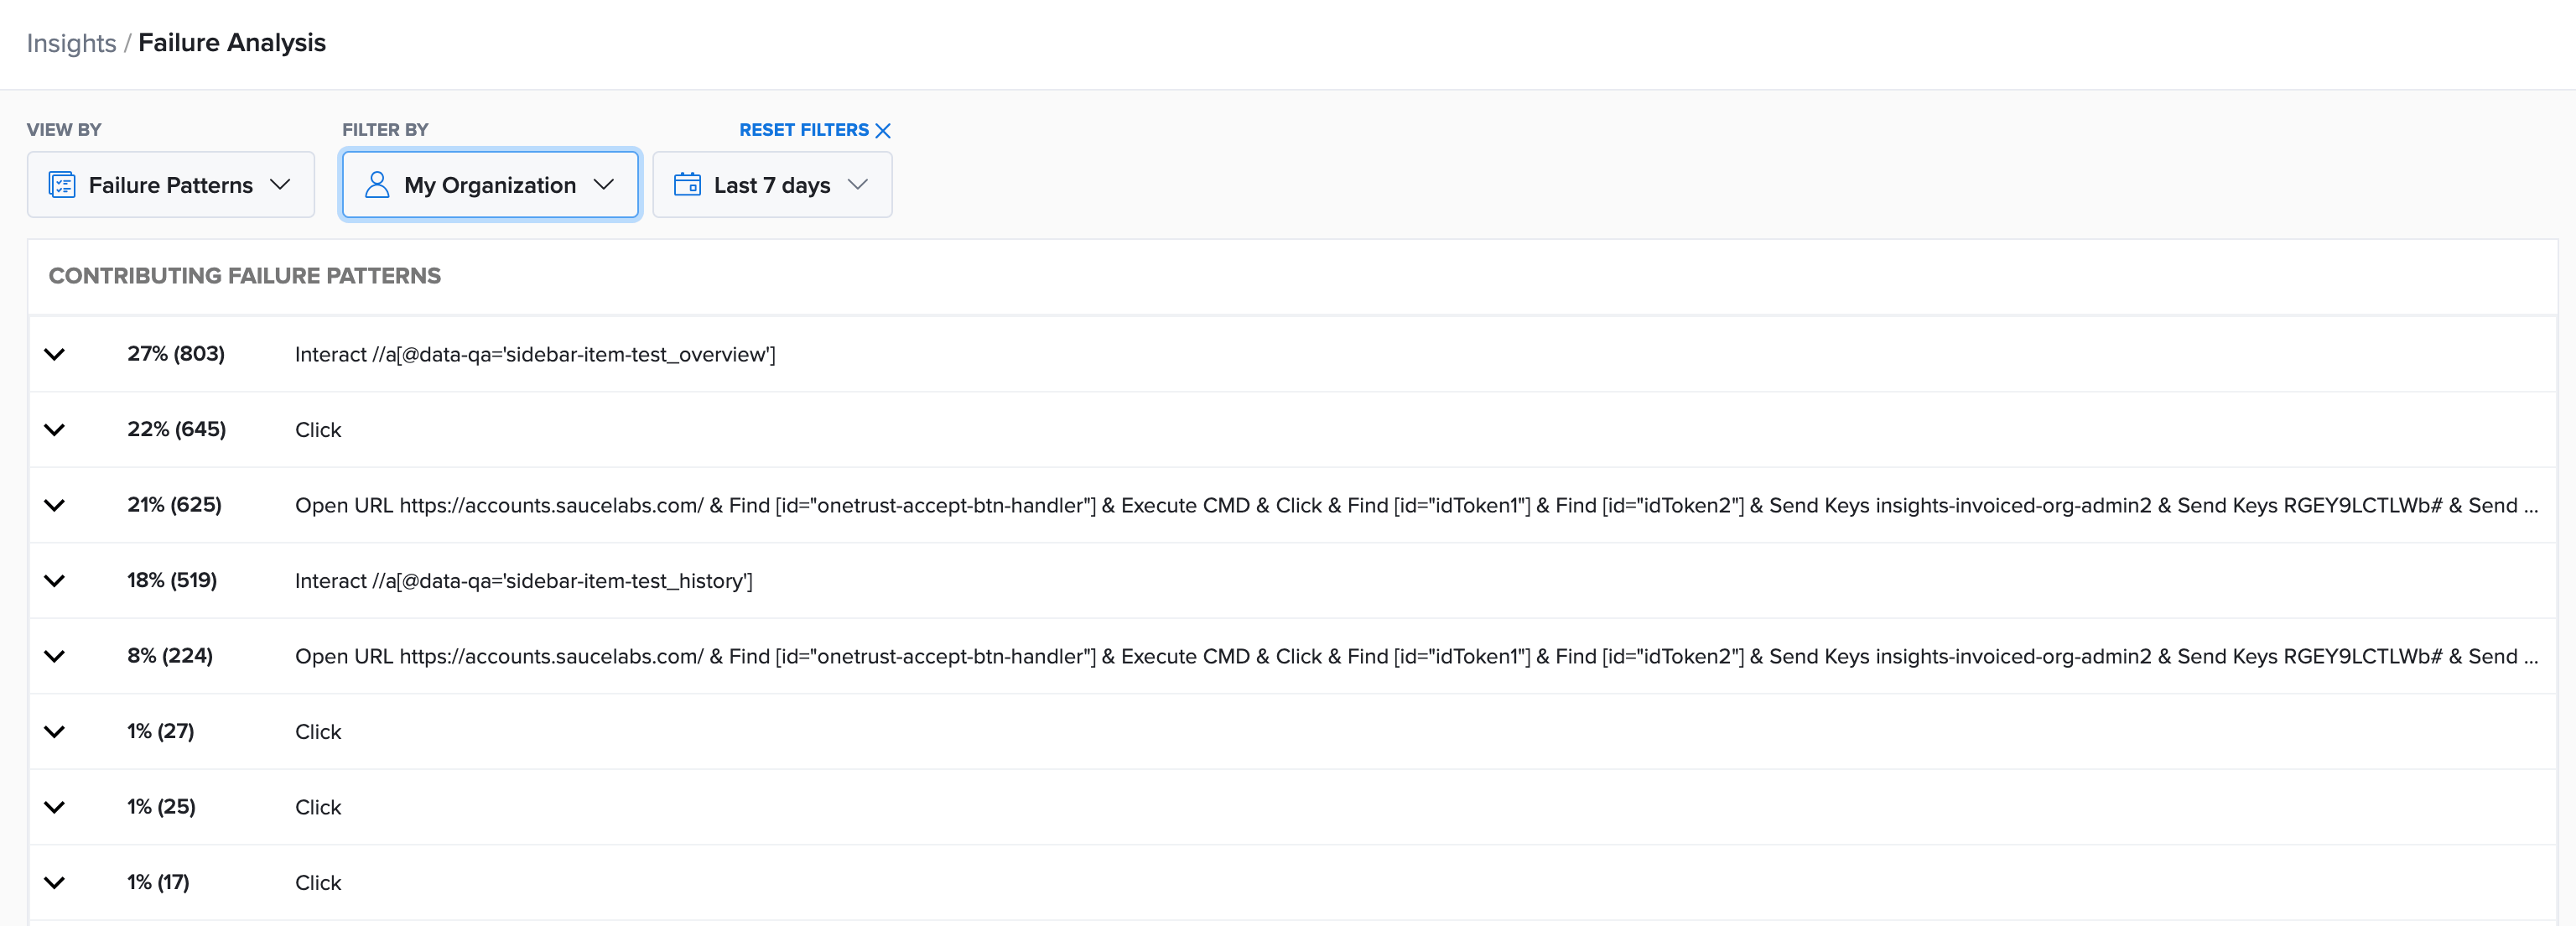
In this view, you can filter results to focus on failures related to your tests. Additionally, you can filter by your team’s tests, your organization’s tests, or failures belonging to a specific team member if you are a team member or team admin. If you are an org admin, you can filter failures belonging to any organization member. Furthermore, you can apply filters based on the time range.
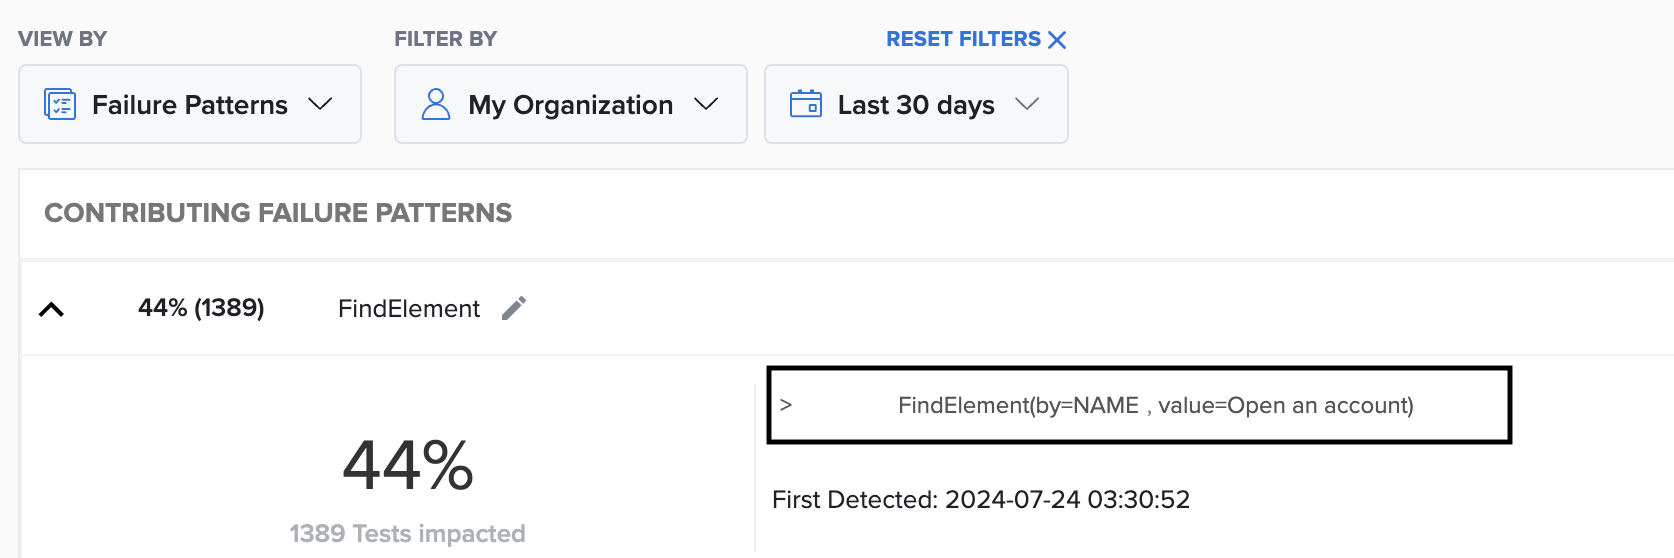
In this view, you can examine failures based on patterns ordered from most to least impactful. It allows you to identify patterns that require more attention quickly. The pattern’s total percentage of impact and the number of tests affected by that pattern are displayed alongside the pattern.
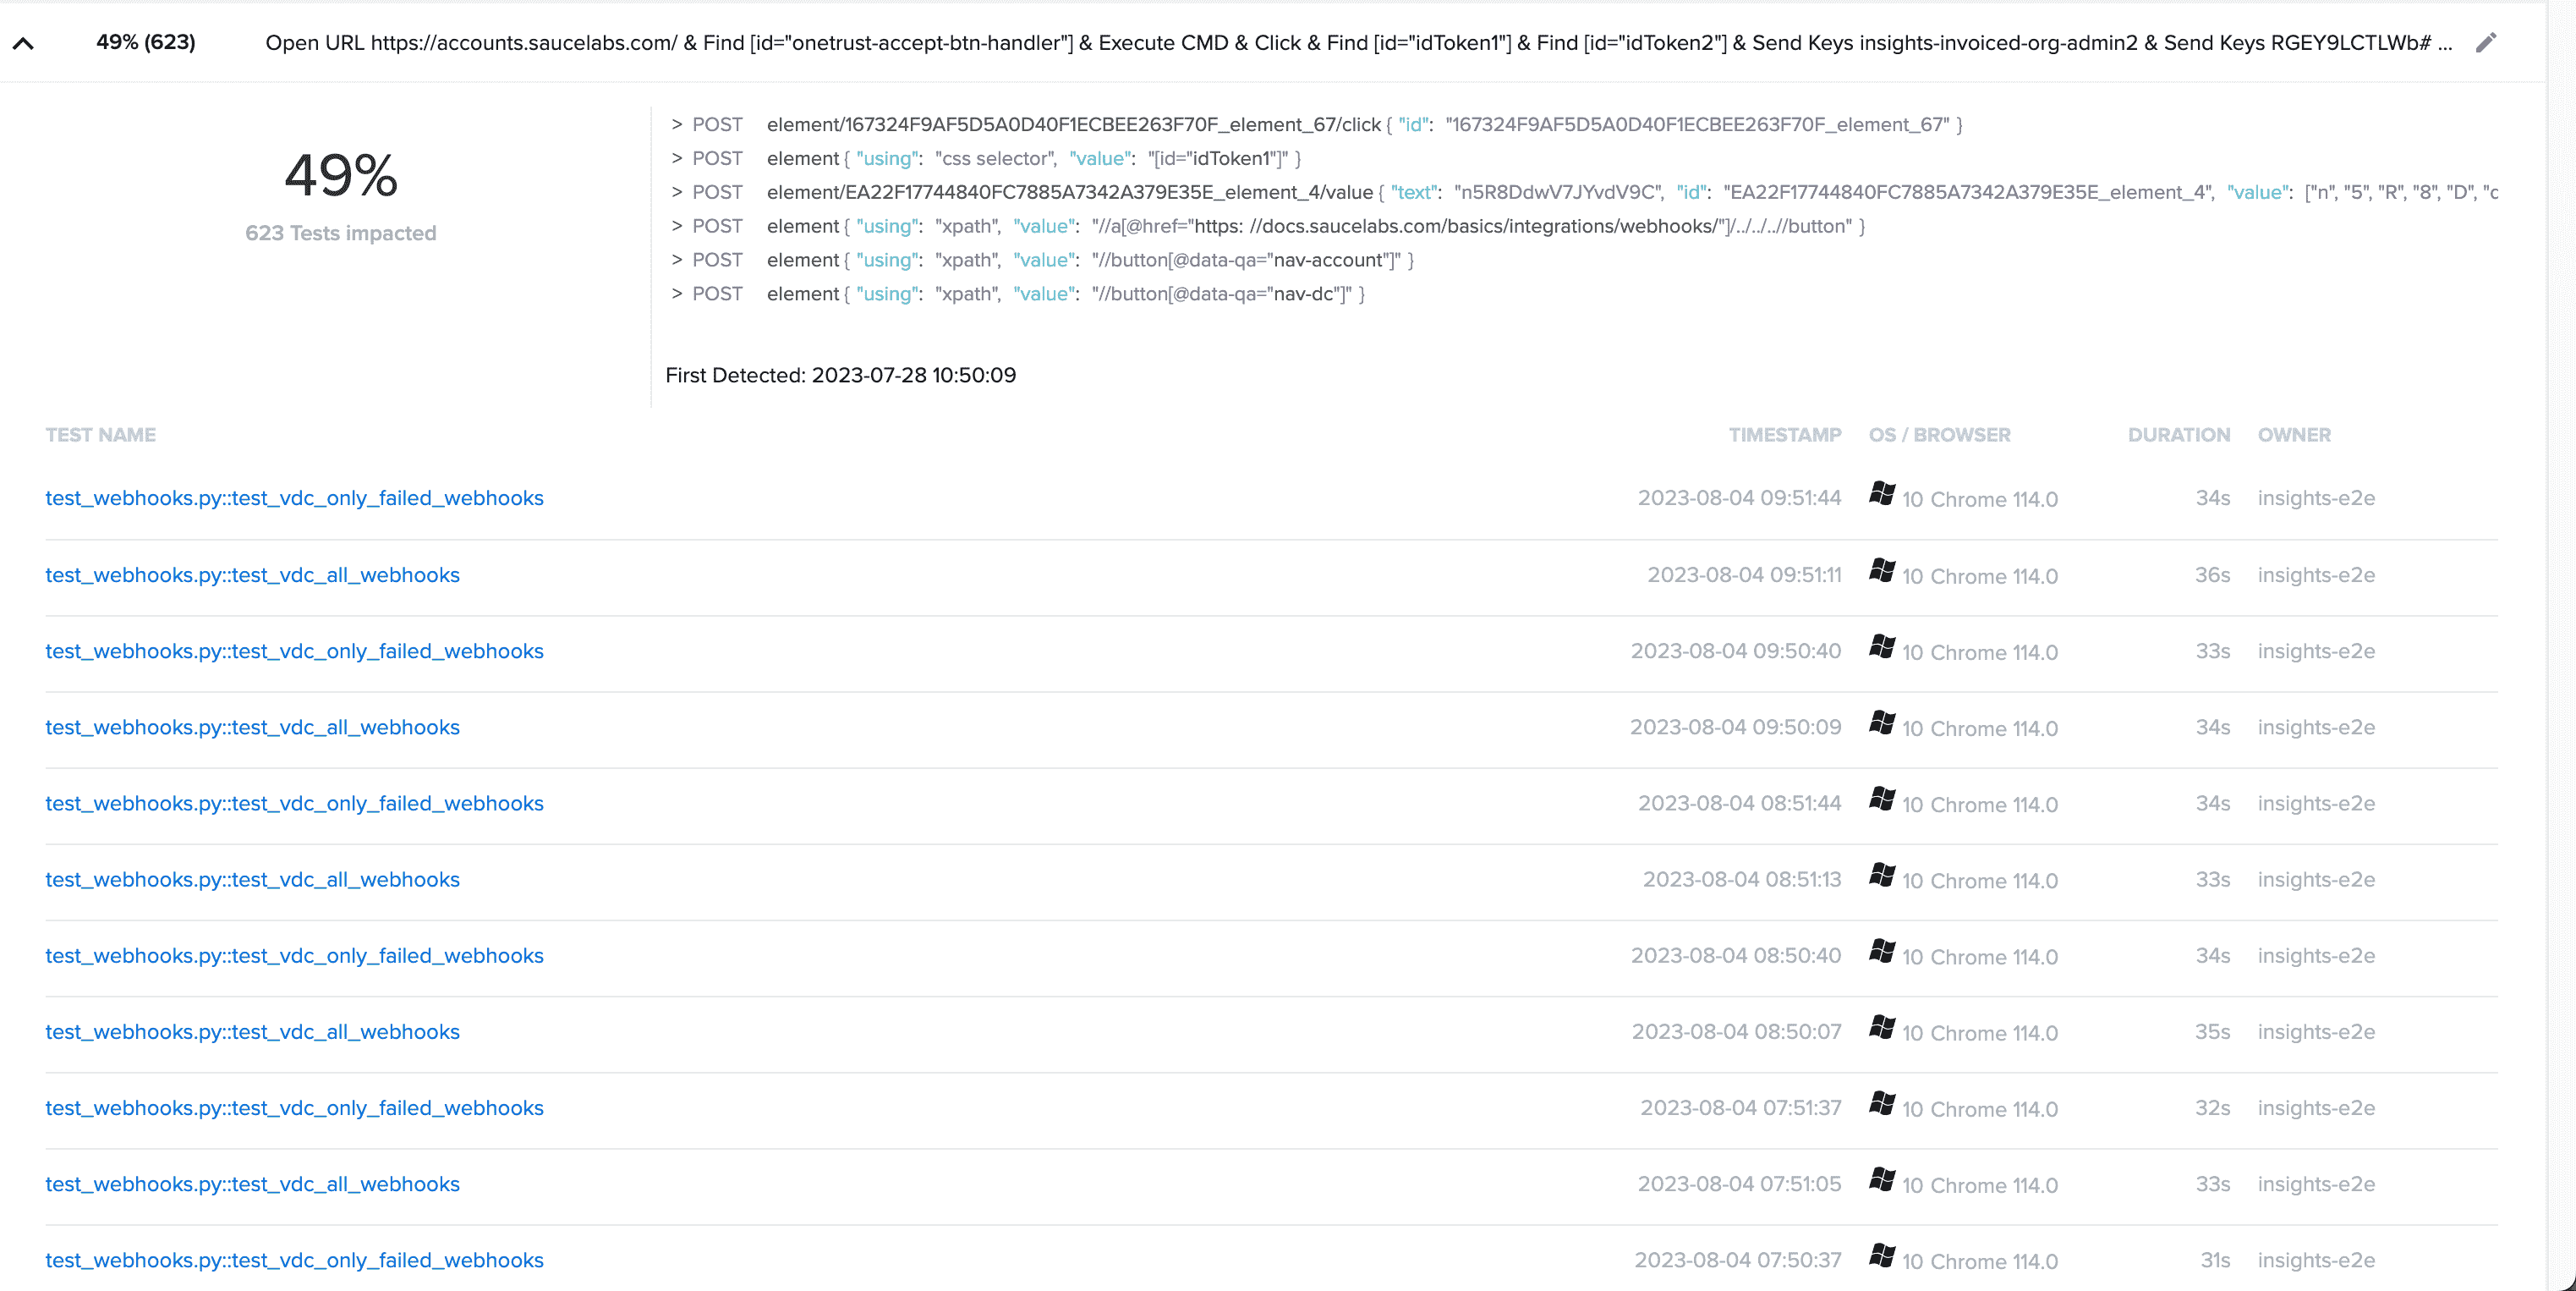
Clicking on a specific pattern reveals detailed information, including the percentage of impacted tests, the total number of tests involved, the actions associated with the pattern, and the first time the pattern was detected. It also shows all the affected tests with relevant details such as timestamp, OS/Browser used, failure duration, and the owner.
In the following image, you can see a pattern with a high impact on the test since it impacted 623 tests corresponding to 49% of the total. Additionally, it shows the test involved with the related details.
There is seamless integration between Failure Patterns and Test Results/Test Details in the Live and Automated sections. By clicking on a test name in the Failure Analysis view, you will be redirected to the related Test Details page, providing specific details about that particular test. If you aim to identify trends across failures and builds, the Failure Patterns view is a great starting point, followed by exploring the Test Results/Test Details page. Conversely, if you are investigating the root cause of a specific test failure, you can begin with the Test Results/Test Details and then explore Failure Patterns to understand its impact on your overall test strategy.
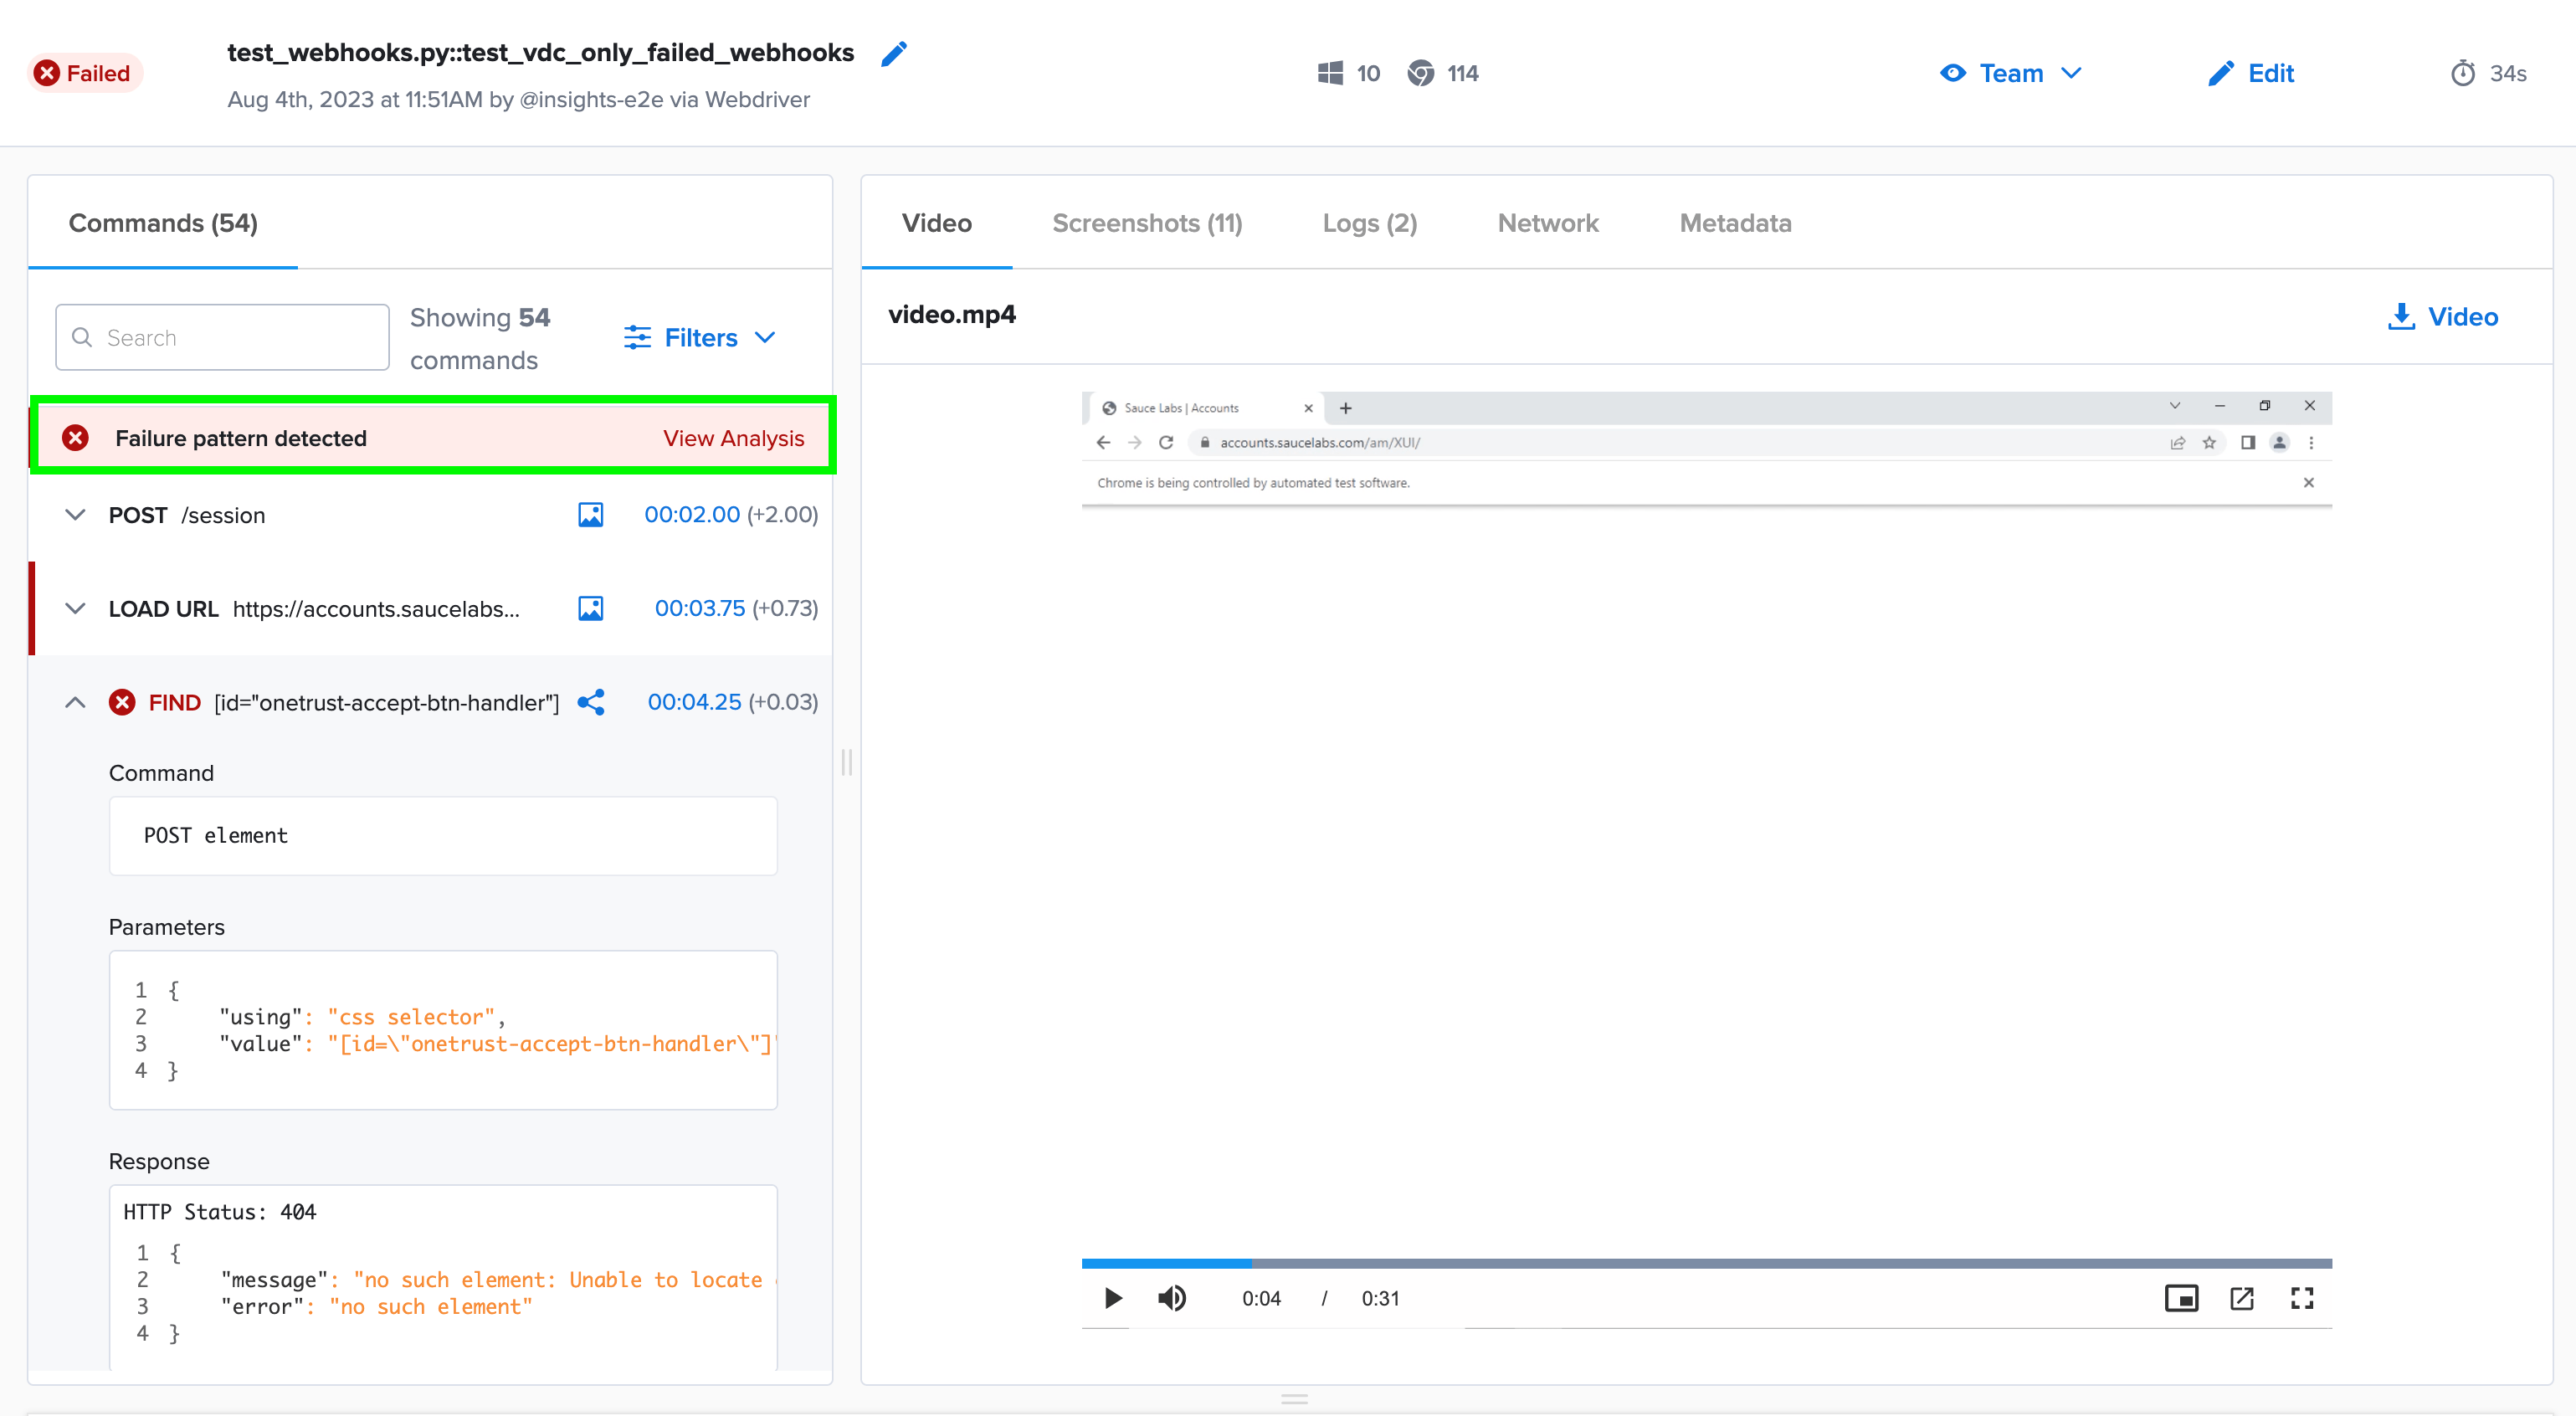
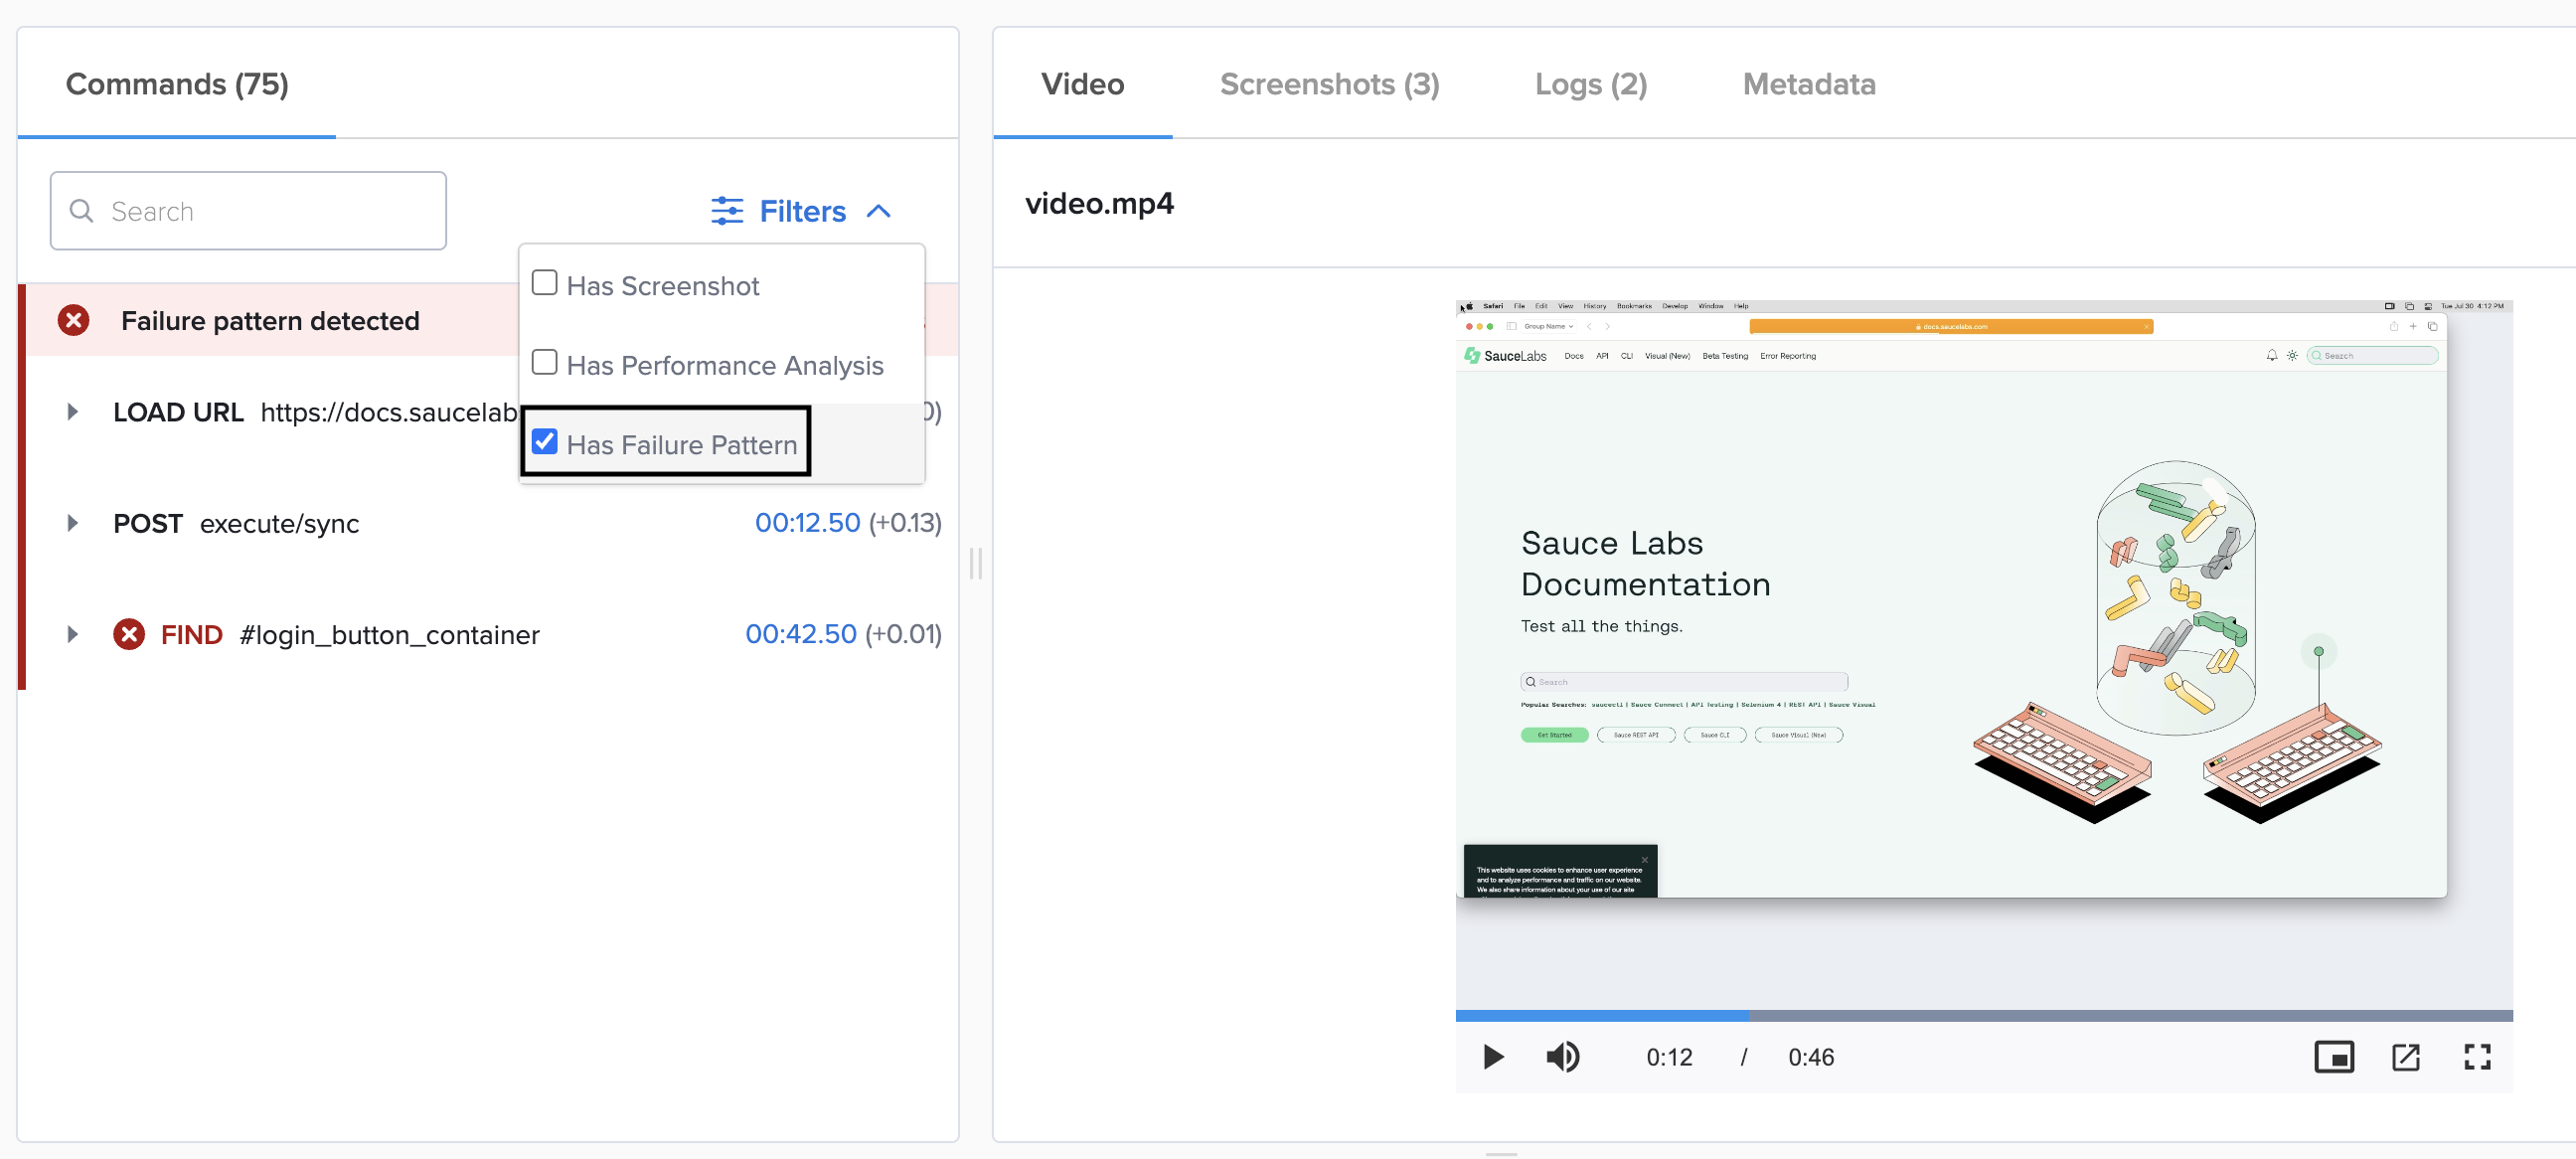
Once you have used Failure Analysis to identify the most pervasive patterns you'd like to investigate, click the test name on the Failure Analysis page to dig down into the individual test on the Test Details page. You will see a list of commands or steps contained within that test. To isolate the failure patterns we identified in the previous views and steps from the rest of the test commands, use the filter at the top of the command list to drill down and only surface test commands that have been identified in a failure pattern. To debug your tests faster you can click the time stamp next to the filtered command line to view the video of the test to verify the issue.
To enhance the power of the Failure Analysis tool, it is recommended to Provide Context for Selenium Commands with the JavaScript Executor.