Analyzing Test Case Health
The Job Overview page, accessible from the Insights heading, offers two frames of reference to view health of the aggregate of your jobs. First is the Overview tab, which offers a visual overview of job case health over time, job summary, and job breakdown. Job Overview also gives you access to the Errors tab which details errors for all your jobs over time.
The Extended Debugging feature offers access to HAR files and JavaScript console logs, assisting in the identification of flaky tests. For more details, refer to Debugging Tests with JavaScript Console Logs and HAR Files (Extended Debugging).
Accessing the Job Overview Page
- Click the Insights tab to expand its submenu.
- Click Job Overview.
- Apply filters to narrow down the list of jobs within a specific range.
Job Overview Tab
The Job Overview page offers three data visualizations on the Overview tab to give you insight into your jobs over time.
Job Overview
The Job Overview visualization gives you a bar chart with a few different categories reprsented to give you an overview of how your suite has performed over a given period of time. This bar chart is usually broken down into five categories.
- Consistently Failing
- Consistently Passing
- Consistently Erroring
- Jobs with Missing Status
- Inconsistent Resulting
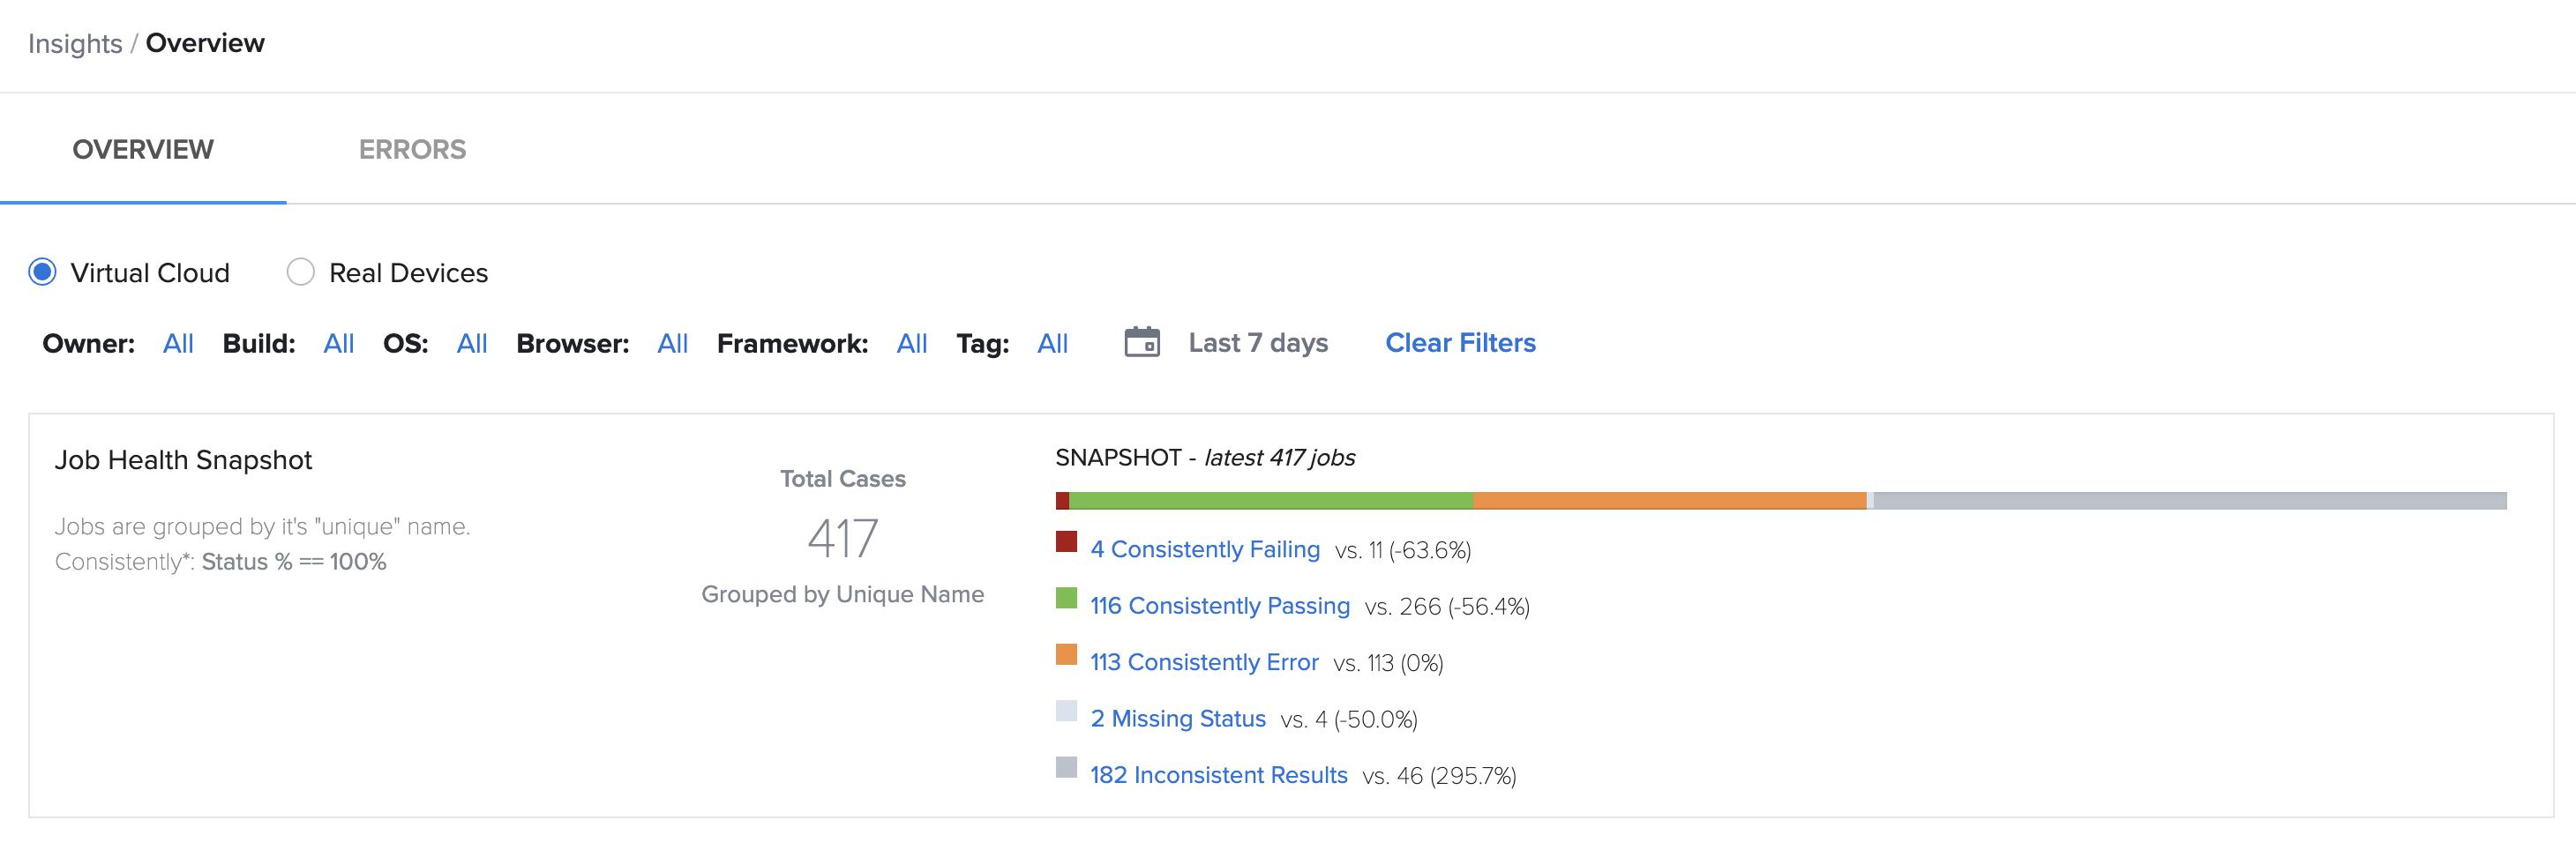
Using this data, you can identify if your test suite is performing as expected and where to debug if necessary. Clicking each of the headings will take you to that filter within the Job History page to drill down into the tests that are comprised in that filter. Use the filters above the visualization to identify builds, browsers, or platforms and the time-frame to surface test data that is most important to your organization.
Job Summary
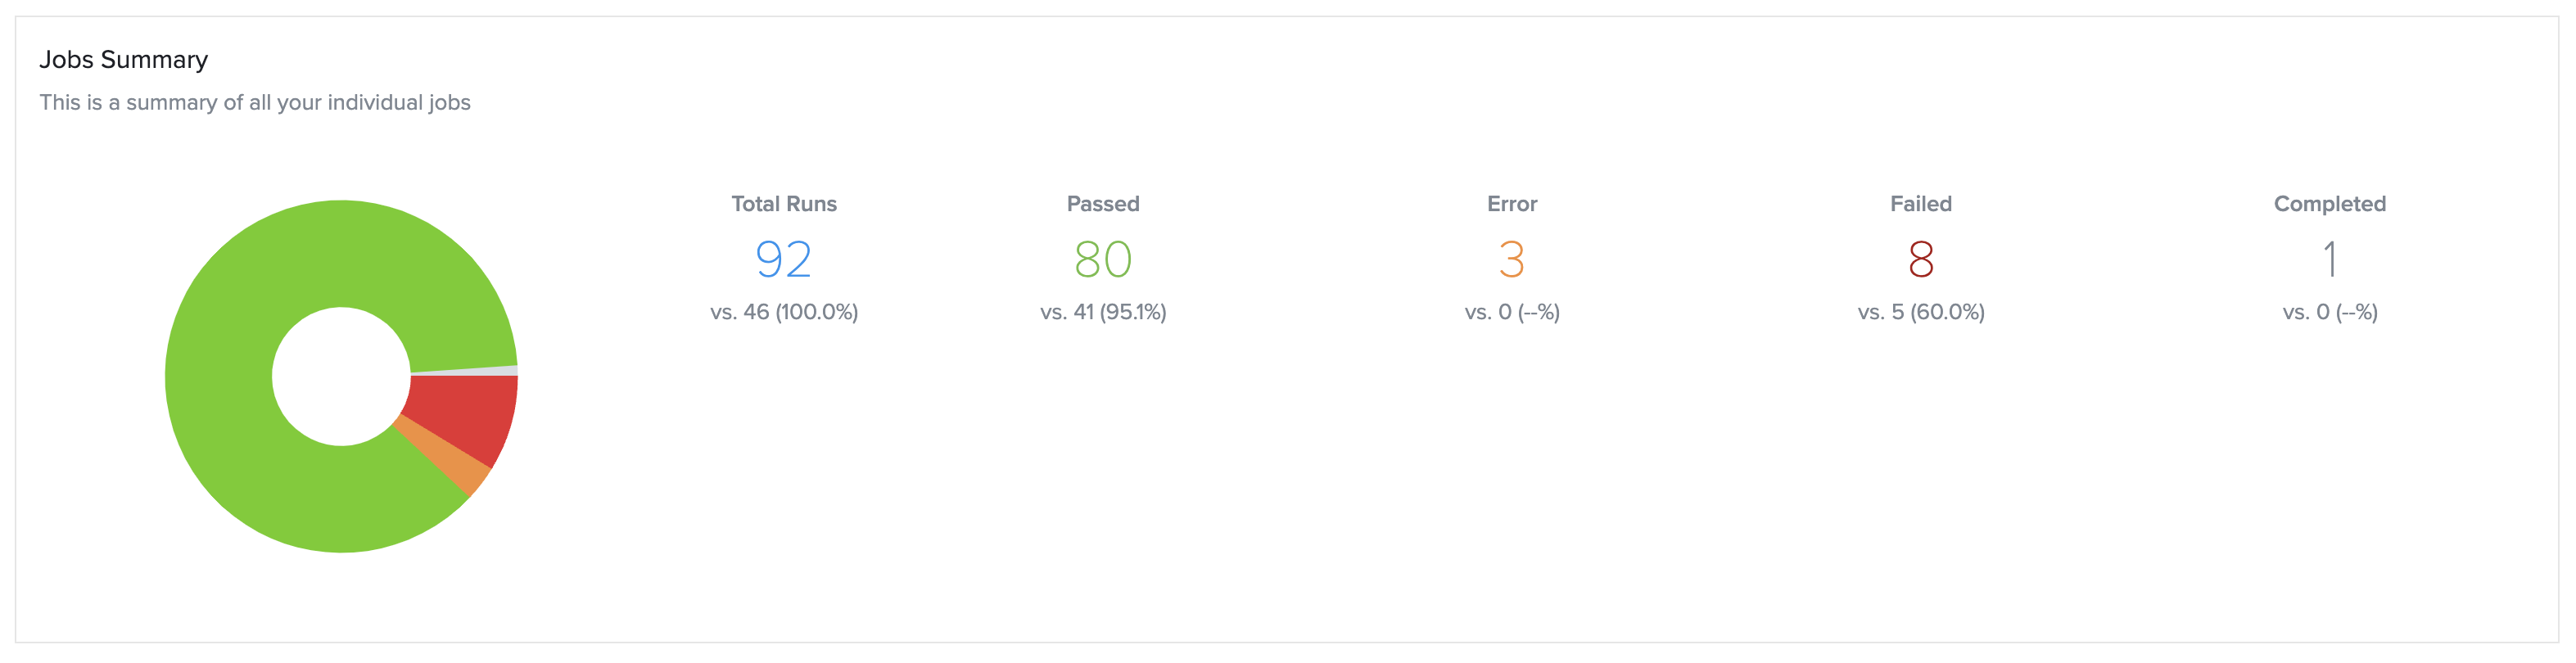
The Job Summary section gives you a pie chart, and associated raw numbers with percentages, of the fundamentals of your testing strategy over the selected period of time. This visualization also compares usage for the same time interval previous. For example, if you select 30 days from the filter you will see your current 30 days of jobs compared to your last 30 days of jobs in this visualization. Job Summary shows you proportions of:
- Total Runs
- Passed
- Errored
- Failed
- Completed
Completed tests are sometimes aggregated due to not receiving a pass or failure declaration or intent. Be sure to send all your pass/fail results to Sauce Labs to take advantage of Insights.
Job Breakdown
Job Breakdown gives you insight into your test suite by categorizing all your individual jobs by OS, Browser version, Framework and Device type. You can use this section to understand where your testing coverage is currently, where you may need more testing based on current analytics, and deep dive into OS or Browser versions to ensure proper coverage across your testing suite.
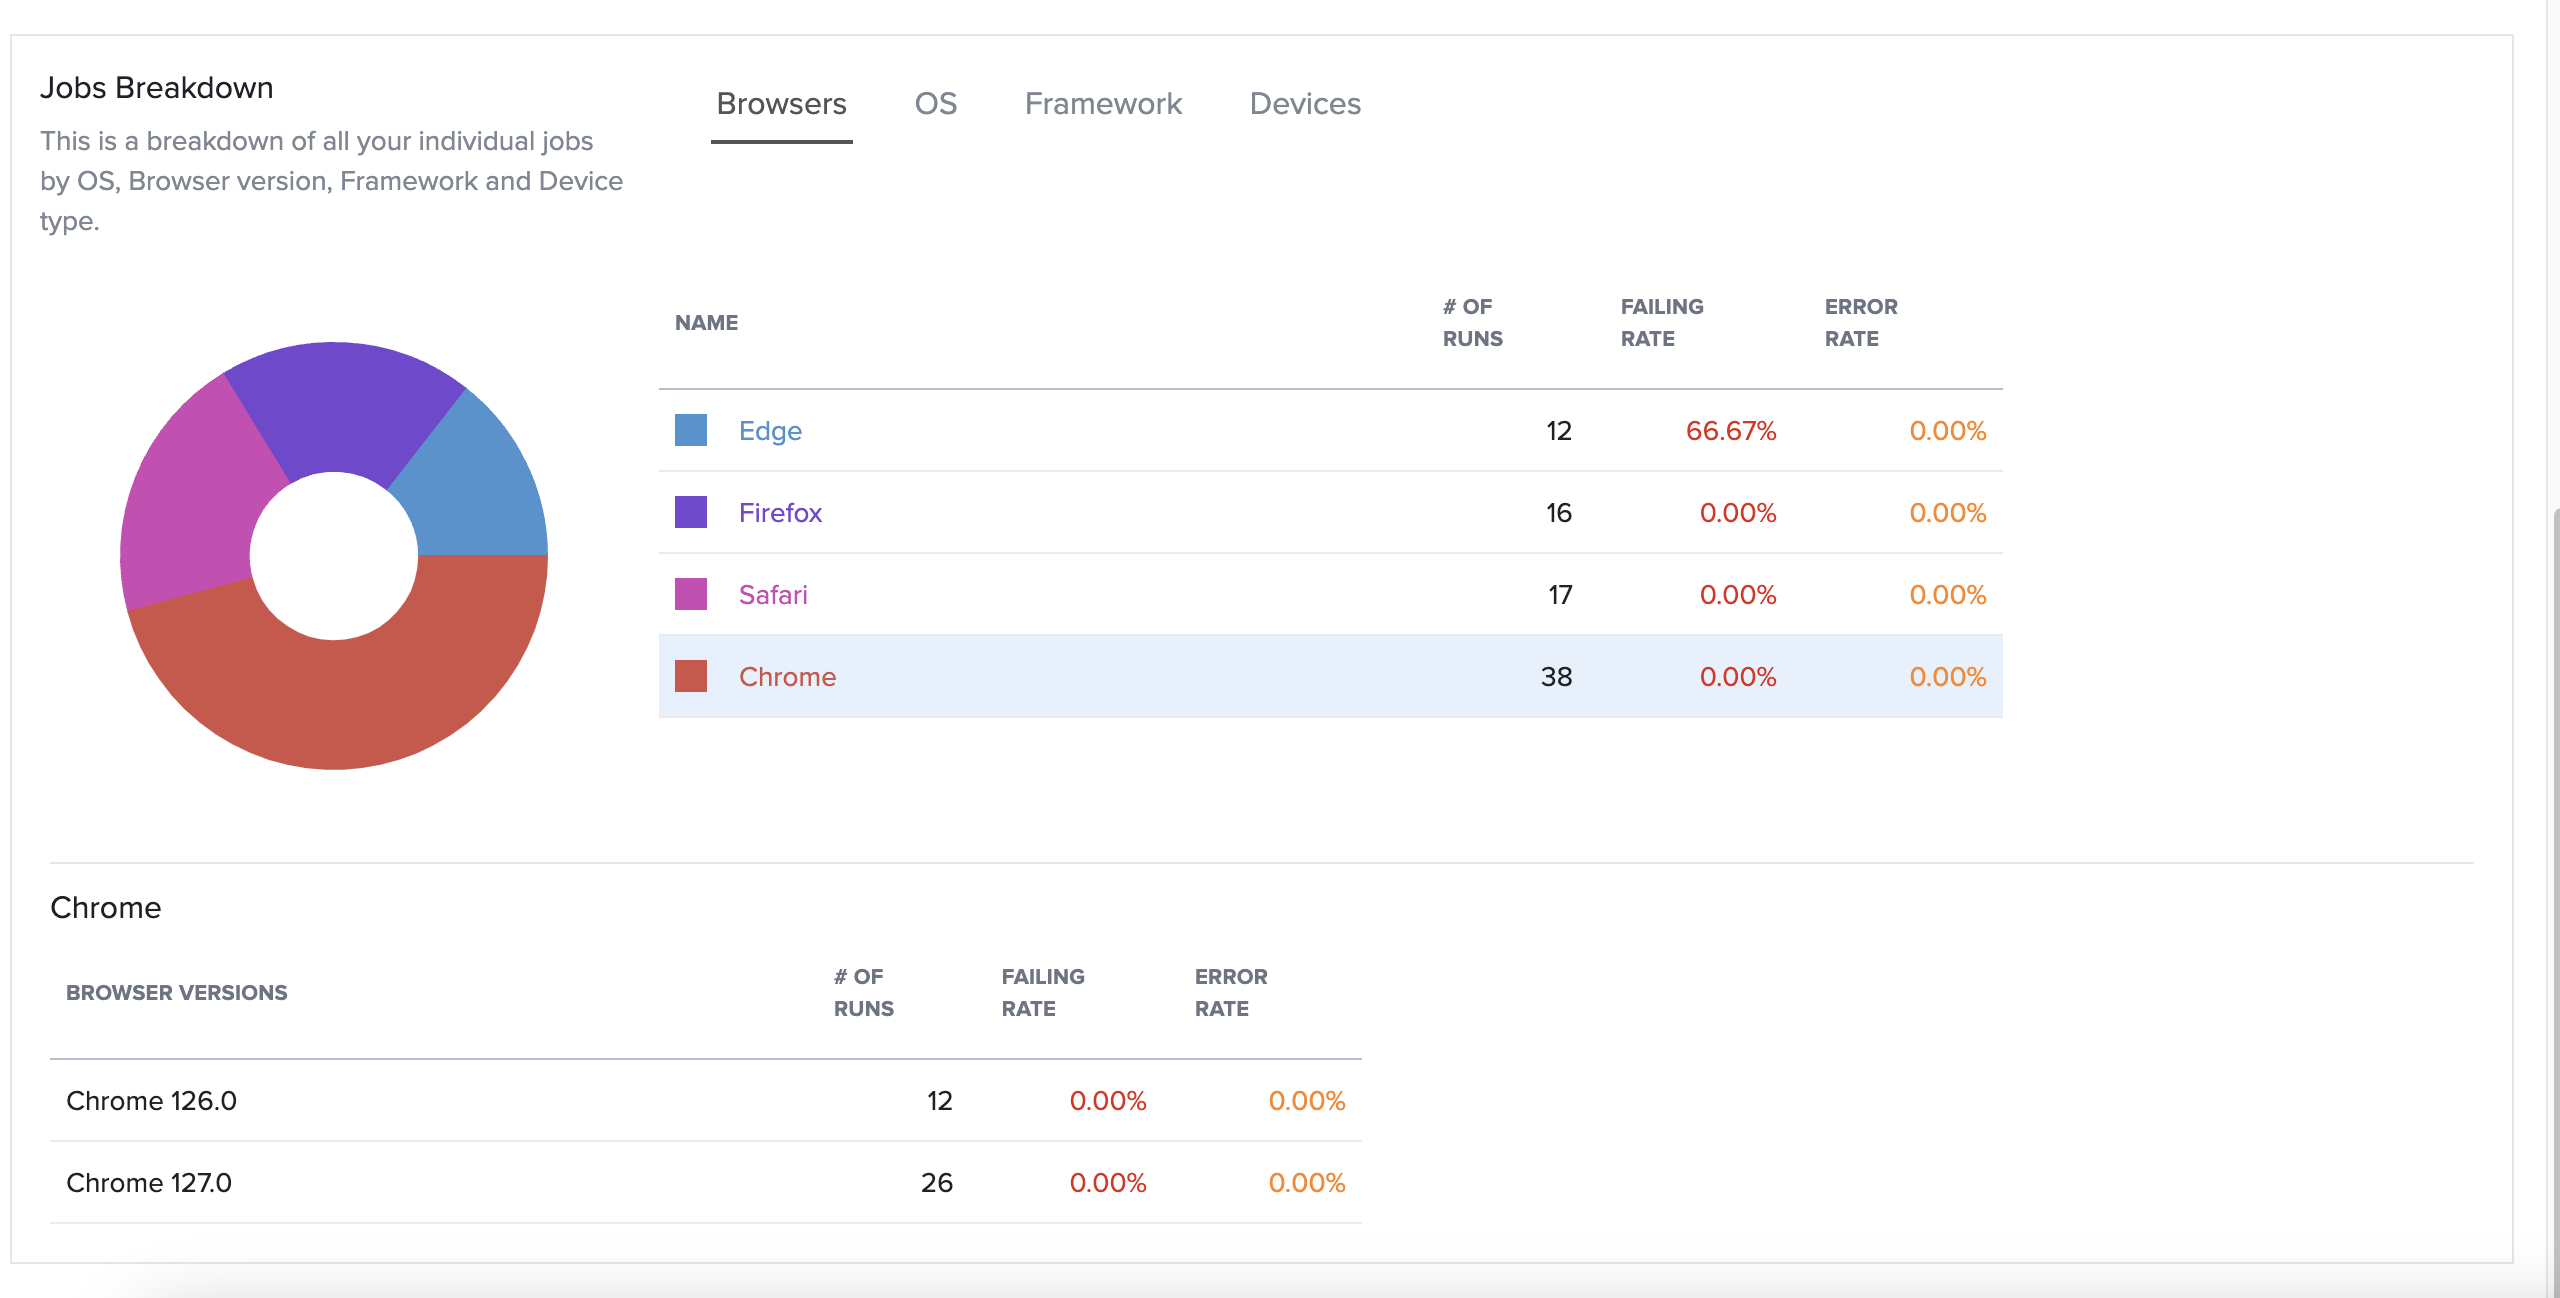
Read more about how your testing strategy might benefit from our Virtual and Real device clouds to ensure proper coverage across your user base.