Add Custom Aggregations
Custom aggregations allow you to add additional metrics to the Explore results. You can use aggregations to analyze error data by attributes such as application version, user, device, or other available attributes.
For example, when errors are grouped by fingerprint, you can add an aggregation to see additional information for each fingerprint, such as the number of unique users affected or the total size of the reported objects.
Add an Aggregation
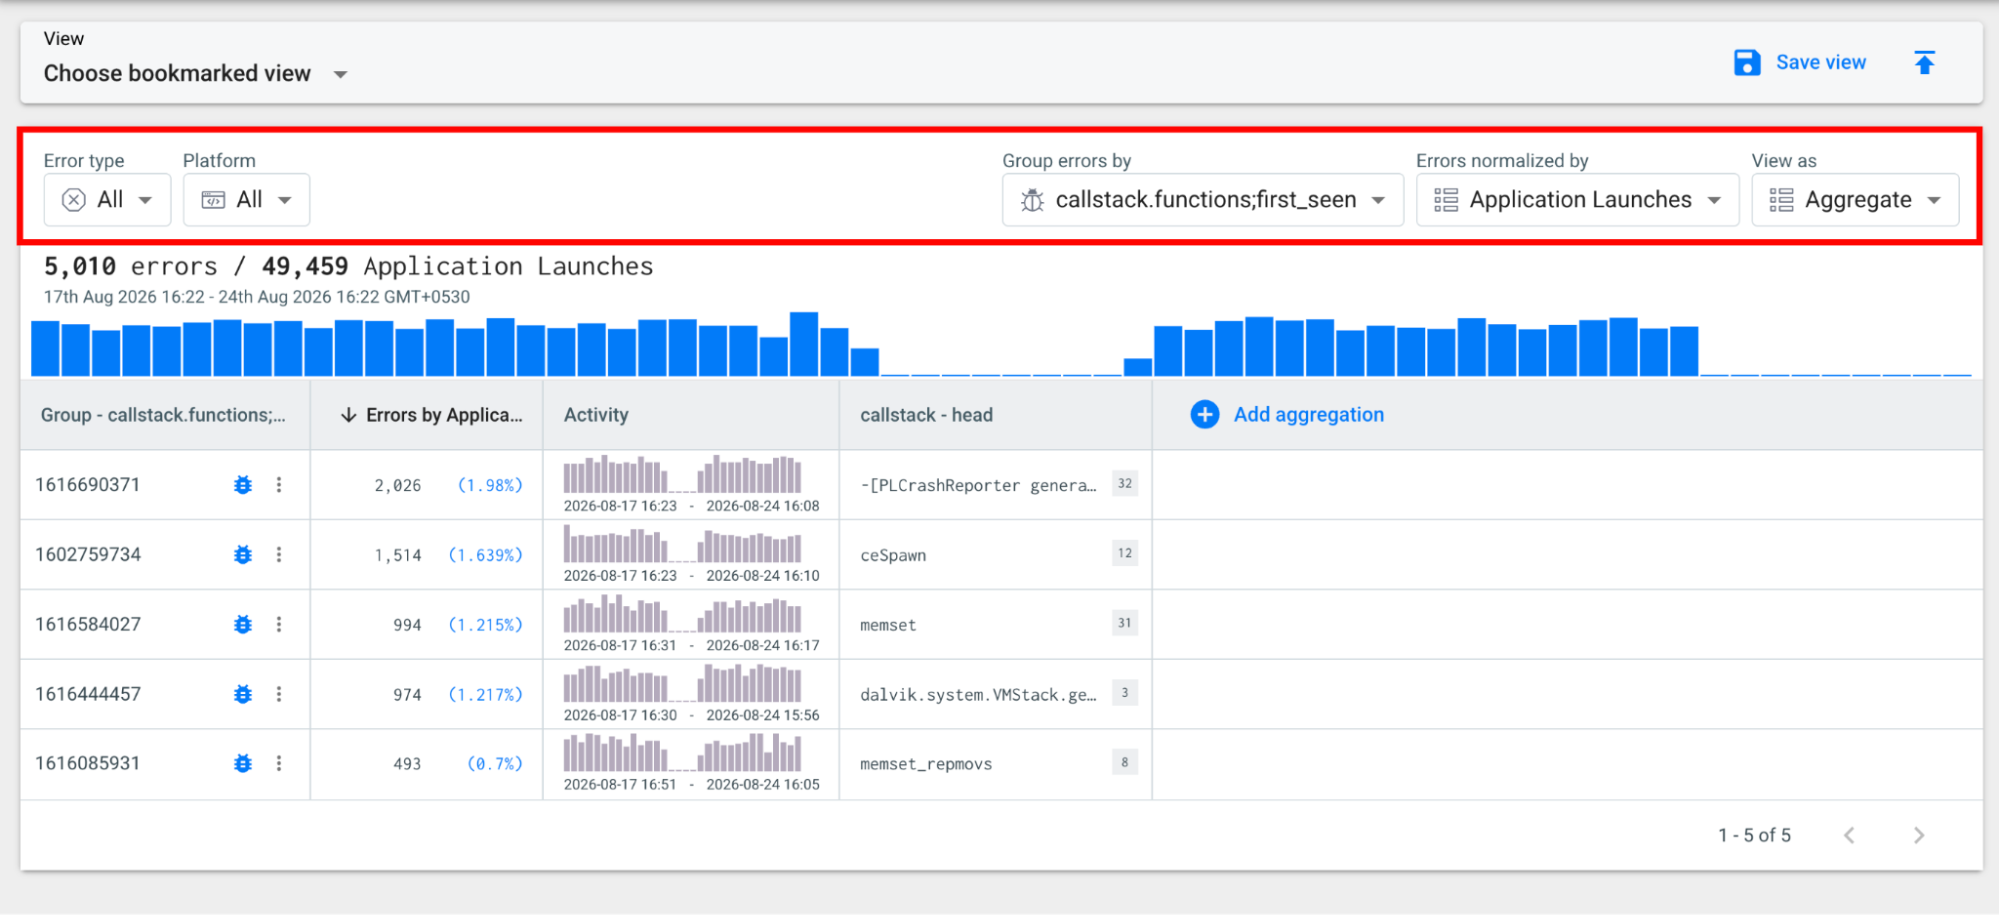
Step 1: Open the Explore view and configure the filters and Group errors by attribute you want to use for your analysis.
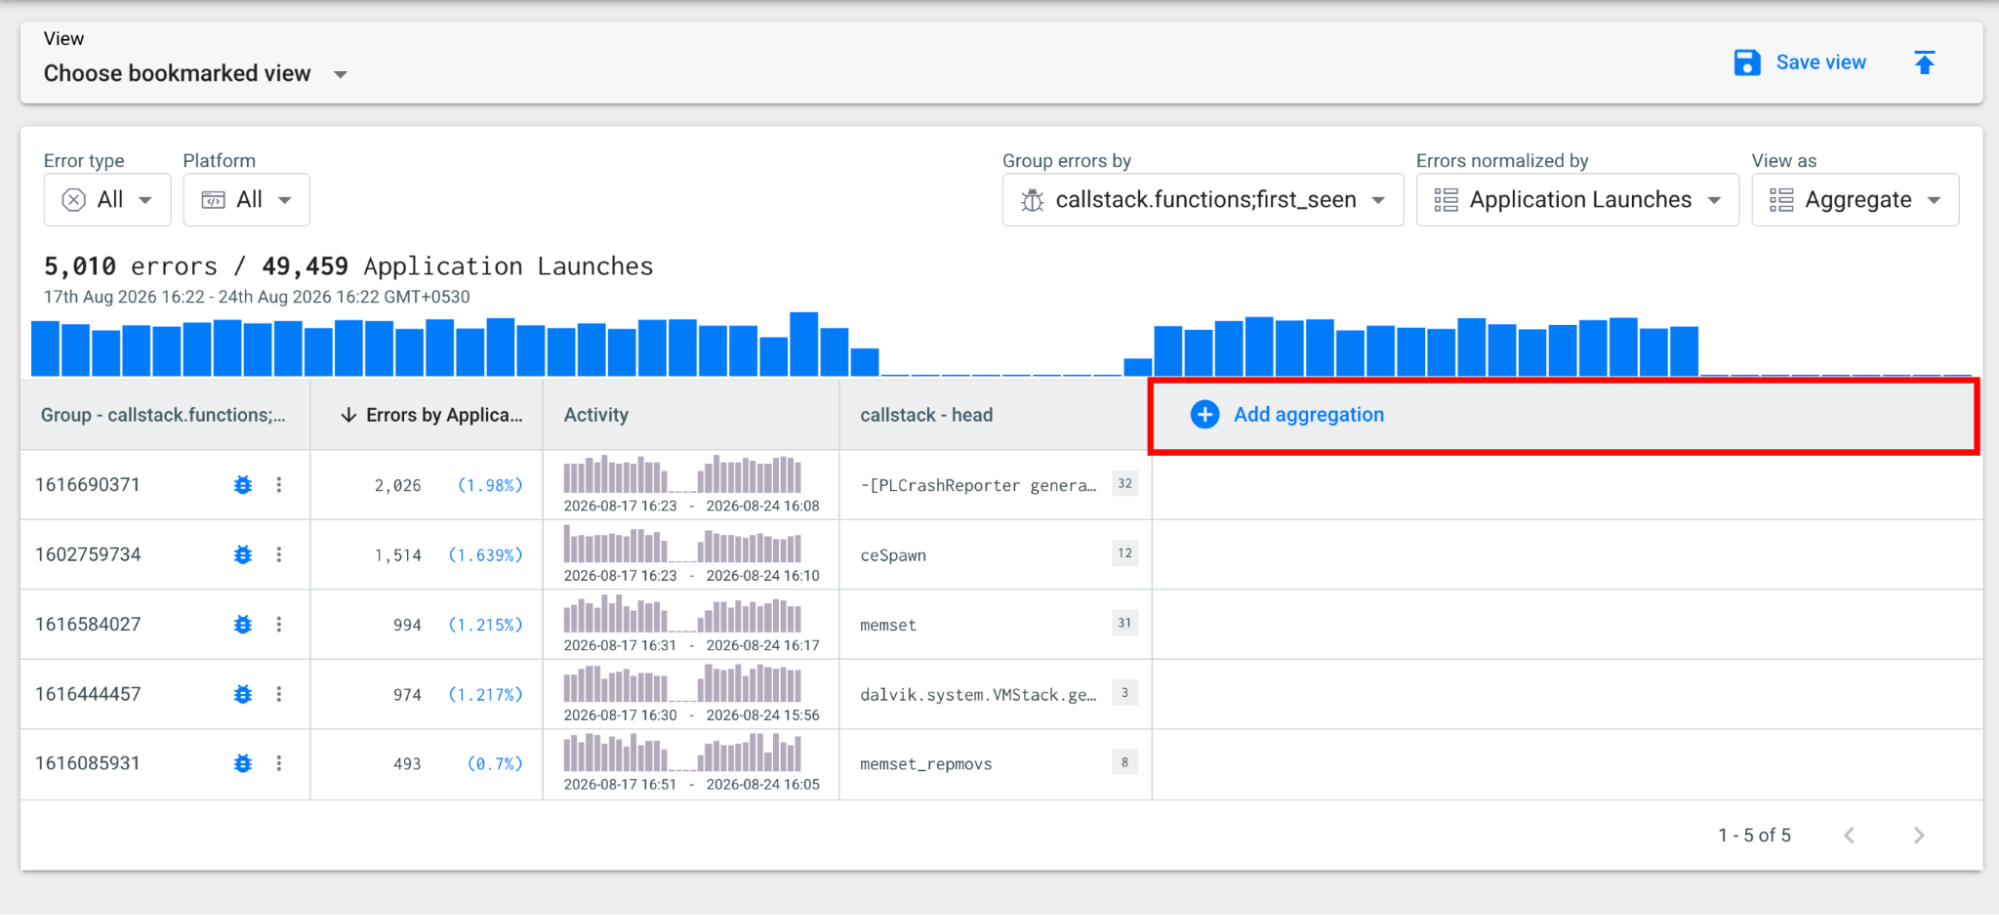
Step 2: Select Add aggregation above the results table.
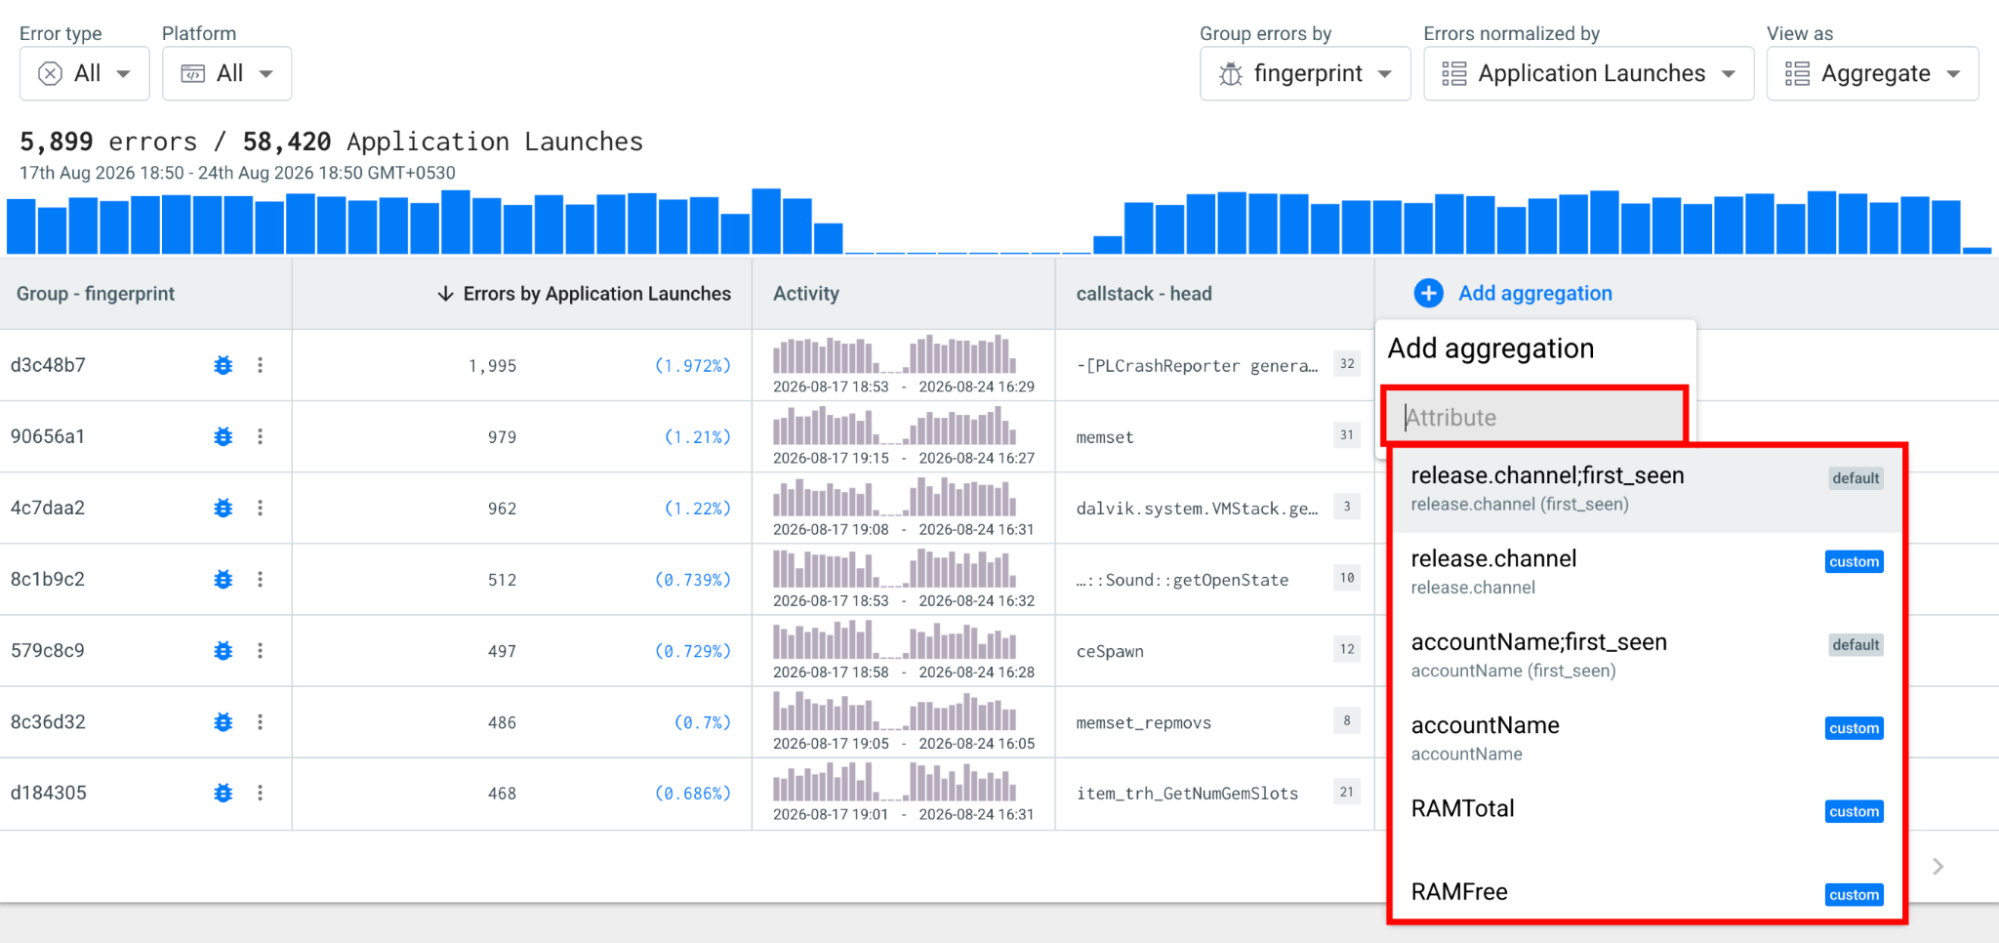
Step 3: In the attribute selector, search for the attribute you want to use for the aggregation and select it from the available results.
Step 4: Select the aggregation function you want to apply to the selected attribute. The available functions depend on the attribute and can include unique, count, sum, min, and max.
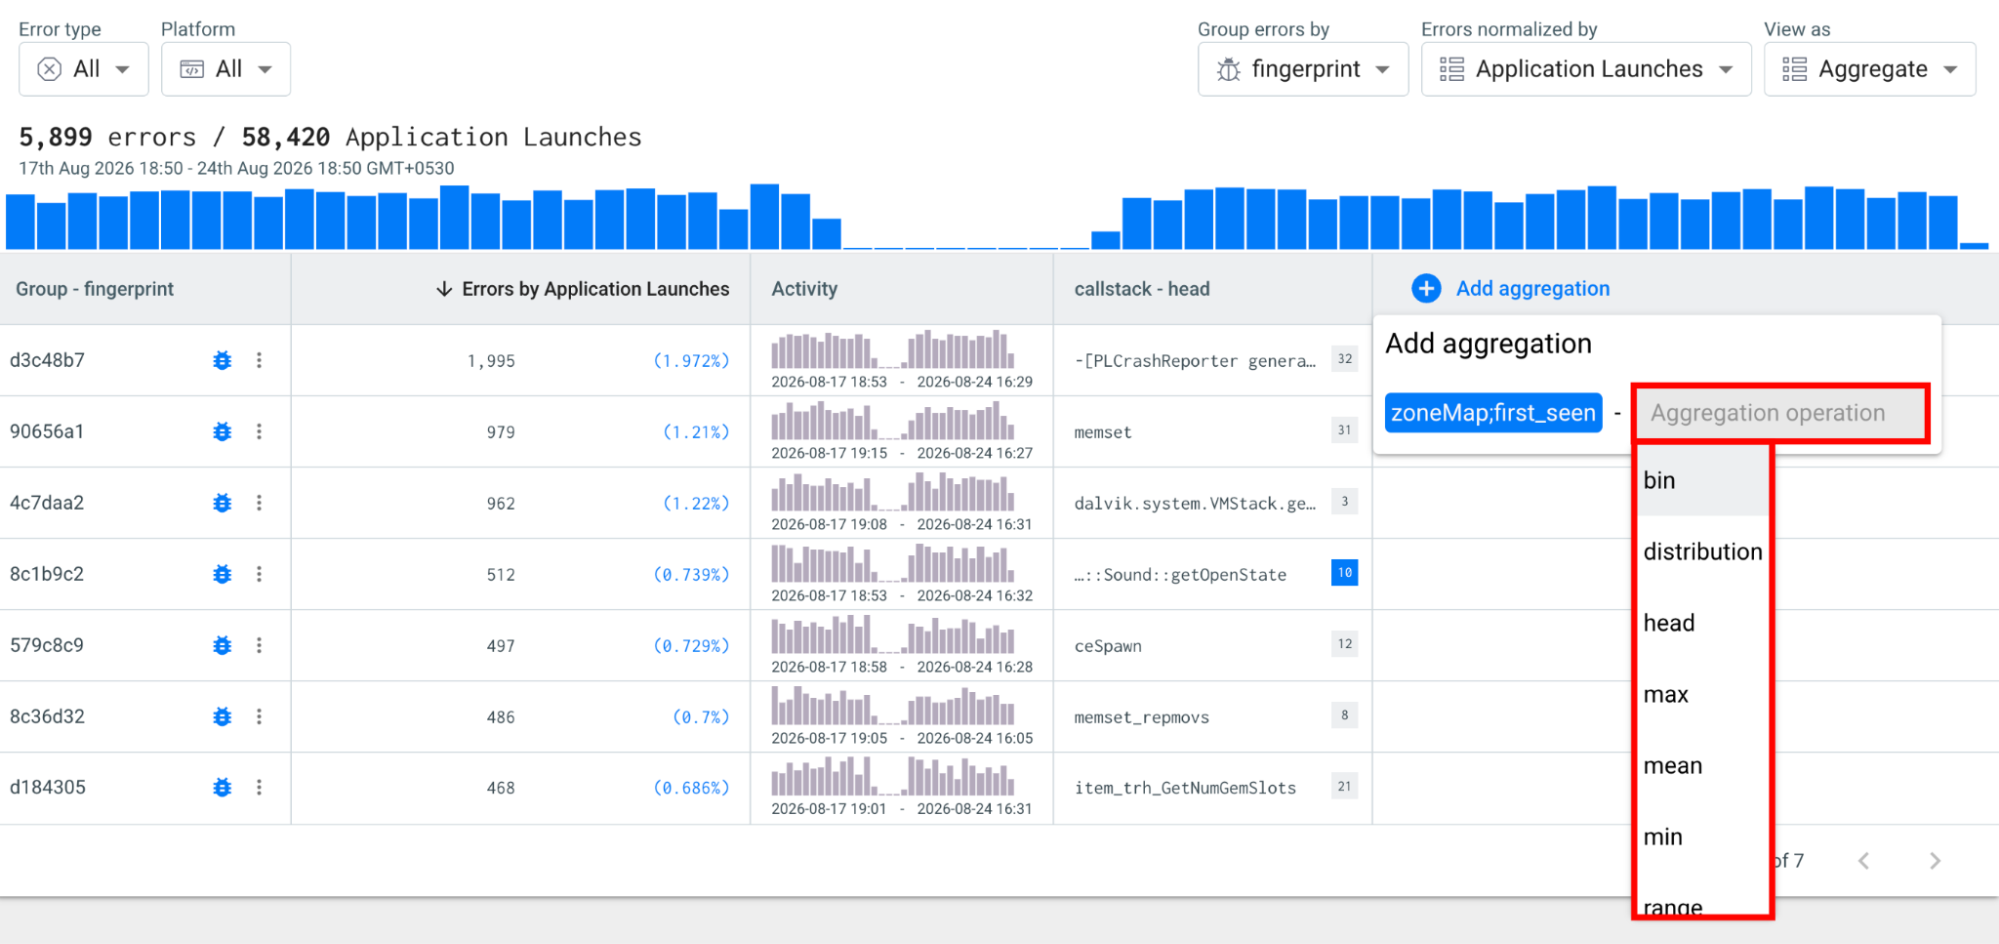
Step 5: Review the new aggregation in the results table. Explore adds the aggregation as a new column and displays the calculated value for each group.
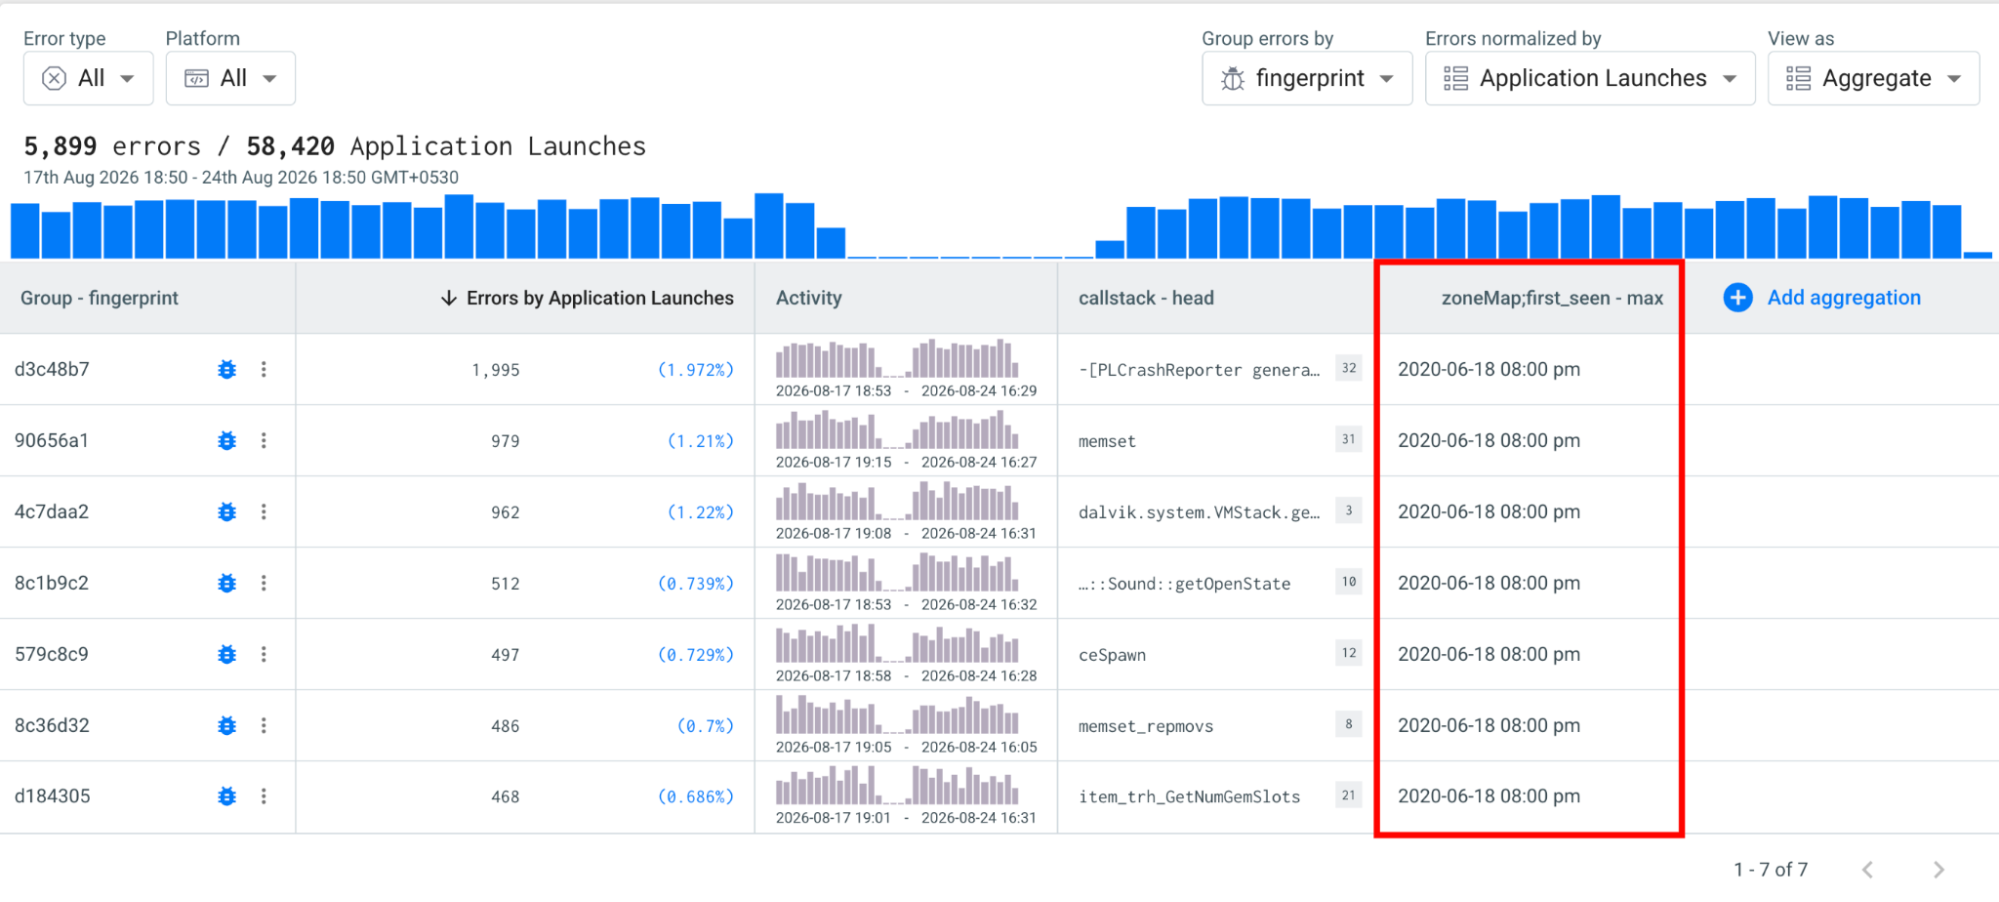
You can add multiple aggregations to analyze different attributes or metrics in the same Explore view.
Examples
Identify High-Storage Fingerprints
You can use aggregations to identify fingerprints that consume a large amount of storage. For example, group errors by fingerprint and add an aggregation for object.size using the sum operator. Sorting the results by the aggregated value helps identify fingerprints with the highest total object size.
This can help you determine whether certain fingerprints contain duplicate objects that may be candidates for cleanup.
Review Historical Storage Usage
You can also use aggregations to estimate historical storage usage. Group the data without a specific attribute and add an aggregation for object.size using the sum operator.
Set the Time frame to cover the period for which you want to review storage usage. The resulting value provides an estimate of the storage consumed during that period and can help you evaluate whether your current storage configuration is sufficient.
Analyze Storage by Application Version
To understand whether storage usage is concentrated around a particular application version, add an application.version filter or aggregation alongside the object.size aggregation.
This allows you to compare storage consumption across versions and identify versions that may be contributing disproportionately to overall usage.
Add Multiple Aggregations
You can add multiple aggregation columns to analyze different aspects of the same error groups. For example, you could group errors by application.version and add aggregations for:
-
Unique users to understand user impact.
-
Unique fingerprints to understand how many distinct issues occur.
-
Last seen to identify when an error was most recently reported.
This allows you to build a more complete view of the errors in each group.
Remove an Aggregation
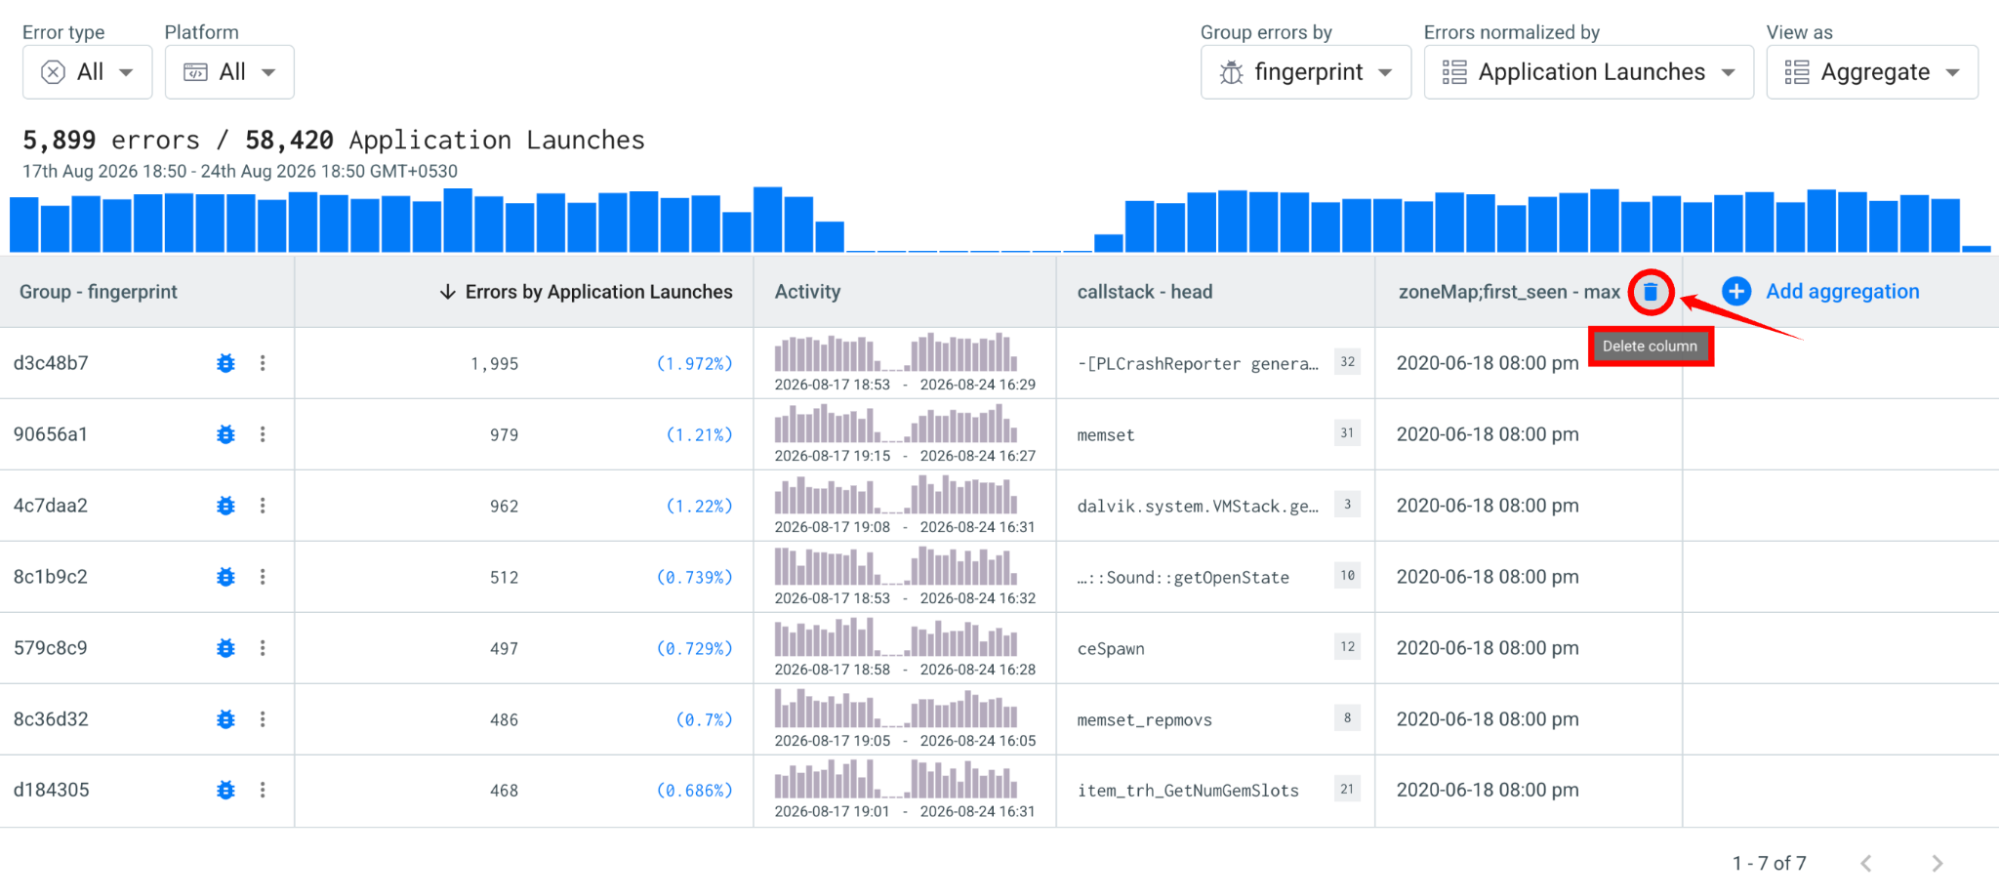
To remove an aggregation from the Explore results, select the Delete column icon in the aggregation column header.
Removing an aggregation only removes the column from the current Explore view; it does not delete the underlying error data.