Normalize Errors by Metric Groups
The Errors normalized by lets you compare error rates against a metric group, such as Sessions Started or Minutes Played. Instead of looking only at the number of errors, normalization helps you understand the proportion of activity affected by errors.
For example, an application version may have more errors because it has more users or sessions. Normalizing errors by a relevant metric helps provide better context when comparing stability across versions.
Metric groups and their associated metrics must be configured before they are available for error normalization. Project Administrators configure metric groups, metrics, and metric data sources under Project Settings → Stability Monitoring.
Normalize Errors by a Metric Group
Step 1: Open Explore from the Error Reporting navigation. The Explore view displays your error data and provides options for grouping and normalizing the results.
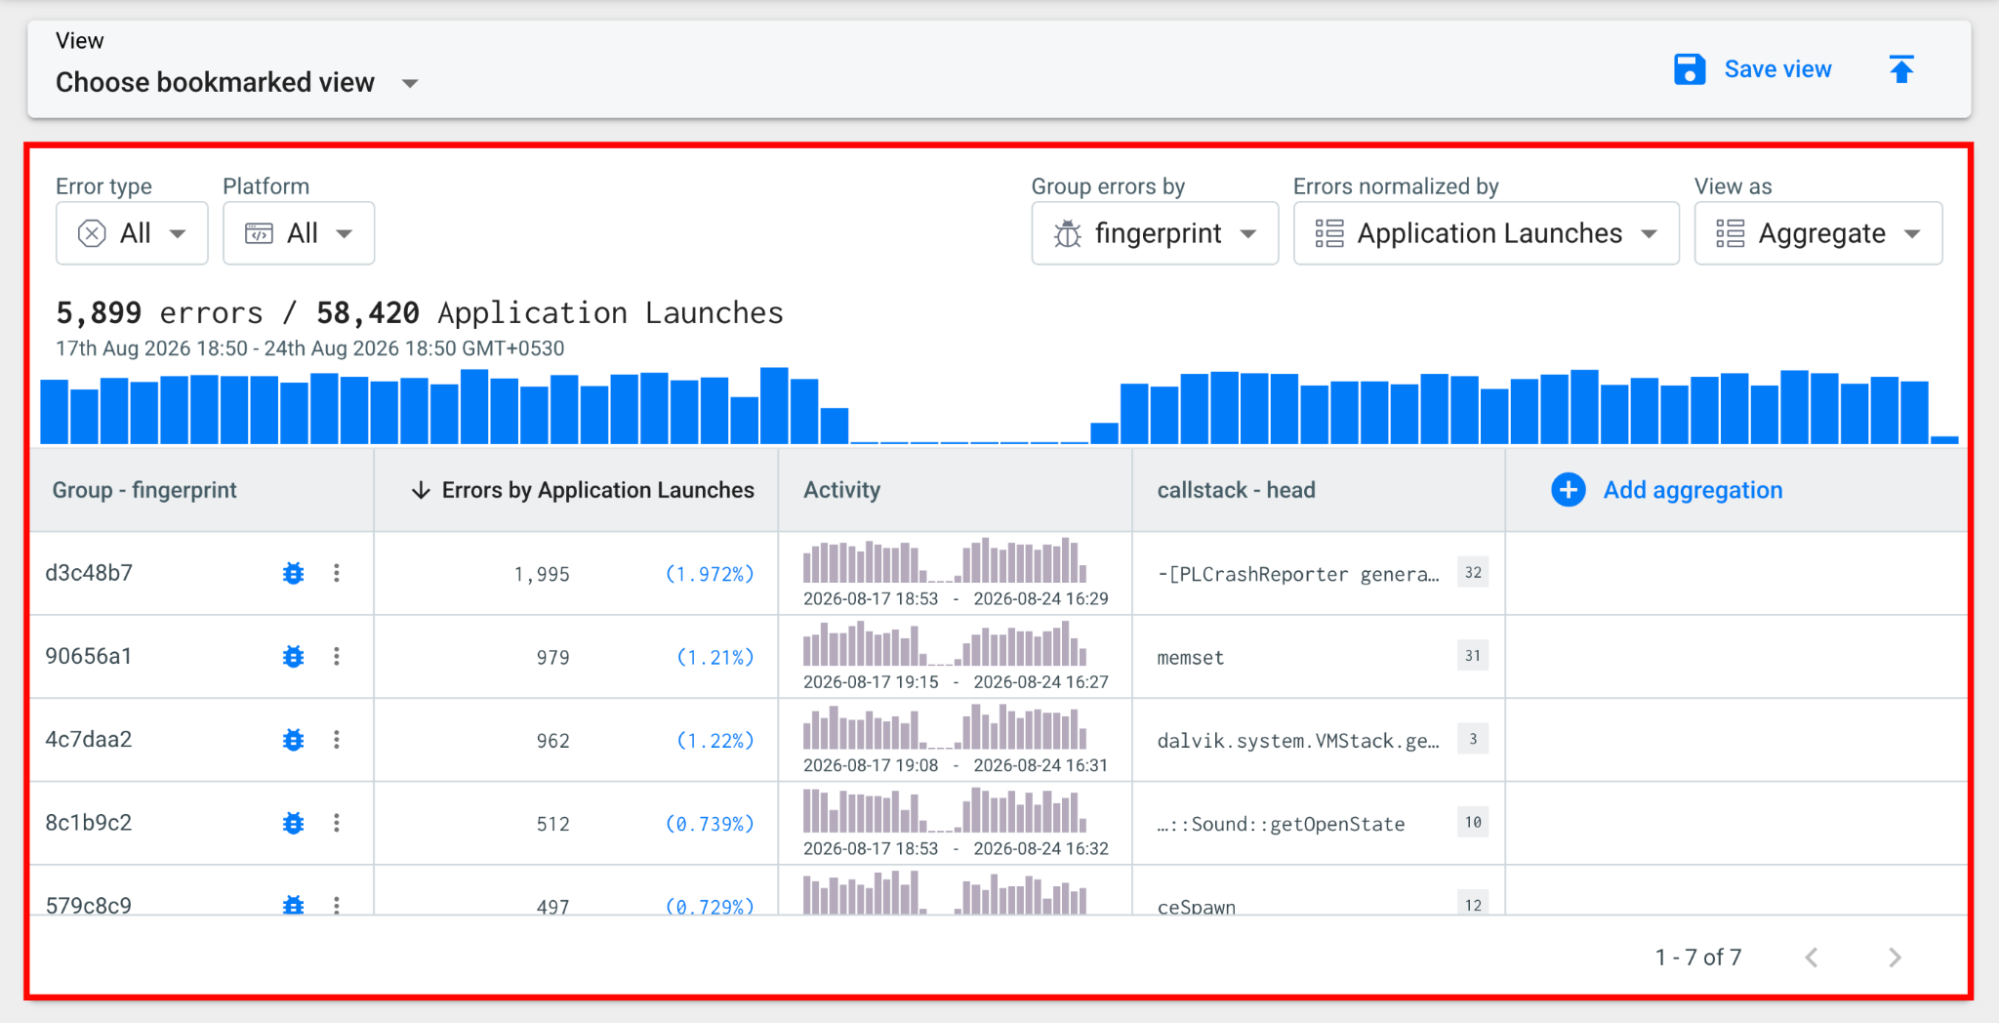
Step 2: From the toolbar, locate Errors normalized by and select the dropdown list.
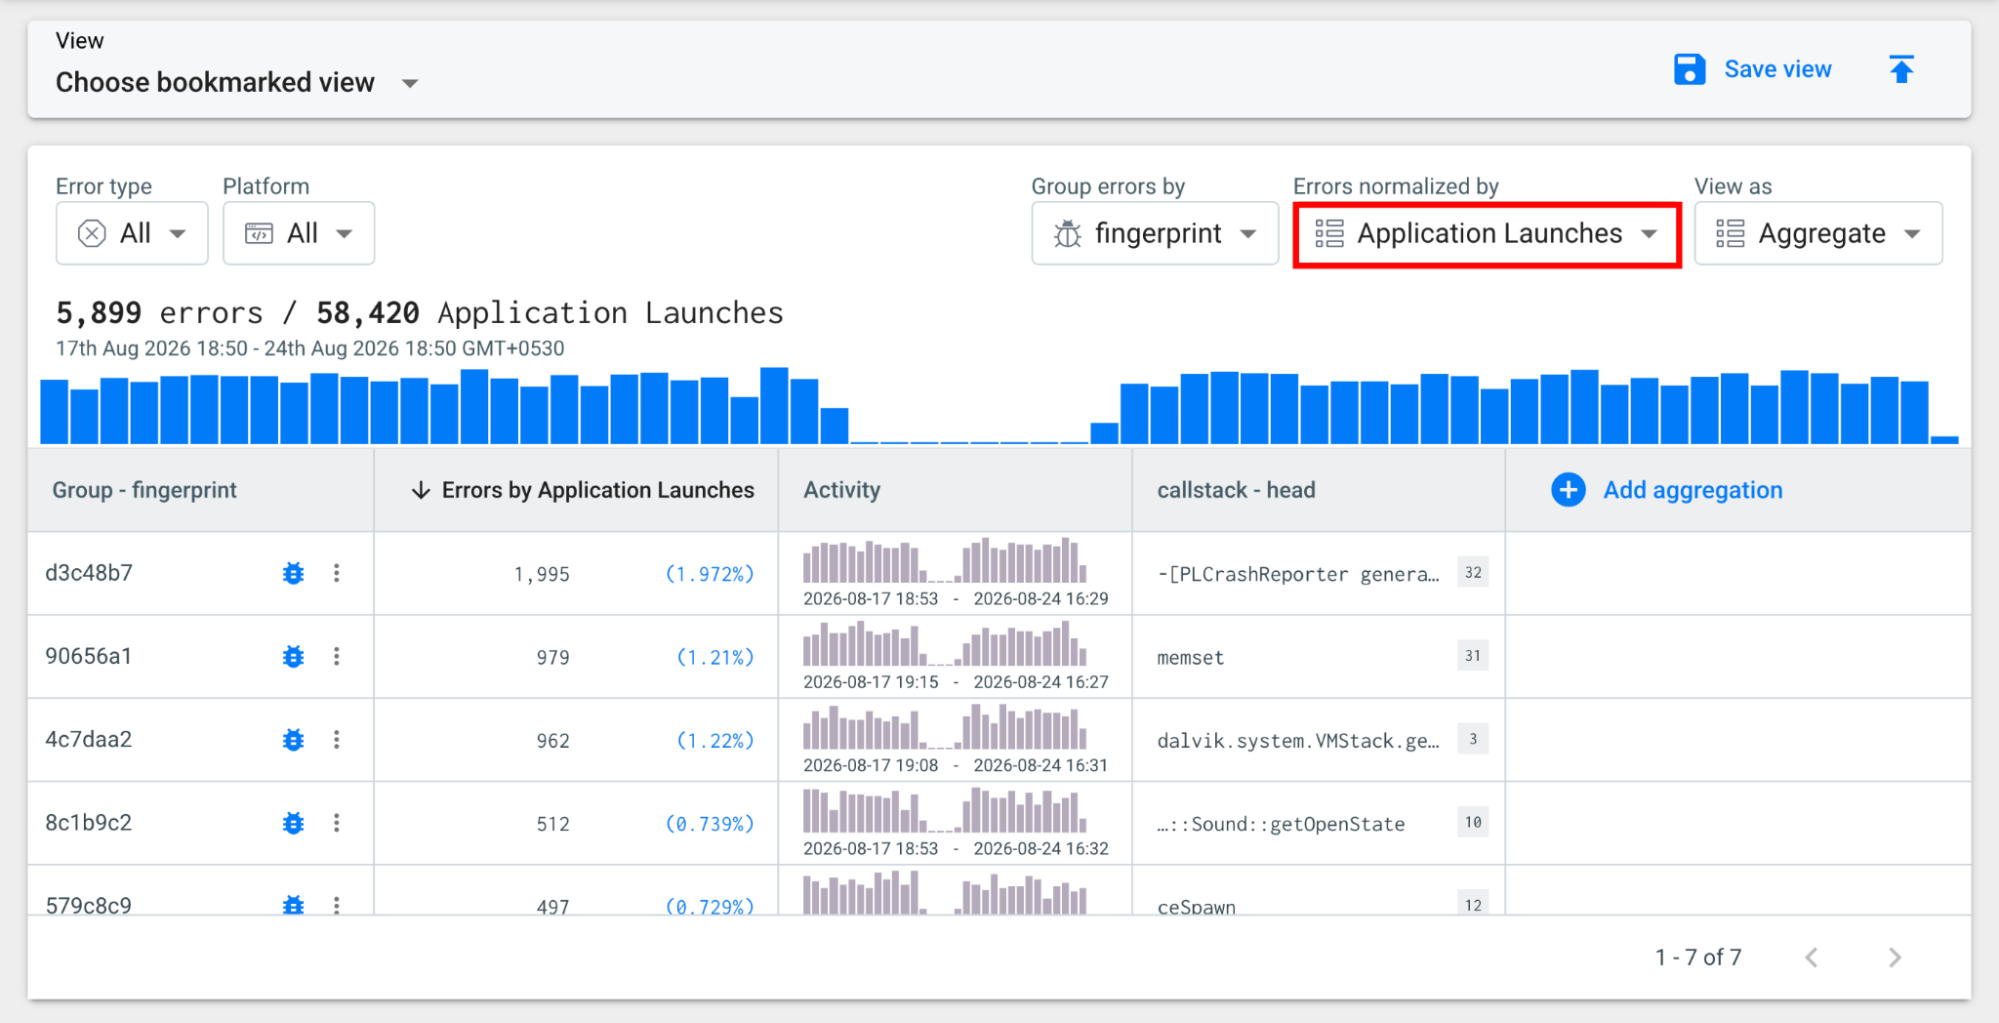
Step 3: Select the metric group you want to use as the normalization baseline. For example, select Application Launches to compare the number of errors against application launch activity.
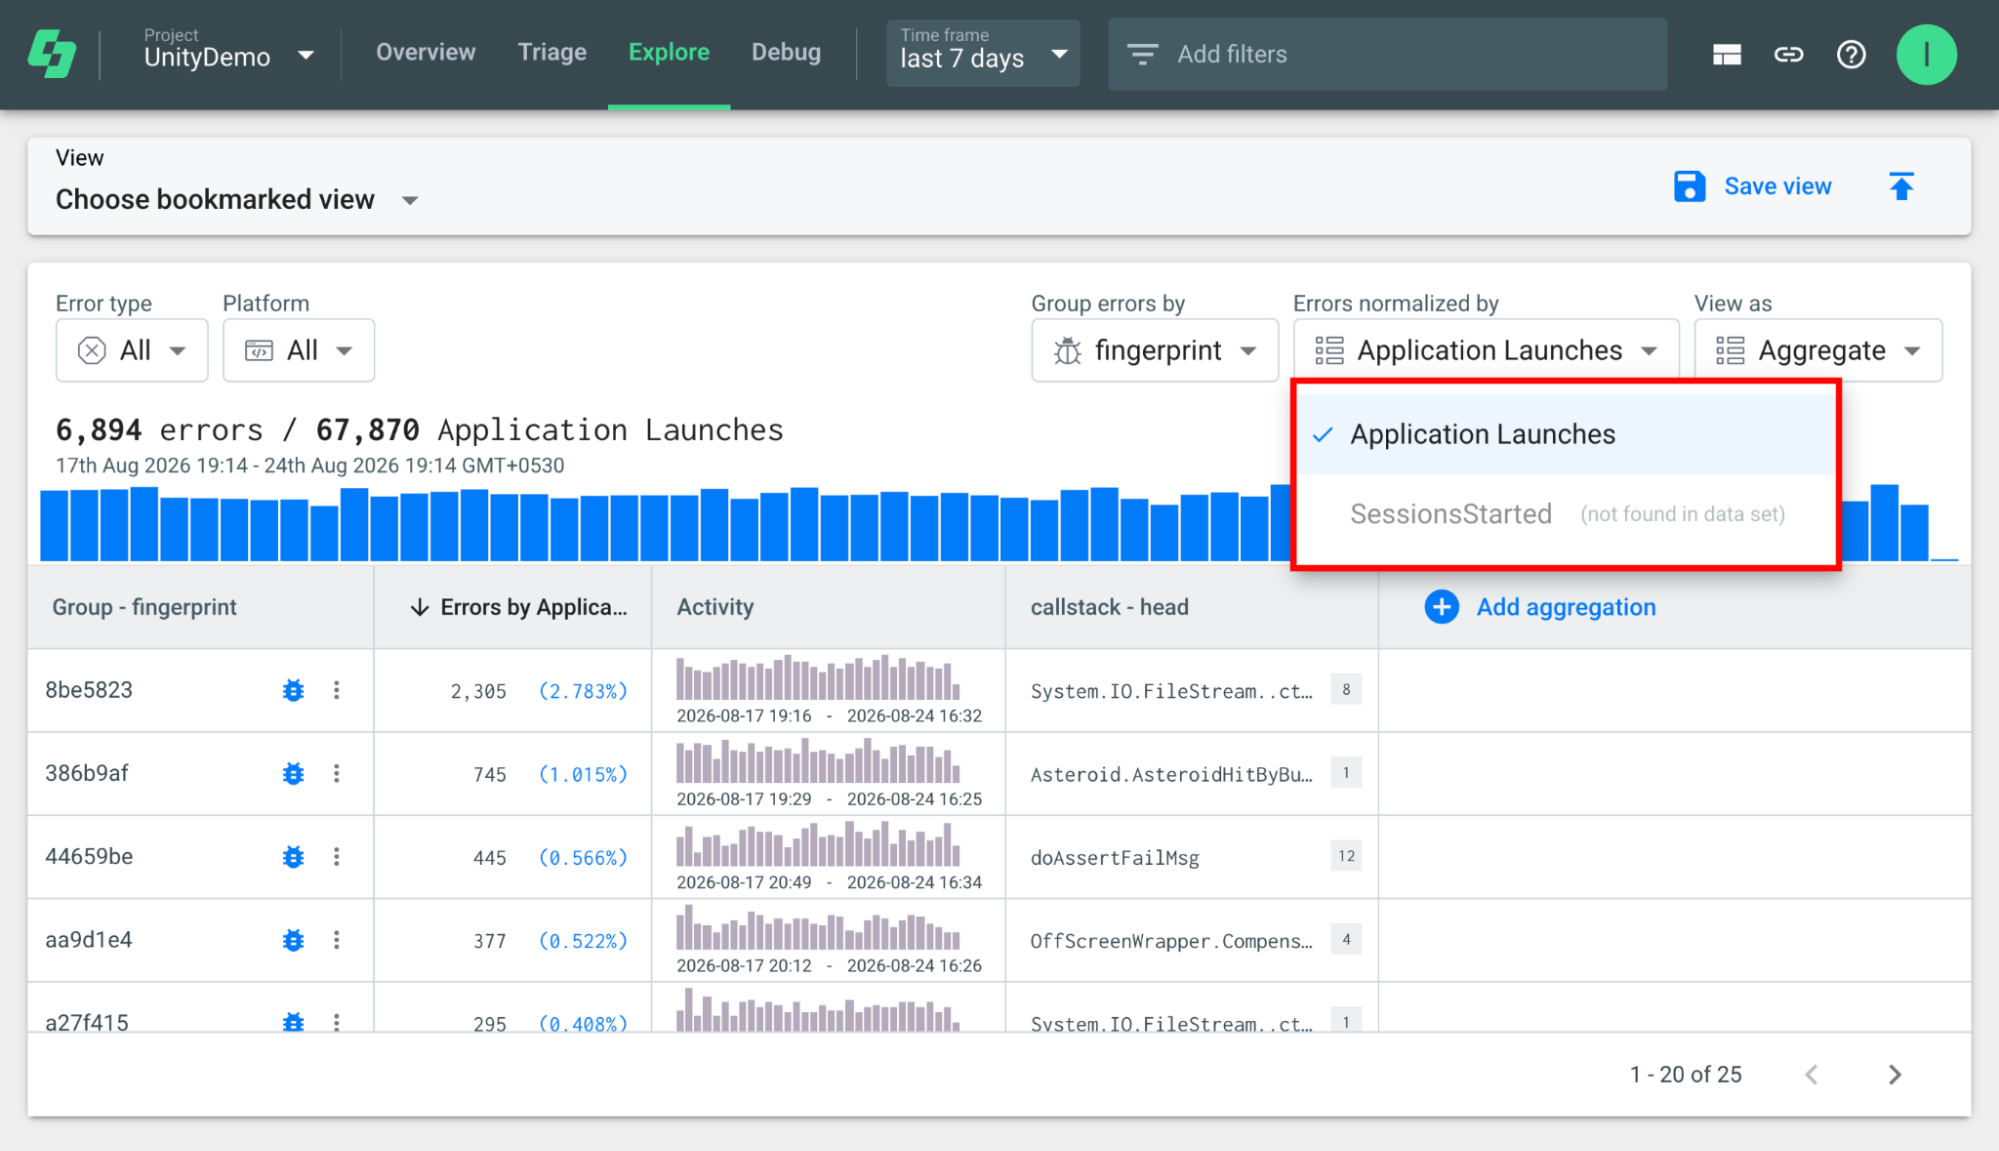
Explore updates the results to show the error data relative to the selected metric group. This allows you to evaluate errors in the context of application activity rather than relying only on the total number of errors.
Use Metric Groups with Group By
Metric normalization is most effective when combined with Group errors by. Grouping lets you compare errors across a specific attribute, while normalization shows the error rate relative to a selected metric group.
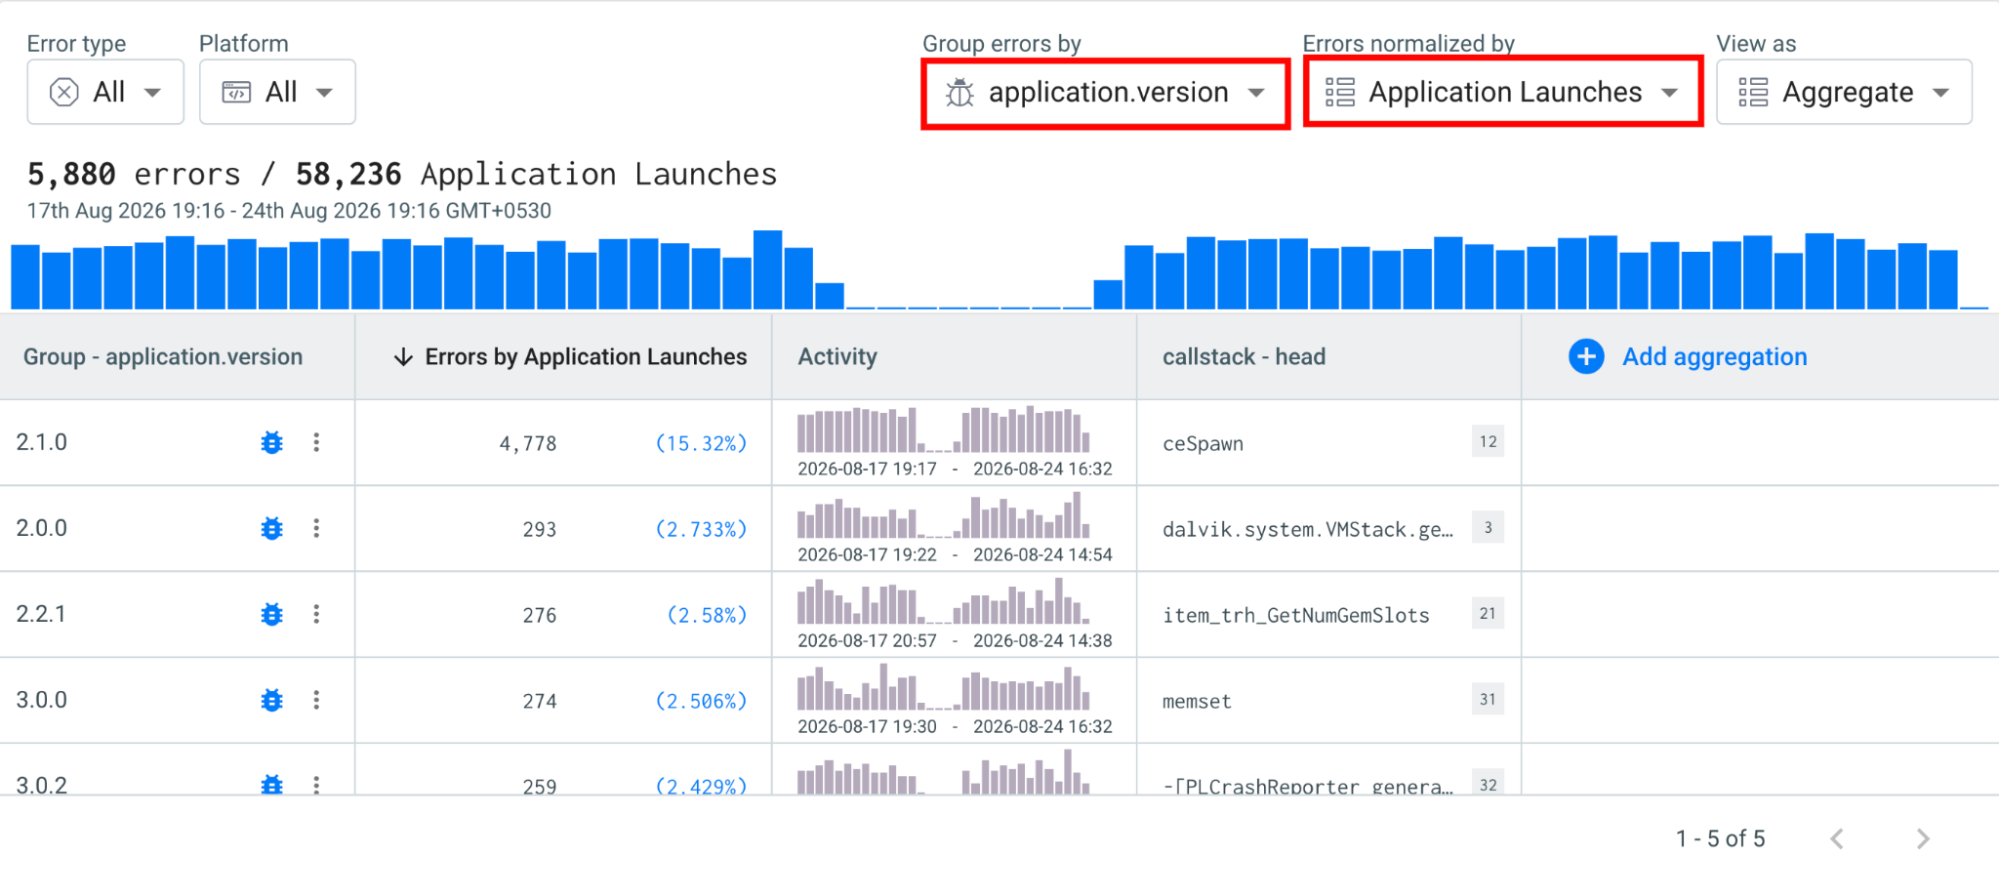
For example, you can group errors by application.version and select Application Launches under Errors normalized by. Explore then displays the number of errors for each application version along with the percentage of errors relative to application launches.
Example: Compare Application Versions
Suppose you want to compare error rates across different application versions using Application Launches as the normalization metric. In Explore, group errors by application.version and select Application Launches under Errors normalized by.
| Application Version | Errors | Errors by Application Launches |
|---|---|---|
| 2.1.0 | 4,778 | 15.32% |
| 2.0.0 | 293 | 2.73% |
| 2.2.1 | 276 | 2.58% |
| 3.0.0 | 274 | 2.51% |
| 3.0.2 | 259 | 2.43% |
In this example, version 2.1.0 has the highest number of errors, with 4,778 errors, and also has the highest normalized error rate at 15.32%. In comparison, version 2.0.0 has 293 errors and a normalized error rate of 2.73%.
Using Application Launches as the normalization metric provides additional context when comparing application versions. Rather than looking only at the total number of errors, you can see how the errors relate to the level of application activity for each version.