Metric Export and External Dashboards
Teams want to incorporate error and crash data that Backtrace collects into their central dashboard systems that are designed to allow for generic monitoring, time-series data analysis, custom visualizations, alarms and alerts. Backtrace Metric Export allows admins to support this, by defining hierarchal groupings of time-series metrics that can be pushed or pulled to systems like Circonus, Datadog, Graphite, Grafana, Prometheus, and InfluxDB.
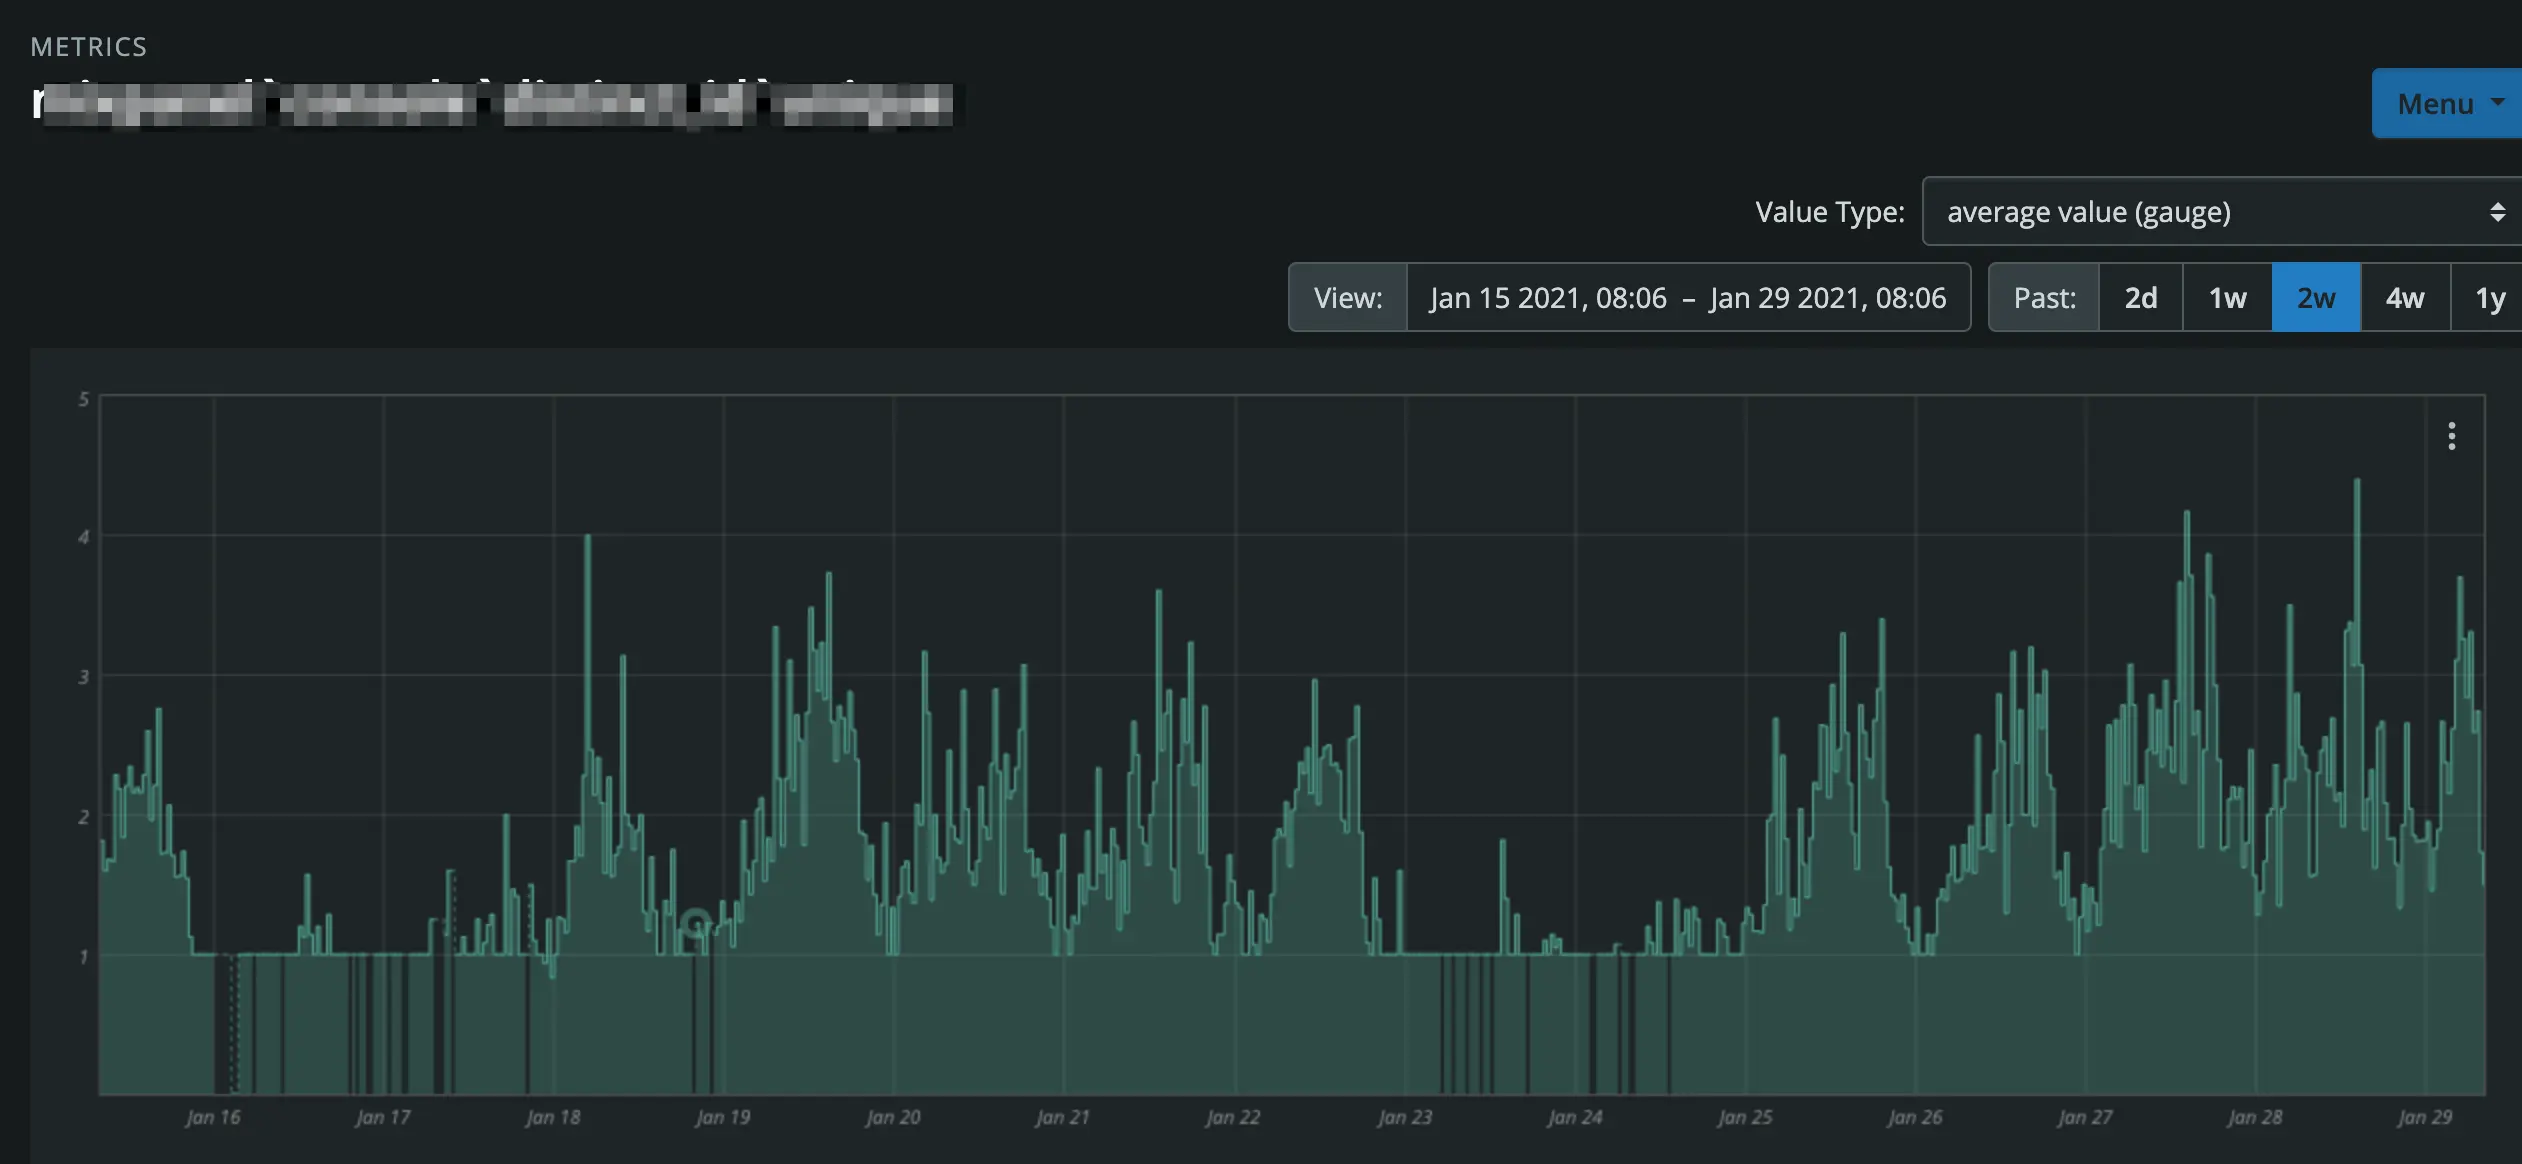
Below, you can see an example of Backtrace data (number of incoming errors for a project) being exported as a timed metric to a Circonus dashboard system once a minute. In this chart, the average number of errors seen for project are displayed and available for different time windows.
To use the Metric Export feature, a Project Admin user needs to define:
- Metric Sets, which are collections of different Metrics that will be shared with one of more Metric Stores.
- Metrics, each defined as an aggregate query in Backtrace with scalar values (i.e. unique or count or min or max) in the results.
- Metric Stores, that Backtrace will share metric information with. Metric Sets are associated with one or more Metrics Stores.
This guide will show admin users how to use the Backtrace UI to define Metric Sets and Metrics, configure Metric Stores, and guide you to documentation of supported third party systems so you can further configure those integrations.
Metrics Stores
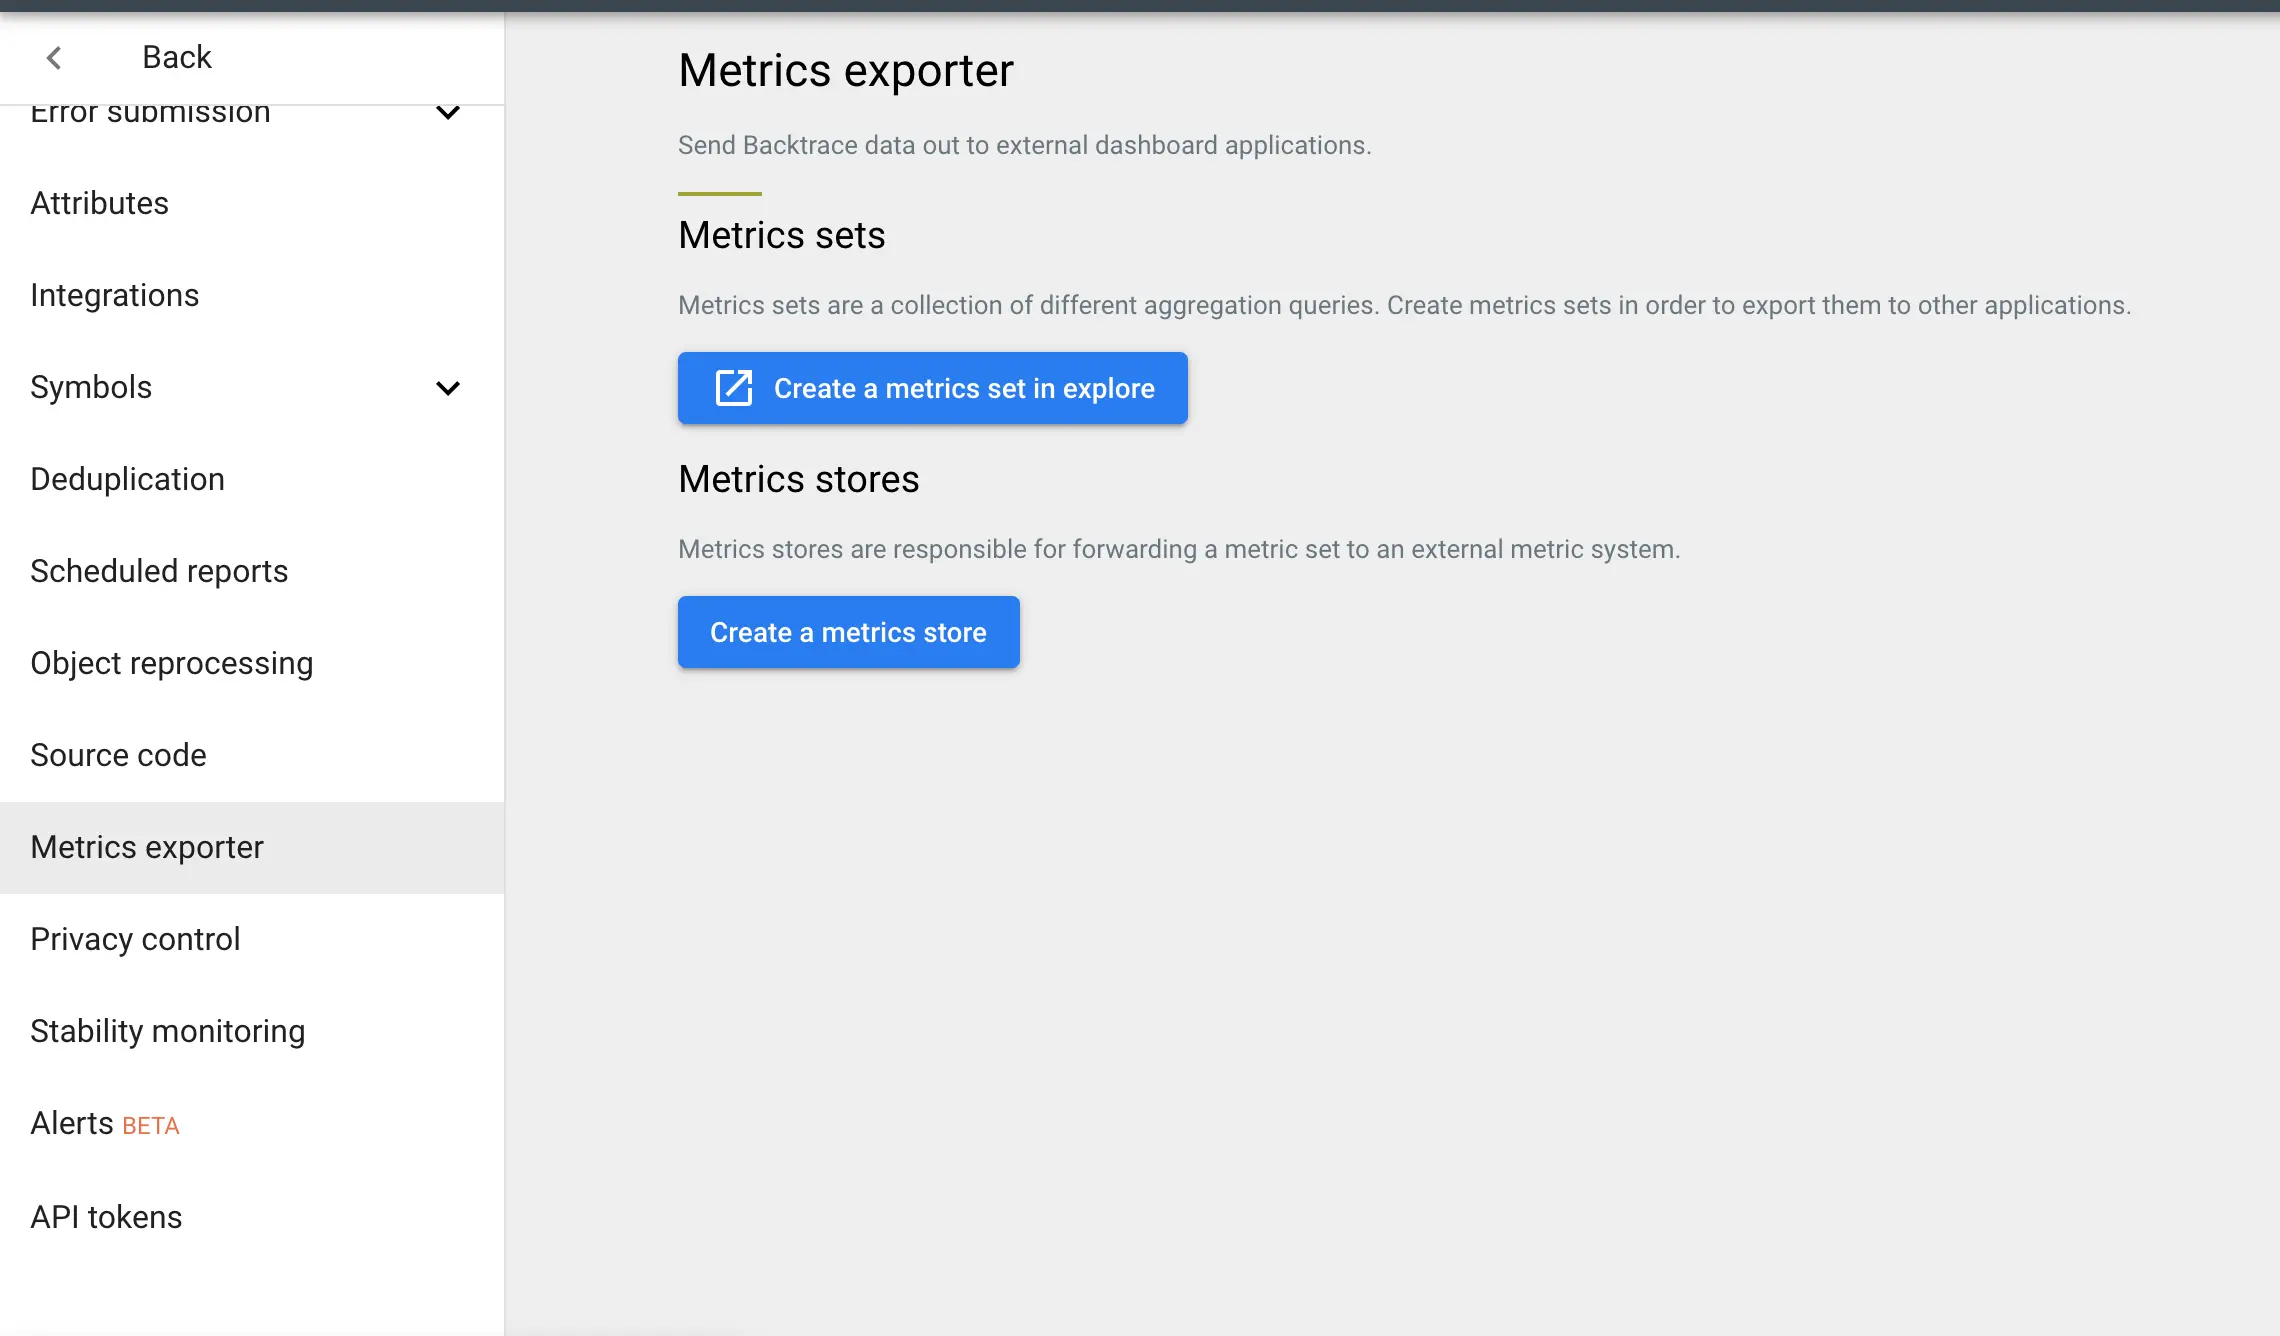
Click on Project Settings > Metric Export to manage Metrics Sets and Metrics Stores.
In this section, we will describe how to create Metric Sets and Metrics, and how to create and manage Metric Stores that you will share information with your third party systems.
Metric Sets and Metrics
Metric Sets are containers used for grouping various Metrics together. Metric Sets can be connected to one or more Metric Stores. Metrics are created by defining the query in the Backtrace Explore view and using the 'Export As Metric' function. Click the 'Create a Metric set in Explore' to get started.
In the Backtrace's Explore view, create a query that mimics the shape the metrics you want to push to your dashboards. Make use of Filters, Group By, and Aggregates that generate scalar values (i.e. count, unique, min, max, sum, first, last).
NOTE - Backtrace will ignore the Time Frame when creating the metric, and allow you to preview the type of data that will be sent in the metric on a regular basis (i.e. once a minute).
Common examples of Metrics
- Number of errors
- Group by None, Add Aggregate "_tx - unique"
- _tx is an attribute that identifies the individual error submitted to Backtrace. By calculating an Aggregate unique _tx, we can share how many unique txids, or individual errors were submitted.
- Number of error and number of impacted users (or devices)
- Group by None, Add Aggregate "_tx - unique" and "guid - unique"
- guid is an attribute that identifies an individual user or device submitting an error to Backtrace. By adding an Aggregate unique guid, we can share how many unique users or devices were impacted by submitted errors.
- Number of errors by fingerprint
- Group by Fingerprint, Add Aggregate "_tx - unique"
- Group by fingerprint allows Backtrace to share the unique number of errors received for each fingerprint.
- Number of errors and number of impacted users by app.version
- Group by app.version, Add Aggregate "_tx - unique" and "guid - unique"
- Group by app.version allows Backtrace to share the unique number of errors and users/devices impacted for each version of the game.
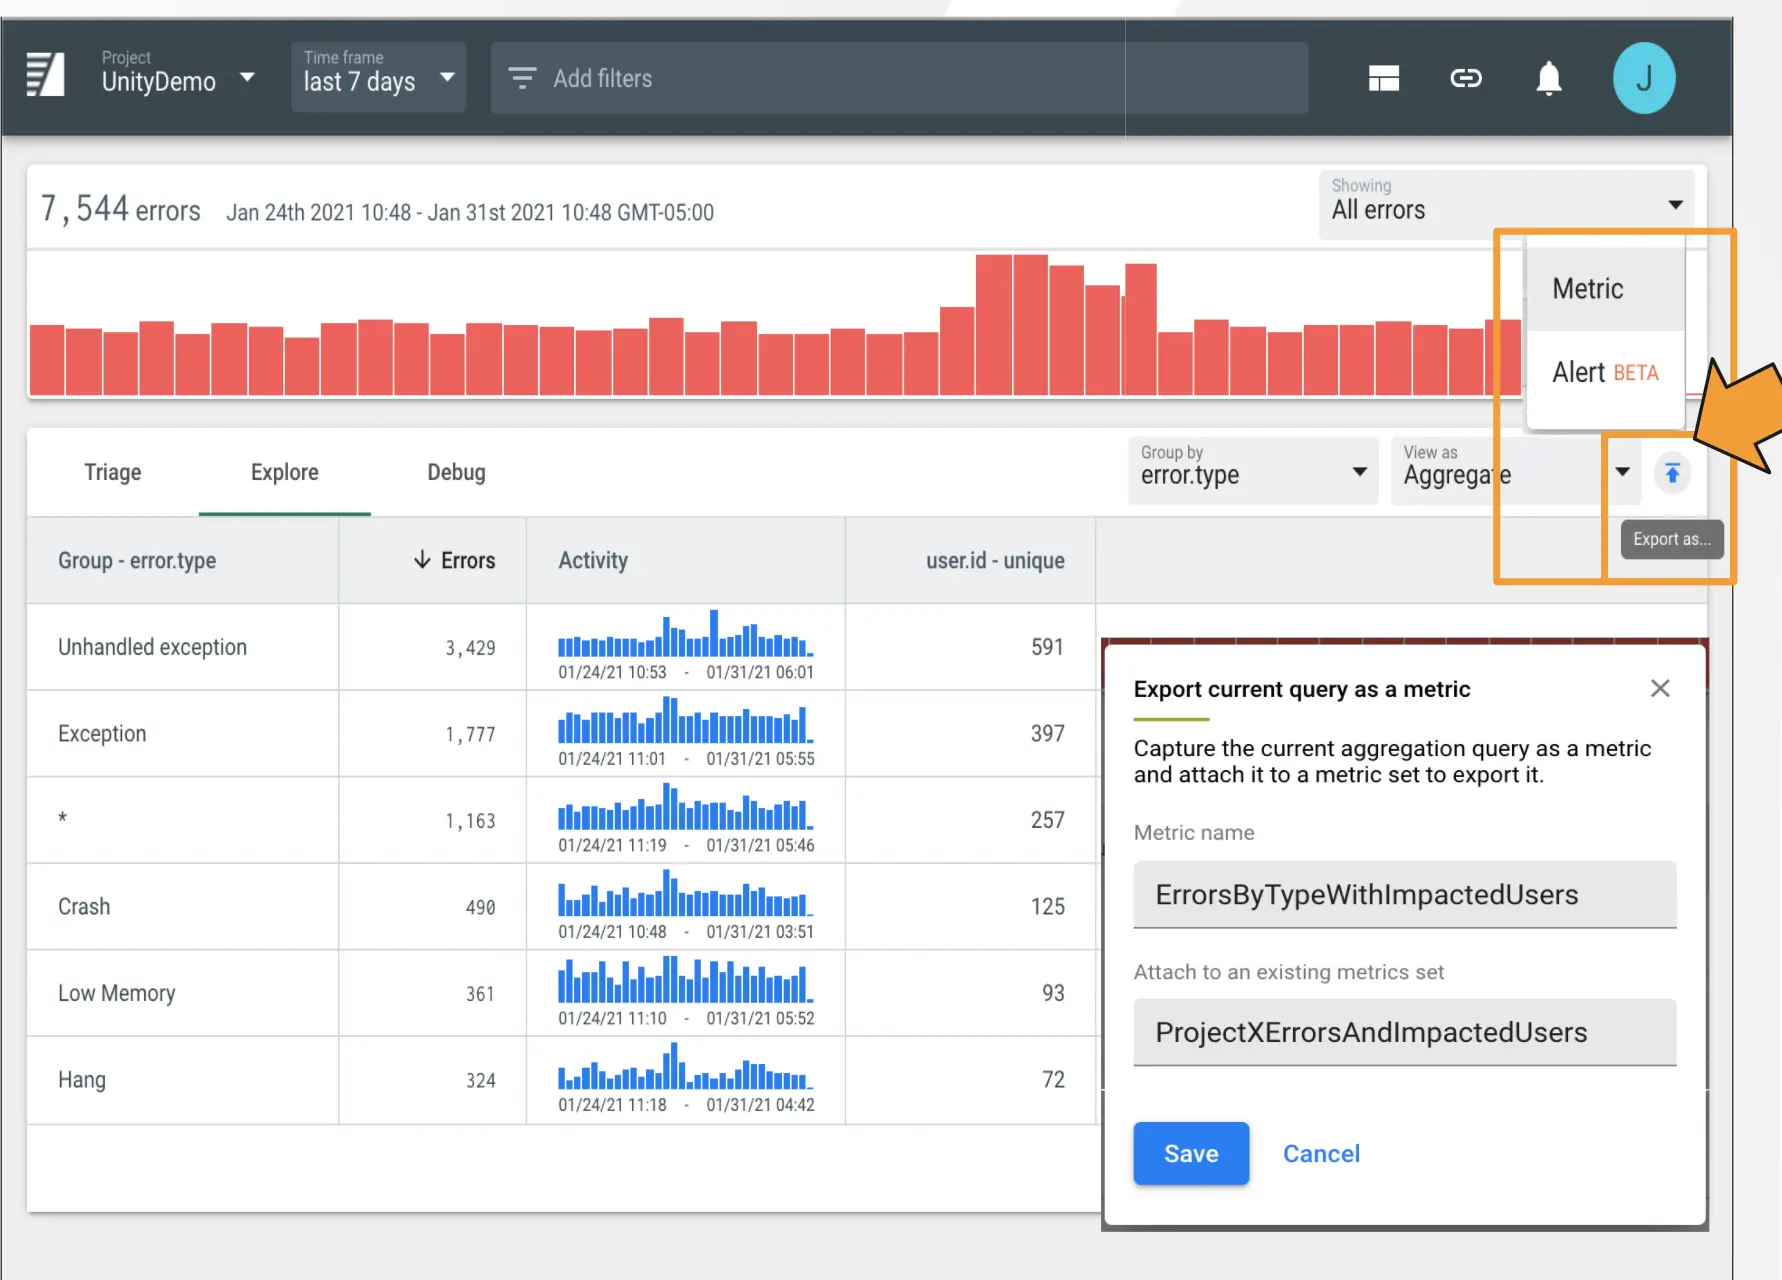
See an example below where we use Explore to group by error.type and aggregate user.id-unique, to share how many users were impacted by each error.type. Use the "Export As" button on the right to Export the query as a Metric. Provide a name that identifies the Metric and save it within a Metric Set (or create a new one). In a subsequent step, we will create Metric Stores that will be associate to gather the Metrics with a Metric Set on a scheduled basis (i.e. once a minute).
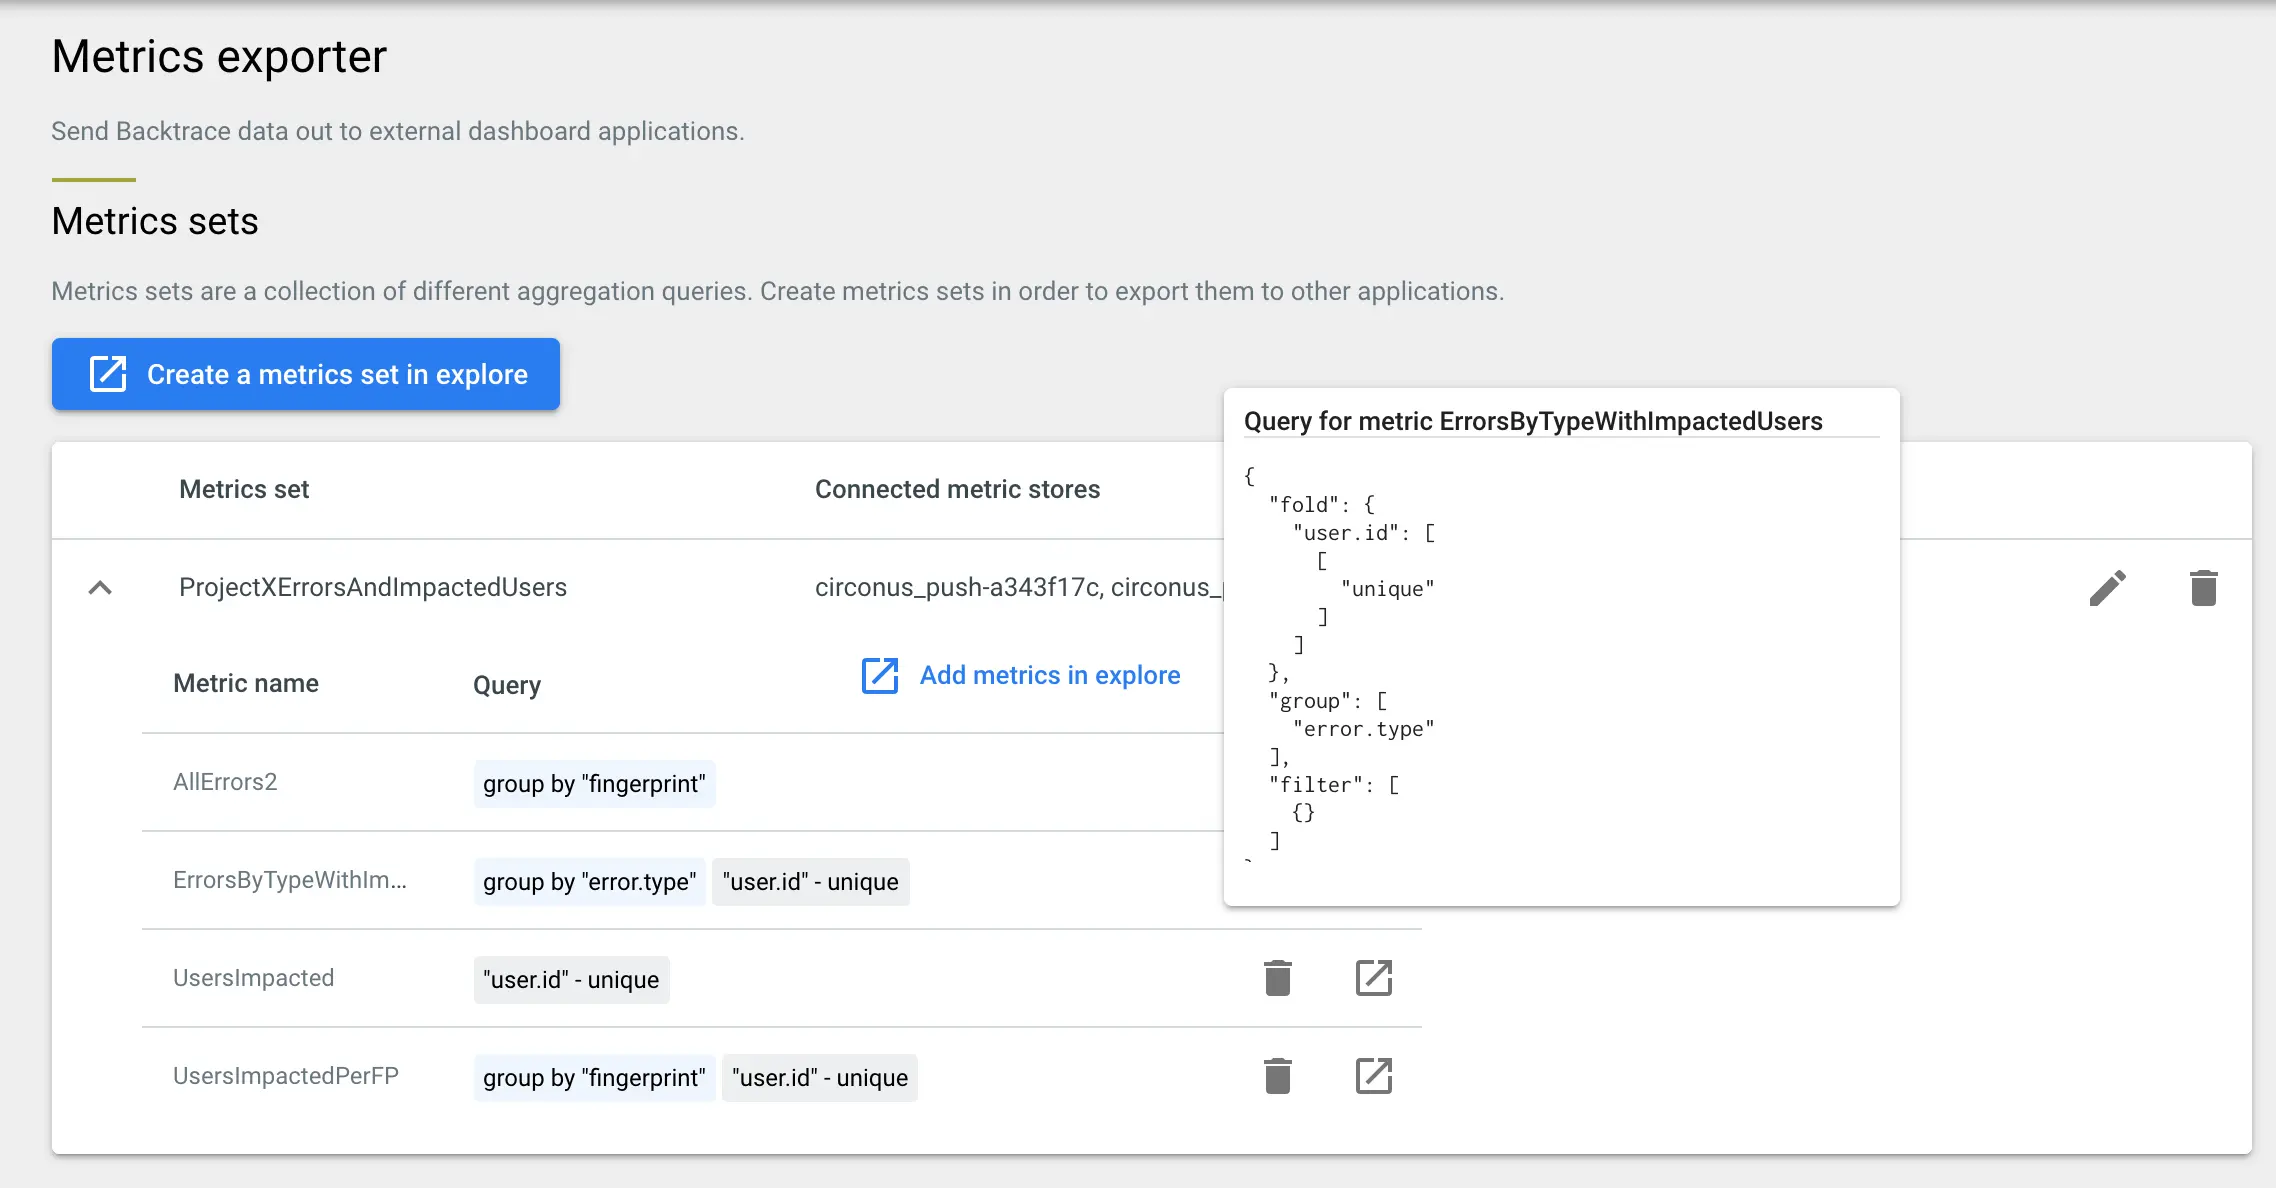
See an example below where a Metric Set called ProjectXErrorsAndImpactedUsers contains 4 metrics (AllErrors2, ErrorsByTypeWithImpactedUsers, UsersImpacted, and UsersImpactedPerFingerprint). You can preview the query that is defining each metric.
Supported Metric Stores
Backtrace will share data from Metric Sets to third party system through Metric Stores. Metric Stores use Adapters to connect with third party stores via push or pull mechanism. In this section, we will discuss which systems are supported and which adapters can be used.
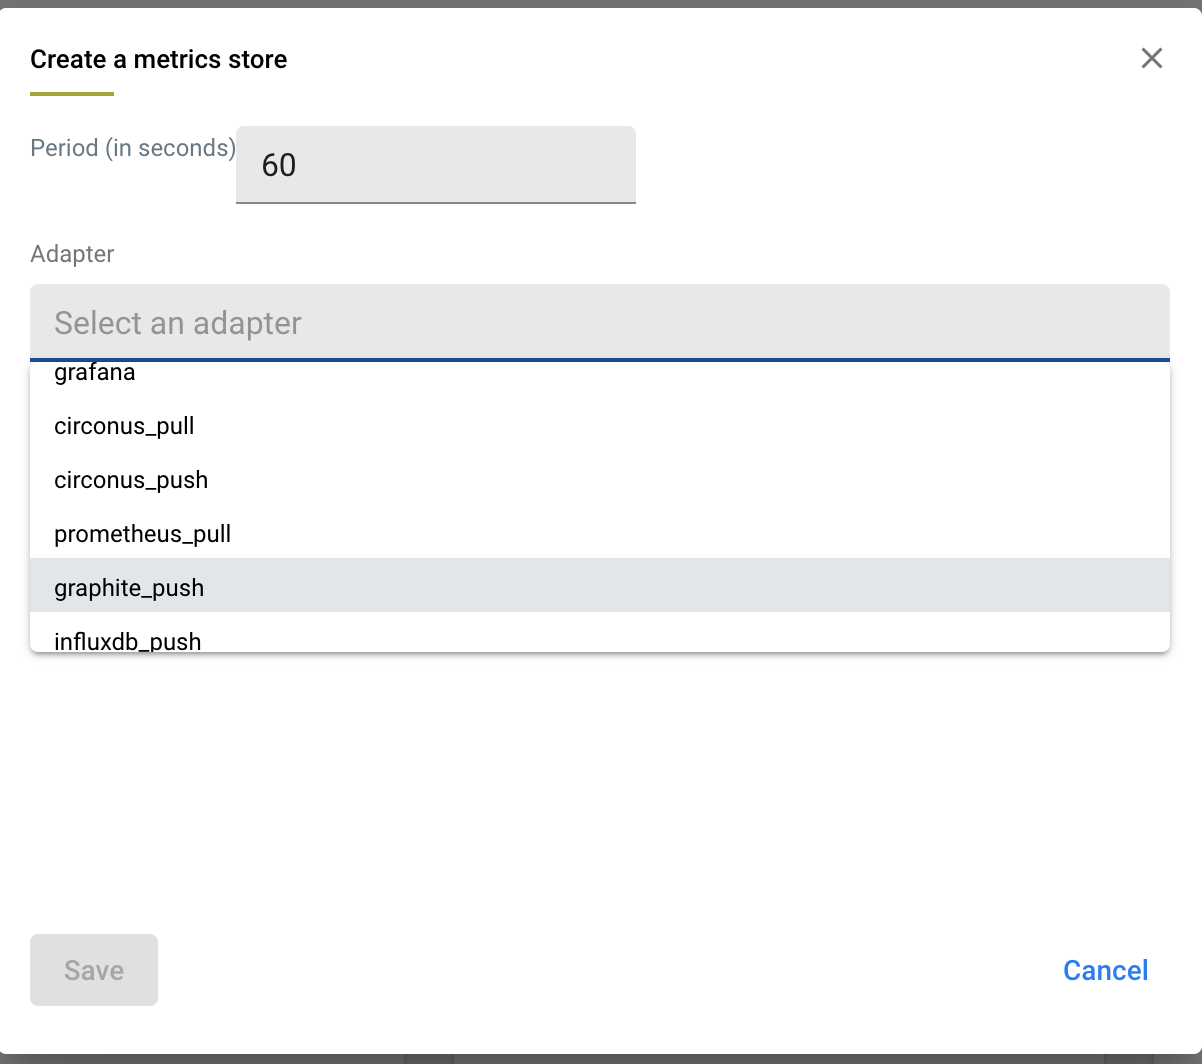
Create a Metric Store
When creating a Metric Store, you will specify a Name, a period (in seconds) for how often to share data, and choose an Adapter to use. Depending on the Adapter you choose, you will need to specify additional connection information. Please see your third party's documentation for the best way to ingest metrics from third part systems like Backtrace.
See below for details on how to configure supported adapters.
Circonus
Backtrace connects to Circonus via one of 2 adapters:
- Circonus_pull: Backtrace will generate a randomly secure URL from which to pull JSON data and a randomly generated username and password with basic authentication. Enter this URL into your Circonus integration as a JSON:Pull check. See details in the Checks section of the Circonus docs to create your JSON: Pull check.
- Circonus_push: You will need to set up a JSON Push check in Circonus, and copy the "Data Submission URL" that Circonus provides. In Backtrace, create a new Circonus_push adapter and paste the Data Submission URL in the Backtrace Circonus_push adapter. You can configure the frequency (in minutes) at which metrics are pushed to this URL in Backtrace. Backtrace sets a default value of 60 seconds.
Datadog
Backtrace connects to Datadog via the HTTP Post API. When creating as Datadog adapter in Backtrace, you mist specify a DD_CLIENT_API_KEY to use. You can configure the frequency (in minutes) at which metrics are pushed to this API, and the default is 60 seconds.
Graphite
Backtrace connects to Graphite via the Carbon API and shares plaintext as described here. Specify a hostname and a port to write data into, netcat style. You can configure the frequency, and the default is 60 seconds.
Grafana
Backtrace connects to Grafana via the HTTP API as defined here. Depending on whether you are using a shared or dedicated cluster, you must specify:
- An instance URL
- If it looks like https://graphite-us-central1.grafana.net/metrics then it is a shared instance and an instance ID input is also required.
- If it looks like https://tsdb-123-your-company-name.hosted-metrics.grafana.net/graphite then it is a dedicated instance and you do not require an instance ID.
- An API key.
- An instance ID (optional, see first bullet point). You can configure the frequency (in seconds), and the default is 60 seconds.
Prometheus
Backtrace connects to Prometheus via a randomly generated secure URL Backtrace can configure Prometheus to scrape from. See the Prometheus documentation on targets to scrape.
InfluxDB
The API for this is here. The user configures the following:
- URL to post to.
- The user is able to configure the frequency (in minutes), but the default is 1 minute.
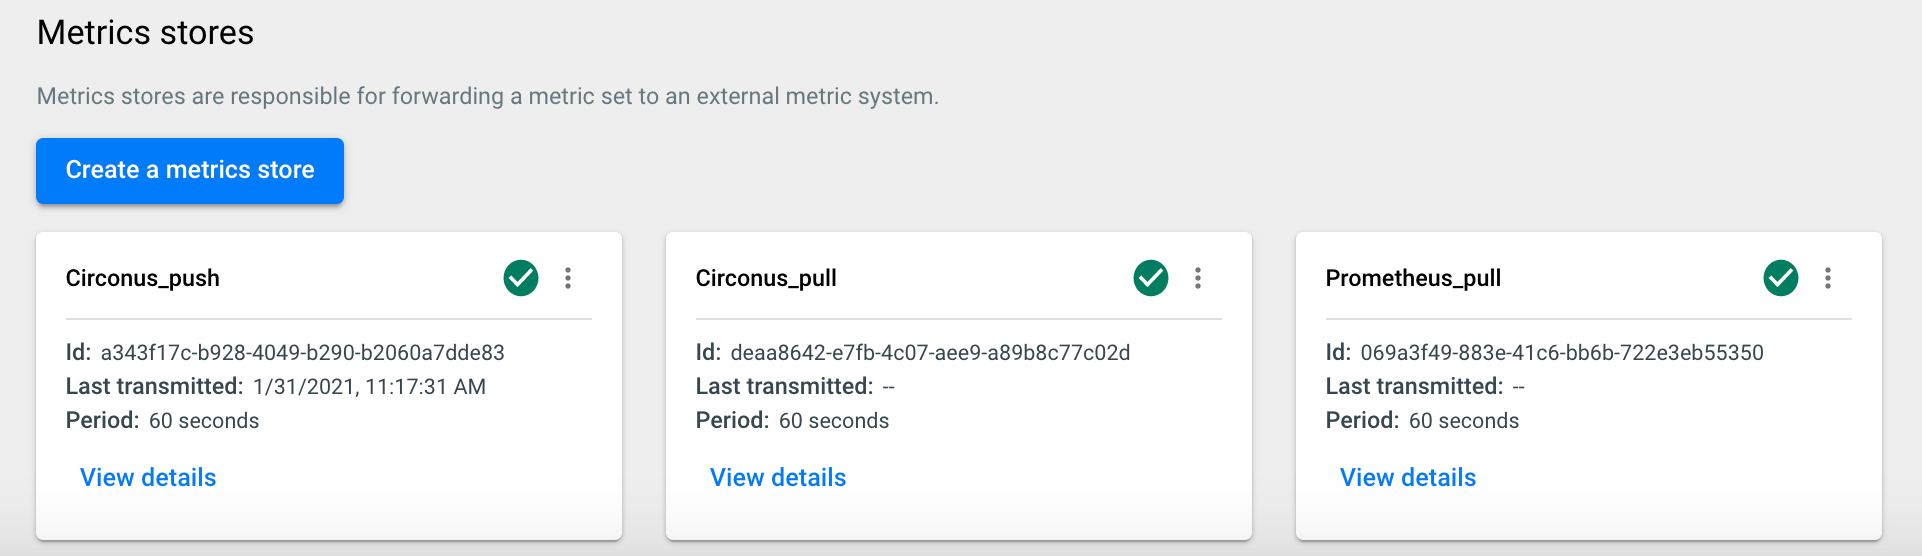
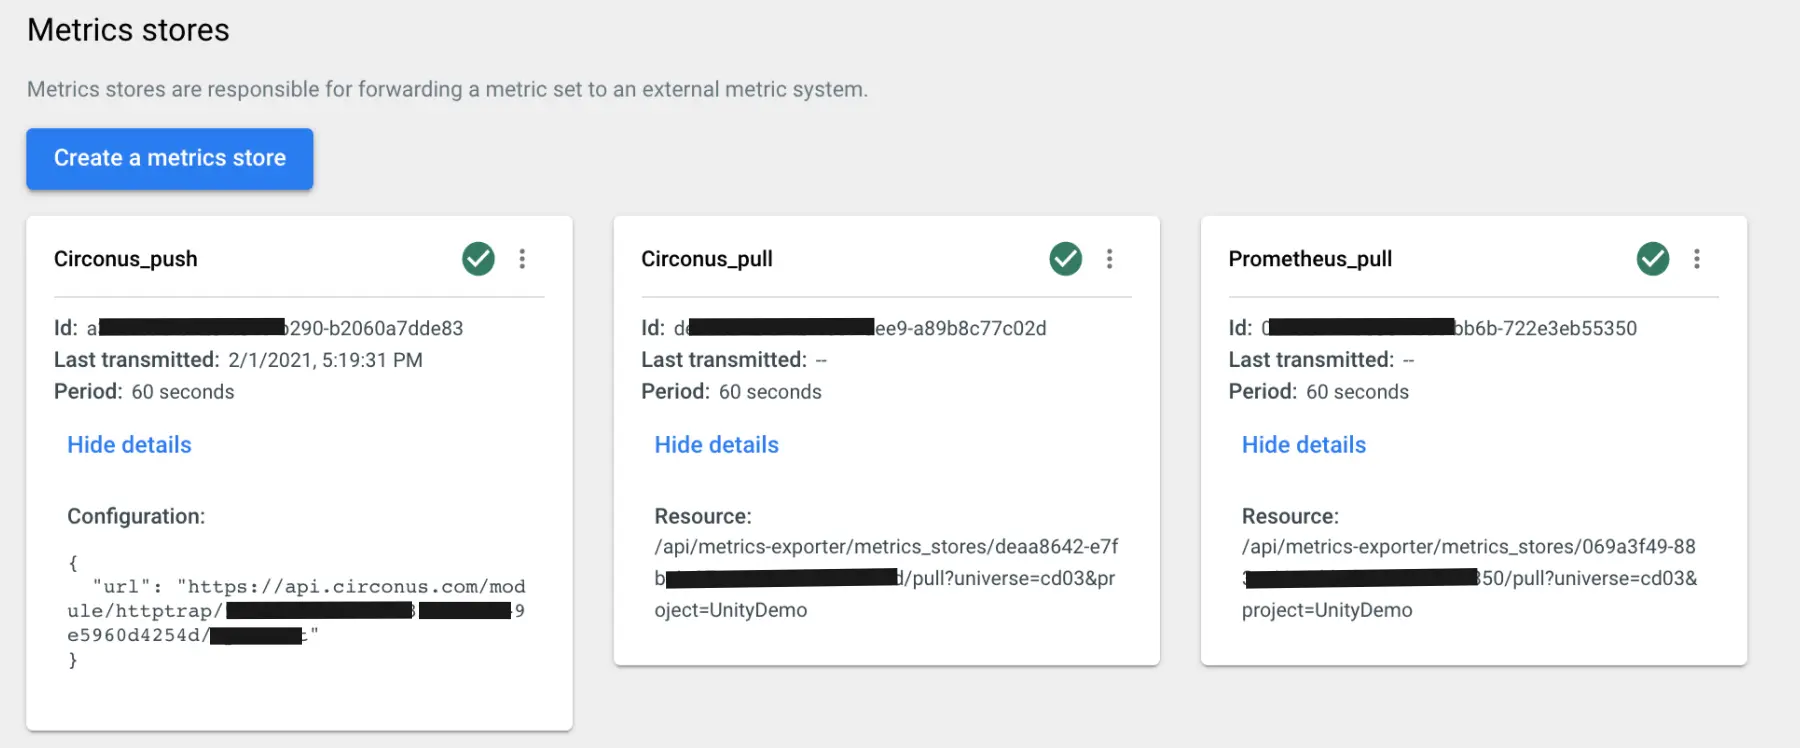
View Status or Edit Metric Stores
Each Metric Store will provide information about how often it shares data with the target (you can see below each Metric store has a Period of 60 seconds), and the last time data was transmitted for the Push type adapters. Additional configuration details can be viewed, For the PUSH type adapters, you can see the configured URL or similar that Backtrace will push data to every ## seconds. For the PULL type adapters, you can view the resource URL you can enter into the third party store to retrieve information from Backtrace.
Summary
After reading this chapter, you should have a good understanding of components you need to configure in Backtrace to push metric data to your third party dashboard system. To review:
- You need one or more Metric Sets, which are named groupings of Metrics, to be connected to one or more Metric Store.
- Metrics will be defined by queries in the Explore view and saved within one of the Metric Sets. When defining Metrics, use filter, group by, and scalar aggregate values to shape the query, ignoring time filters. "Export" the Query as a Metric Export and preview the Metrics in the Project Settings / Metric Export page.
- Metric Stores will use one of the packaged Adapters to define push or pull connectivity to the third party system. Metric Stores will share data with the third party system based on a period specified in Backtrace at second-level granularity.