Importing Metrics and Generating Stability Scores
Backtrace allows users to compute error rates against any metrics you collect like "Sessions started”, “Minutes used”, “Online connections made” or "Songs played". These metrics can be imported from raw data that lives in external systems like Graphite, Influx, Redshift, or Postgres. In the future, you will be able to supply raw data directly through the Backtrace client SDKs.
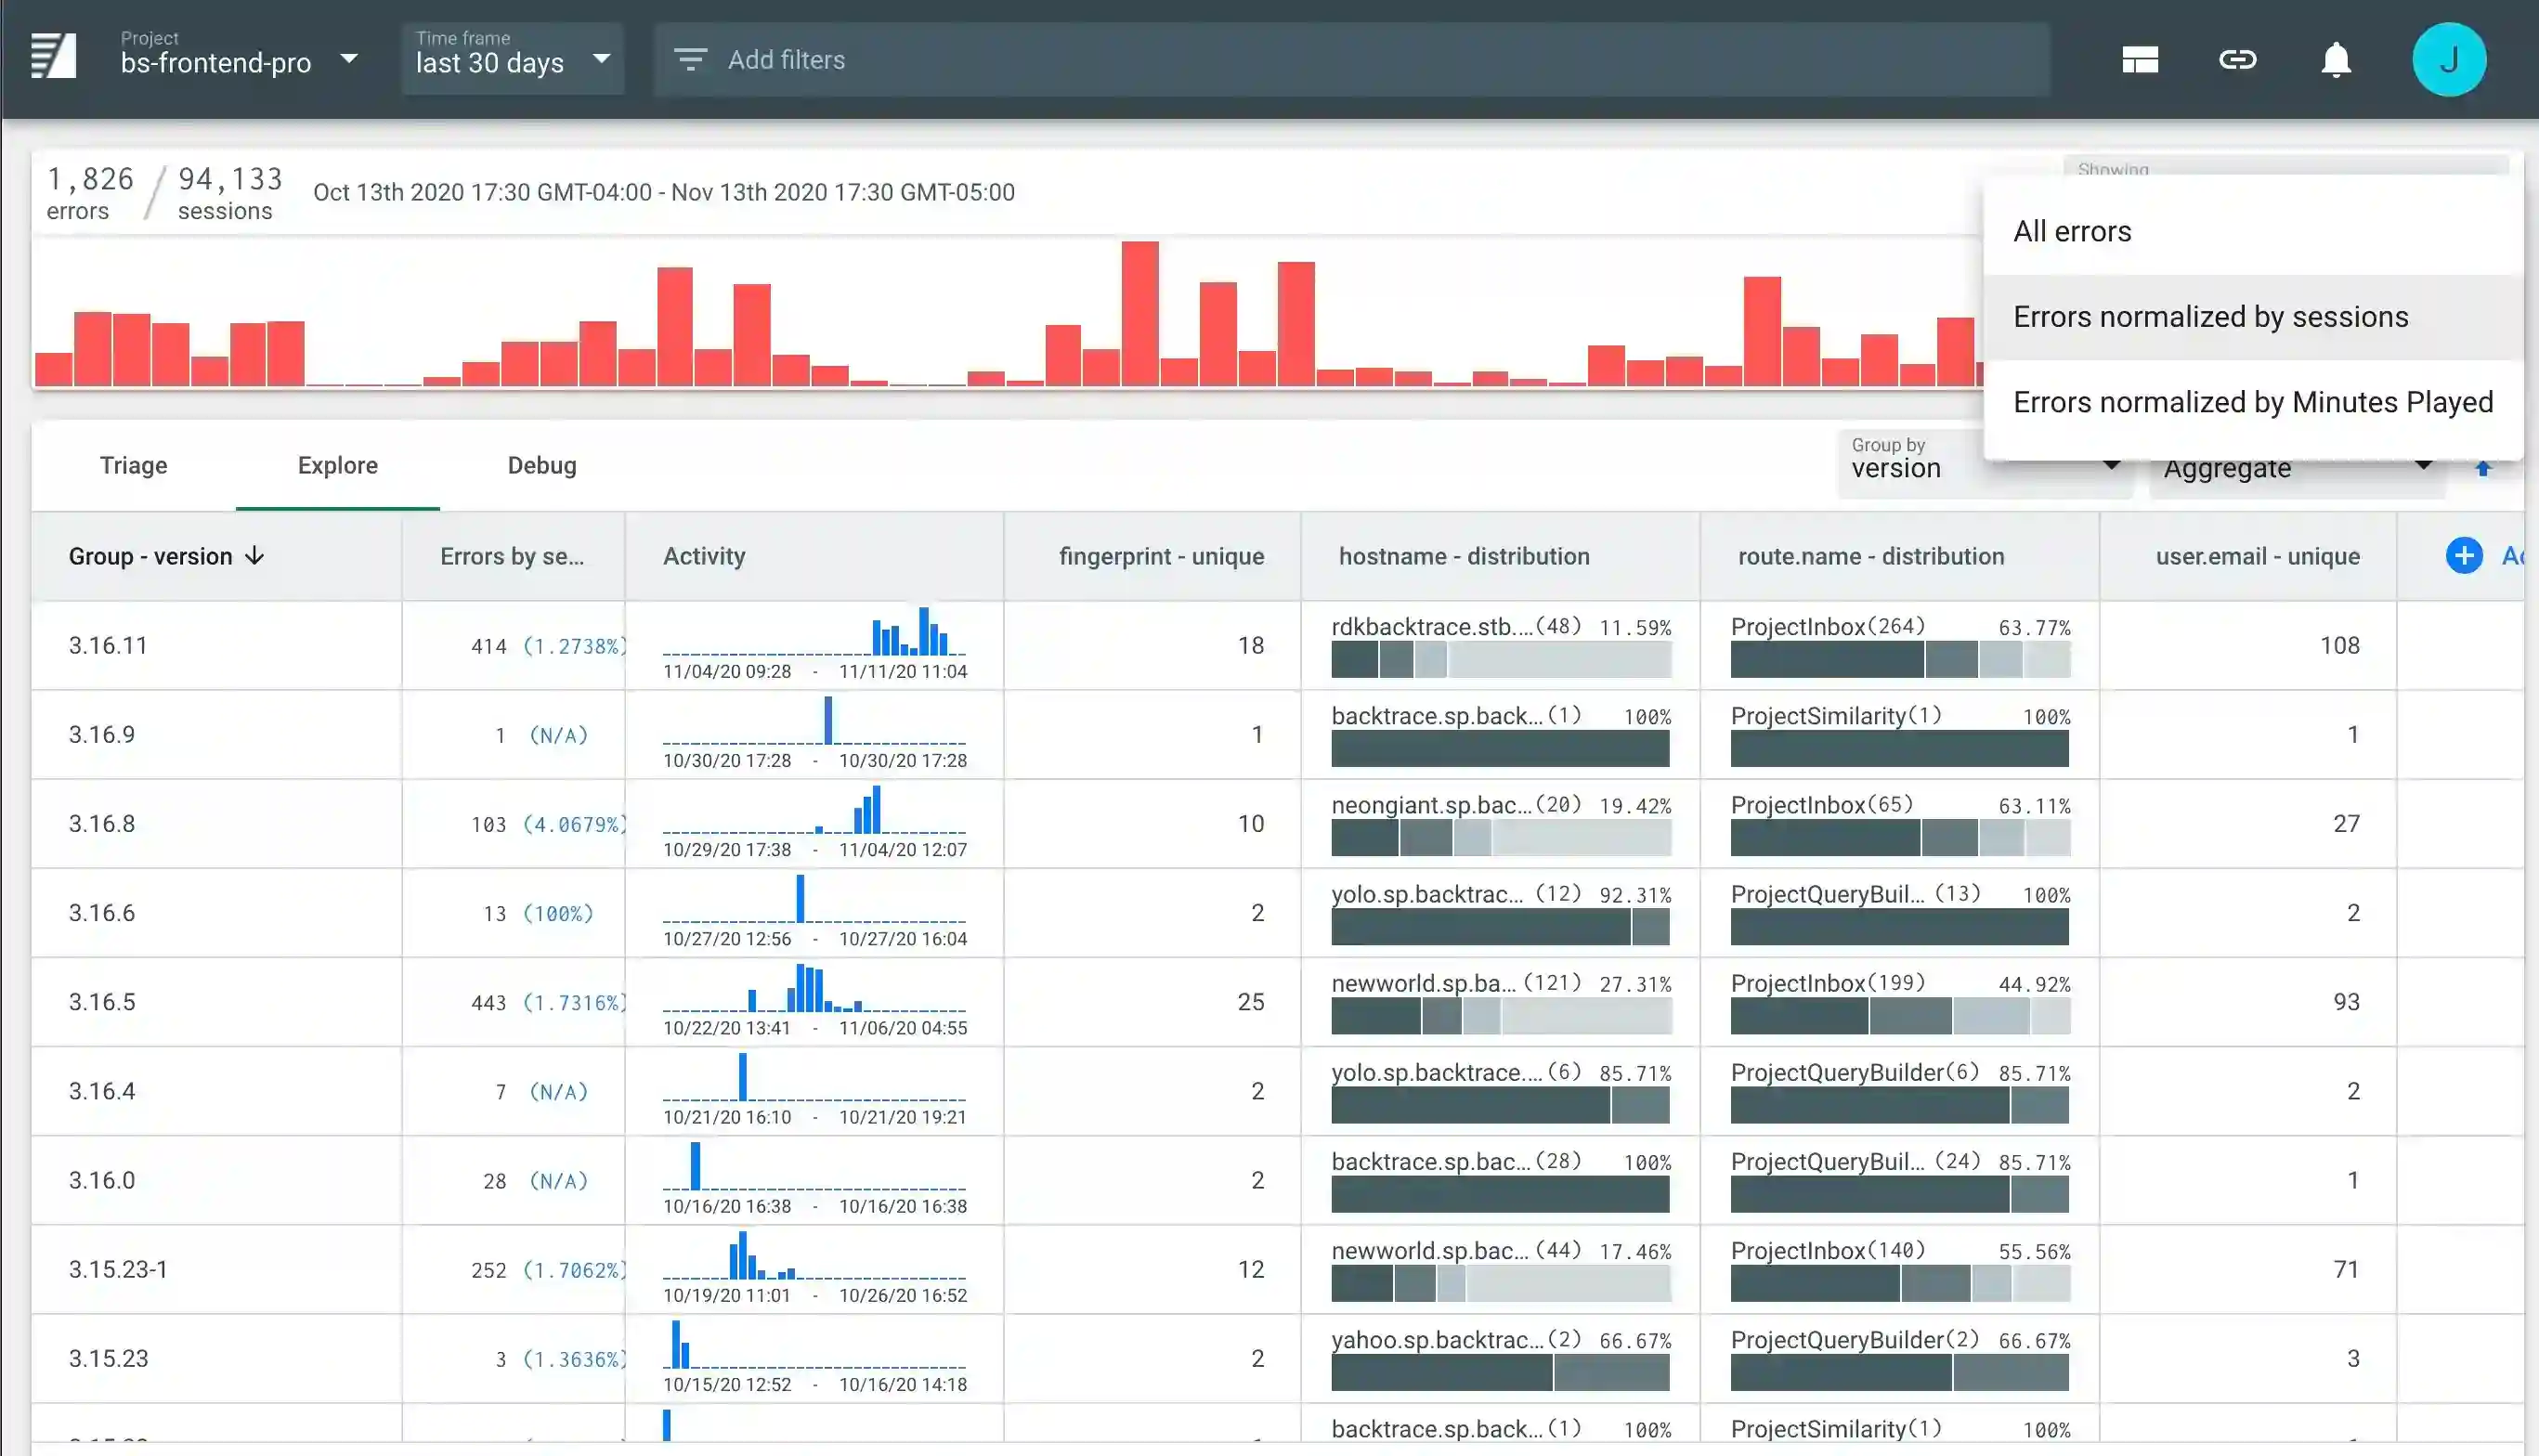
Below, you can see how Backtrace displays the number of errors by session (stability score) for each version:

To use the system, a Project Admin needs to define a metric group with a series of metrics contained within it, and a metric source with a series of importers to populate data for each metric you define.
This guide will show admins how to use the UI to take the steps needed to get started set up a common type of stability monitoring, which is errors by session and minutes played for each released version of your application or game.
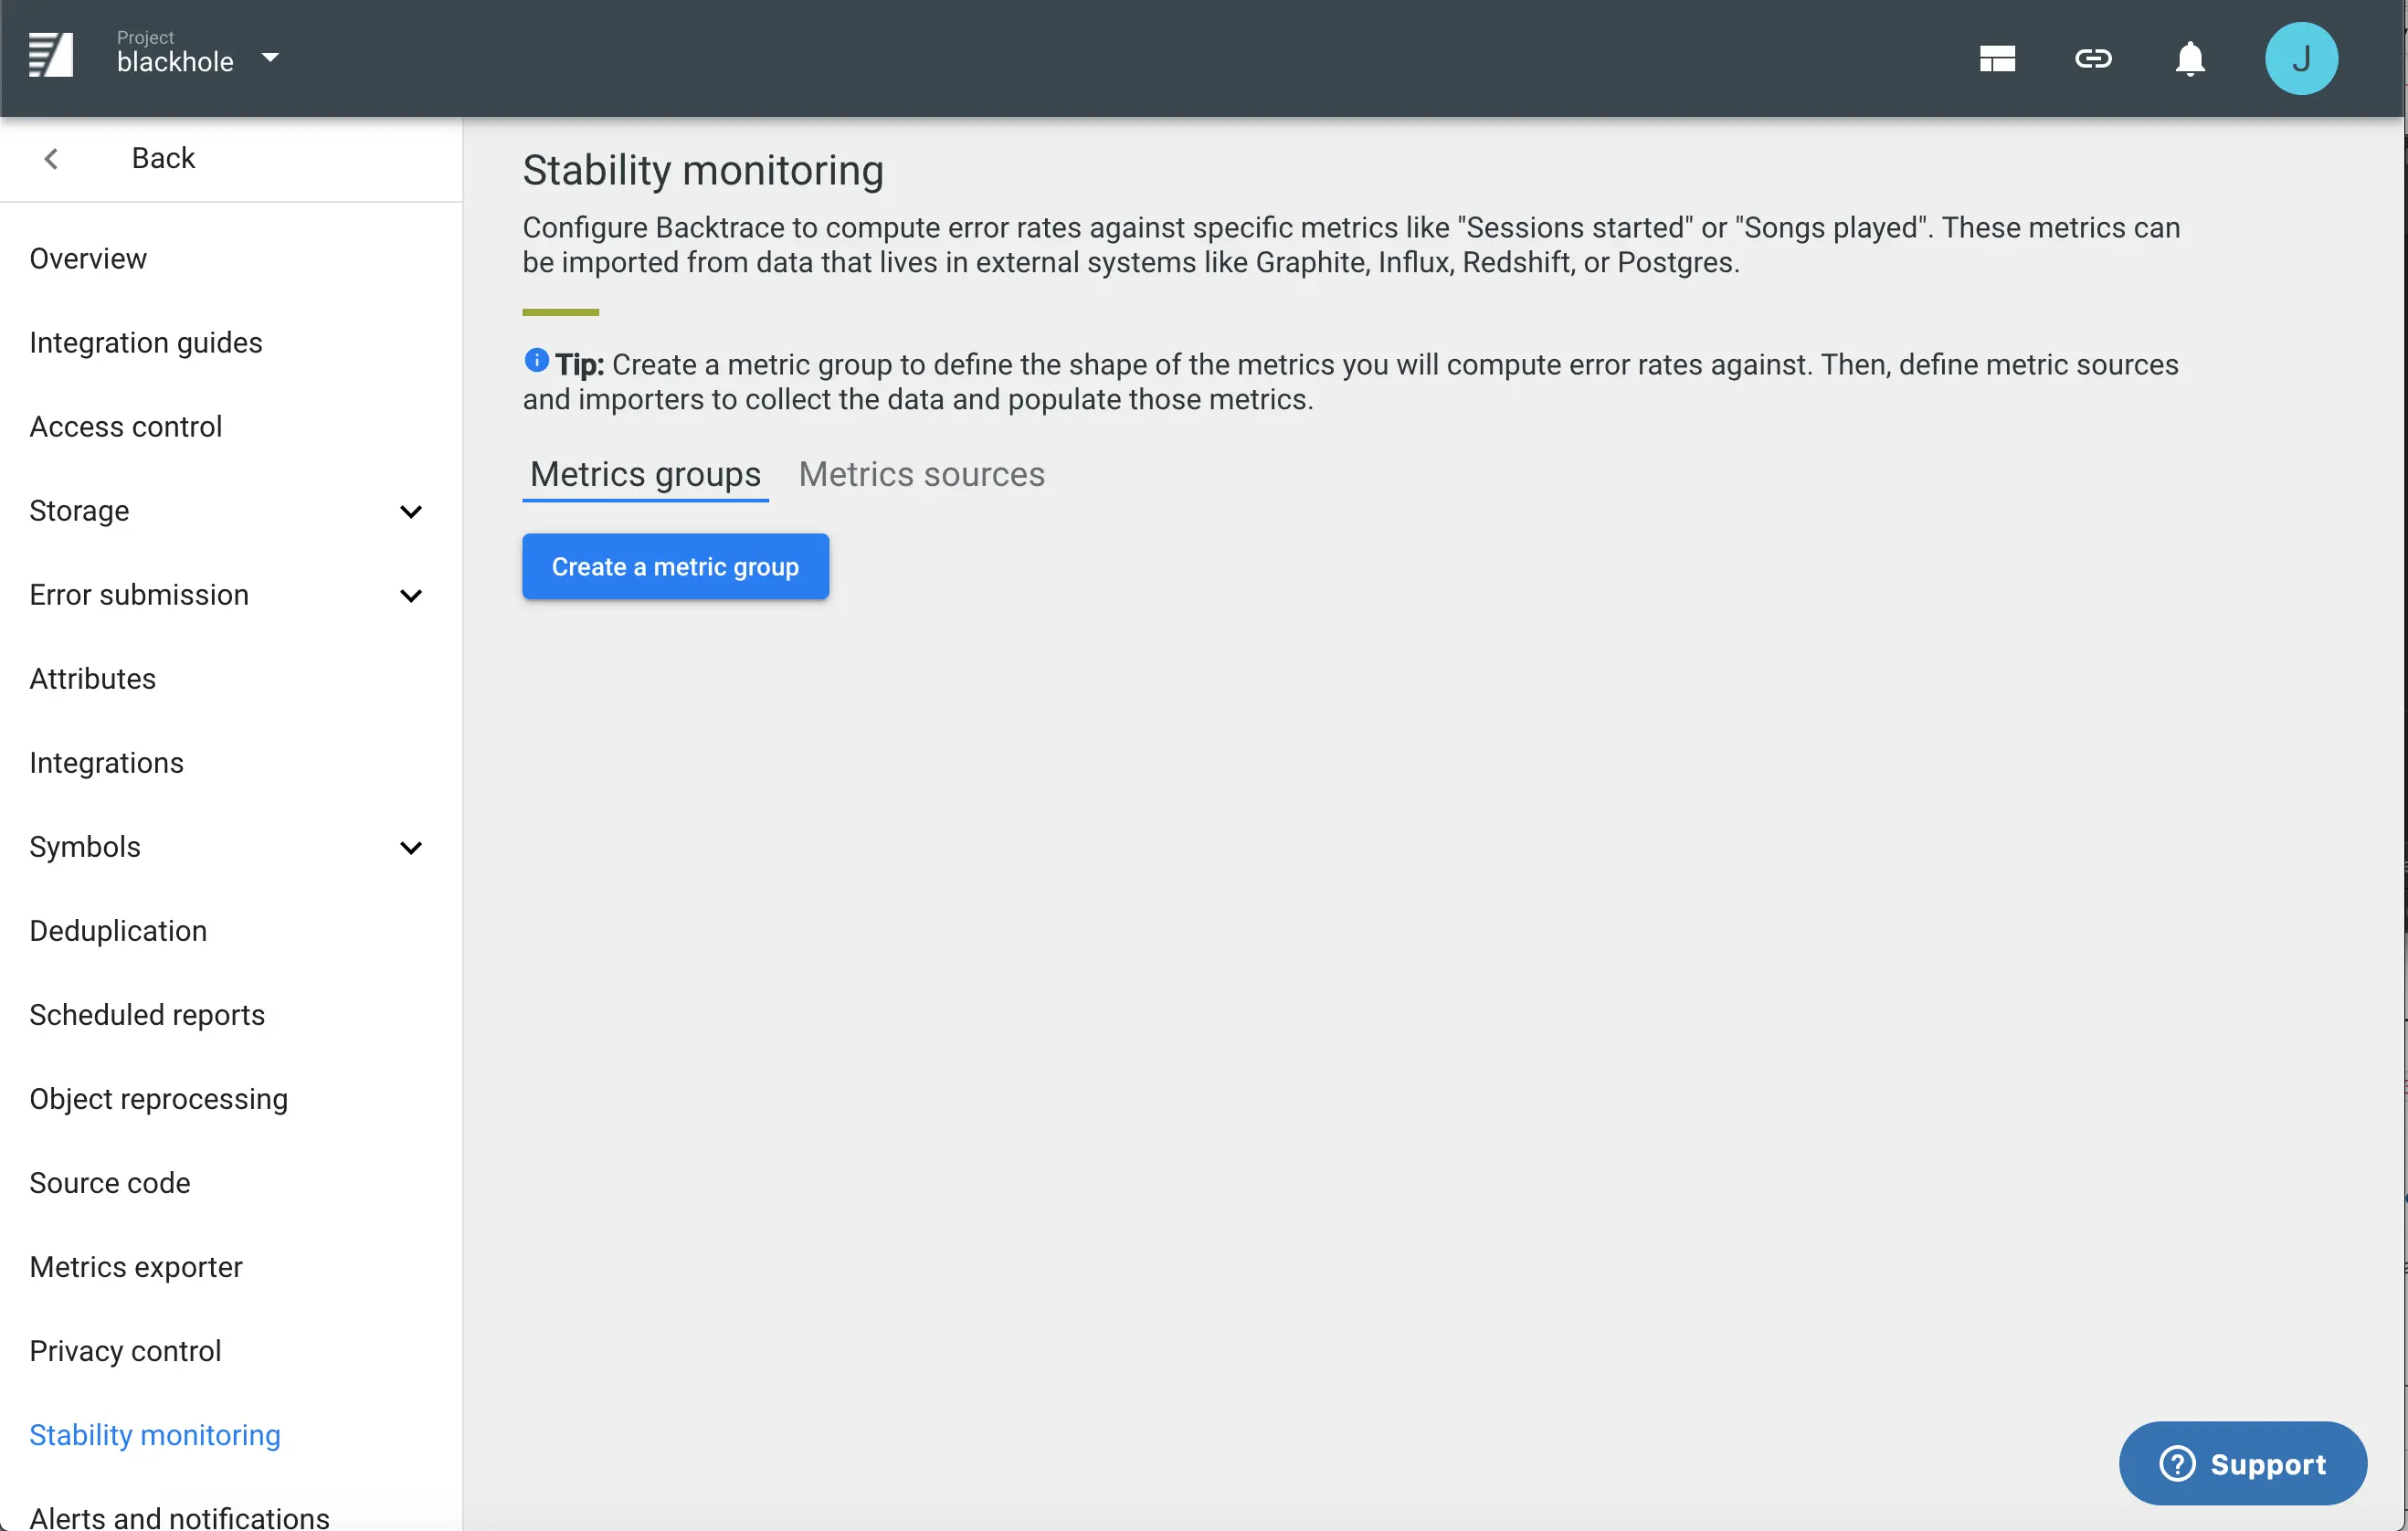
Project Settings
Click into Project Settings > Stability Monitoring to setup the required metric groups, individual metrics, data sources, and importers.
Manage the Backtrace Metric Objects
Create the Metric Group
First, we set up a metric group. Common metric groups are named "Sessions Started", "Minutes Played", or "Multiplayer Sessions Started".
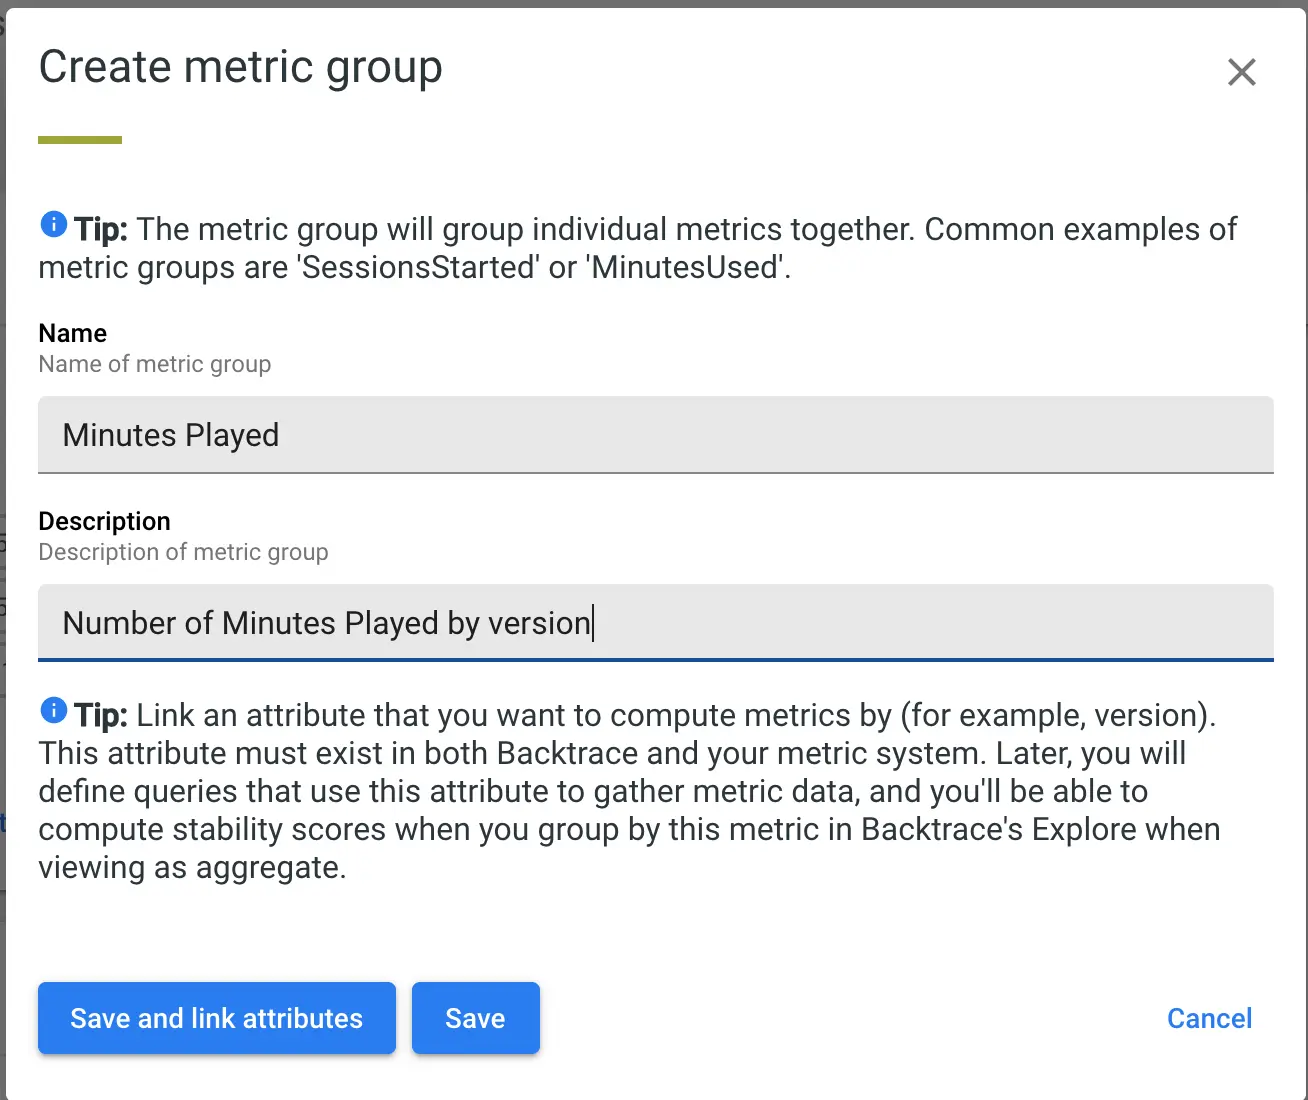
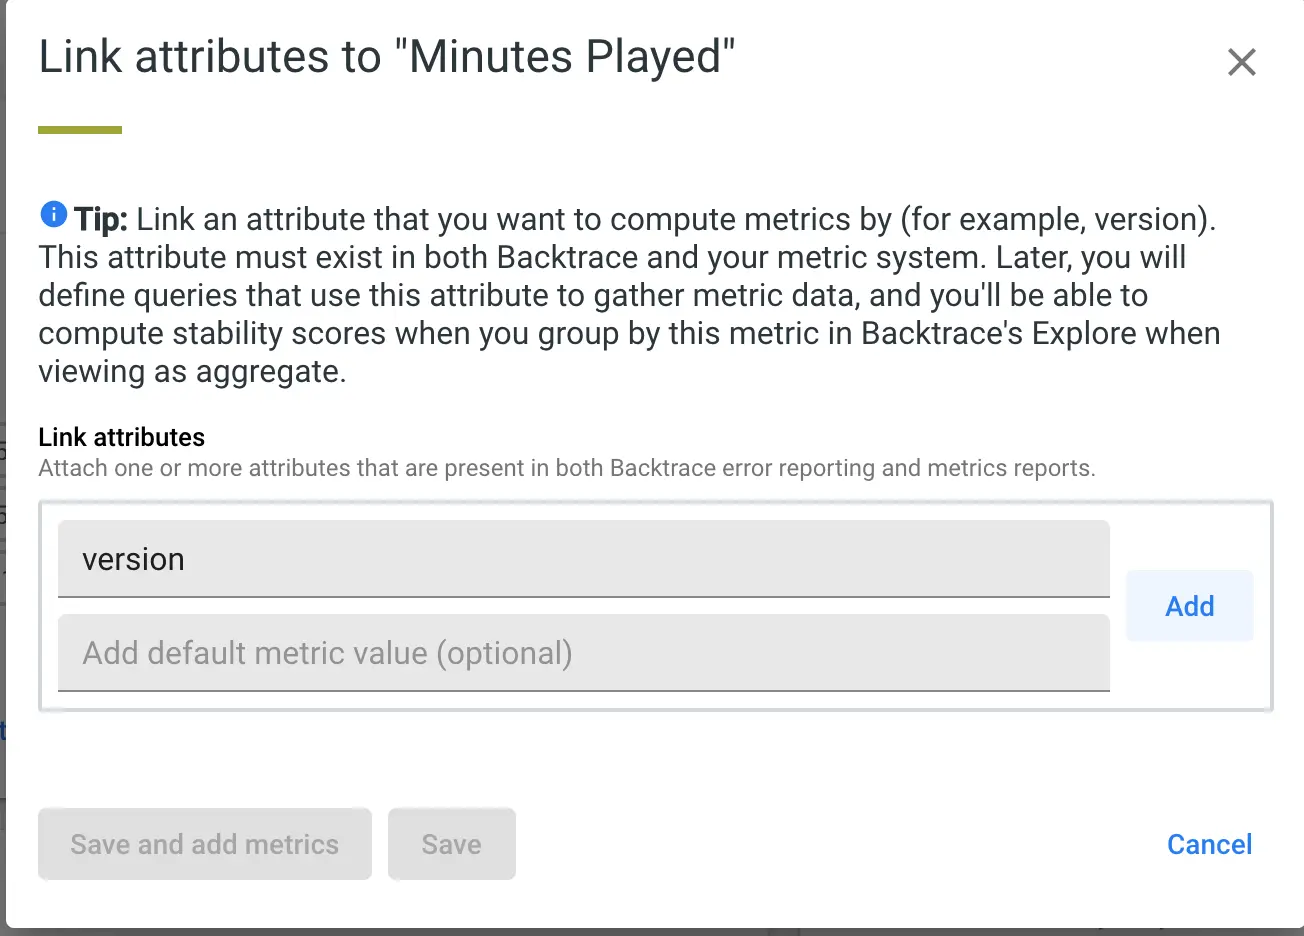
When defining a metric group, you will want to link an Attribute that you want to track stability scores for when grouped by it (i.e. Version). You can provide a default value in case that the queries you use to import data have no value for the attribute.
Note: If you are linking attributes for a metric group that you expect to receive via events from one of our SDKs (Unity 3.5.0+ for example), you must ensure that the SDK is sending ALL of the attributes that you have linked on the metric events for that metrics group. If a metric event is missing an attribute that is expected for that metric group, the event will be dropped.
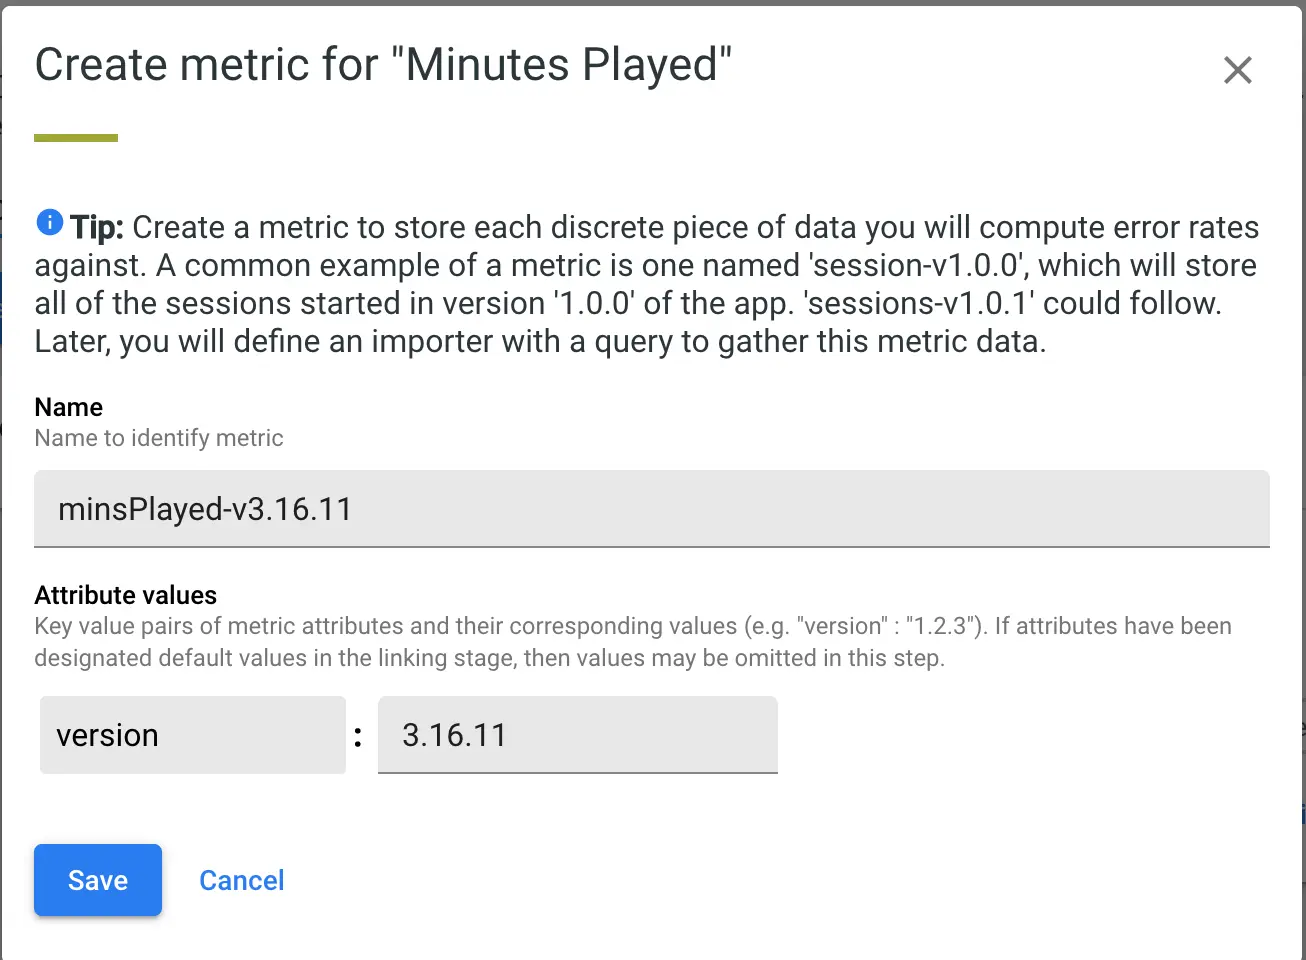
Create the Metrics
Now we can start adding metrics, it’s good practice to have naming conventions like {metricGroupName}-{attributeName}{attributeValue} for each metric (i.e. minutesPlayed-version1.0, minutesPlayed-version1.1, etc).
If you are following these examples, you should create a few metrics to manage number of Minutes Played or Sessions Started for each of your last few versions. Below, we have metrics for Minutes Played in Version 3.16.0, 3.16.2, 3.16.4, and 3.16.5.
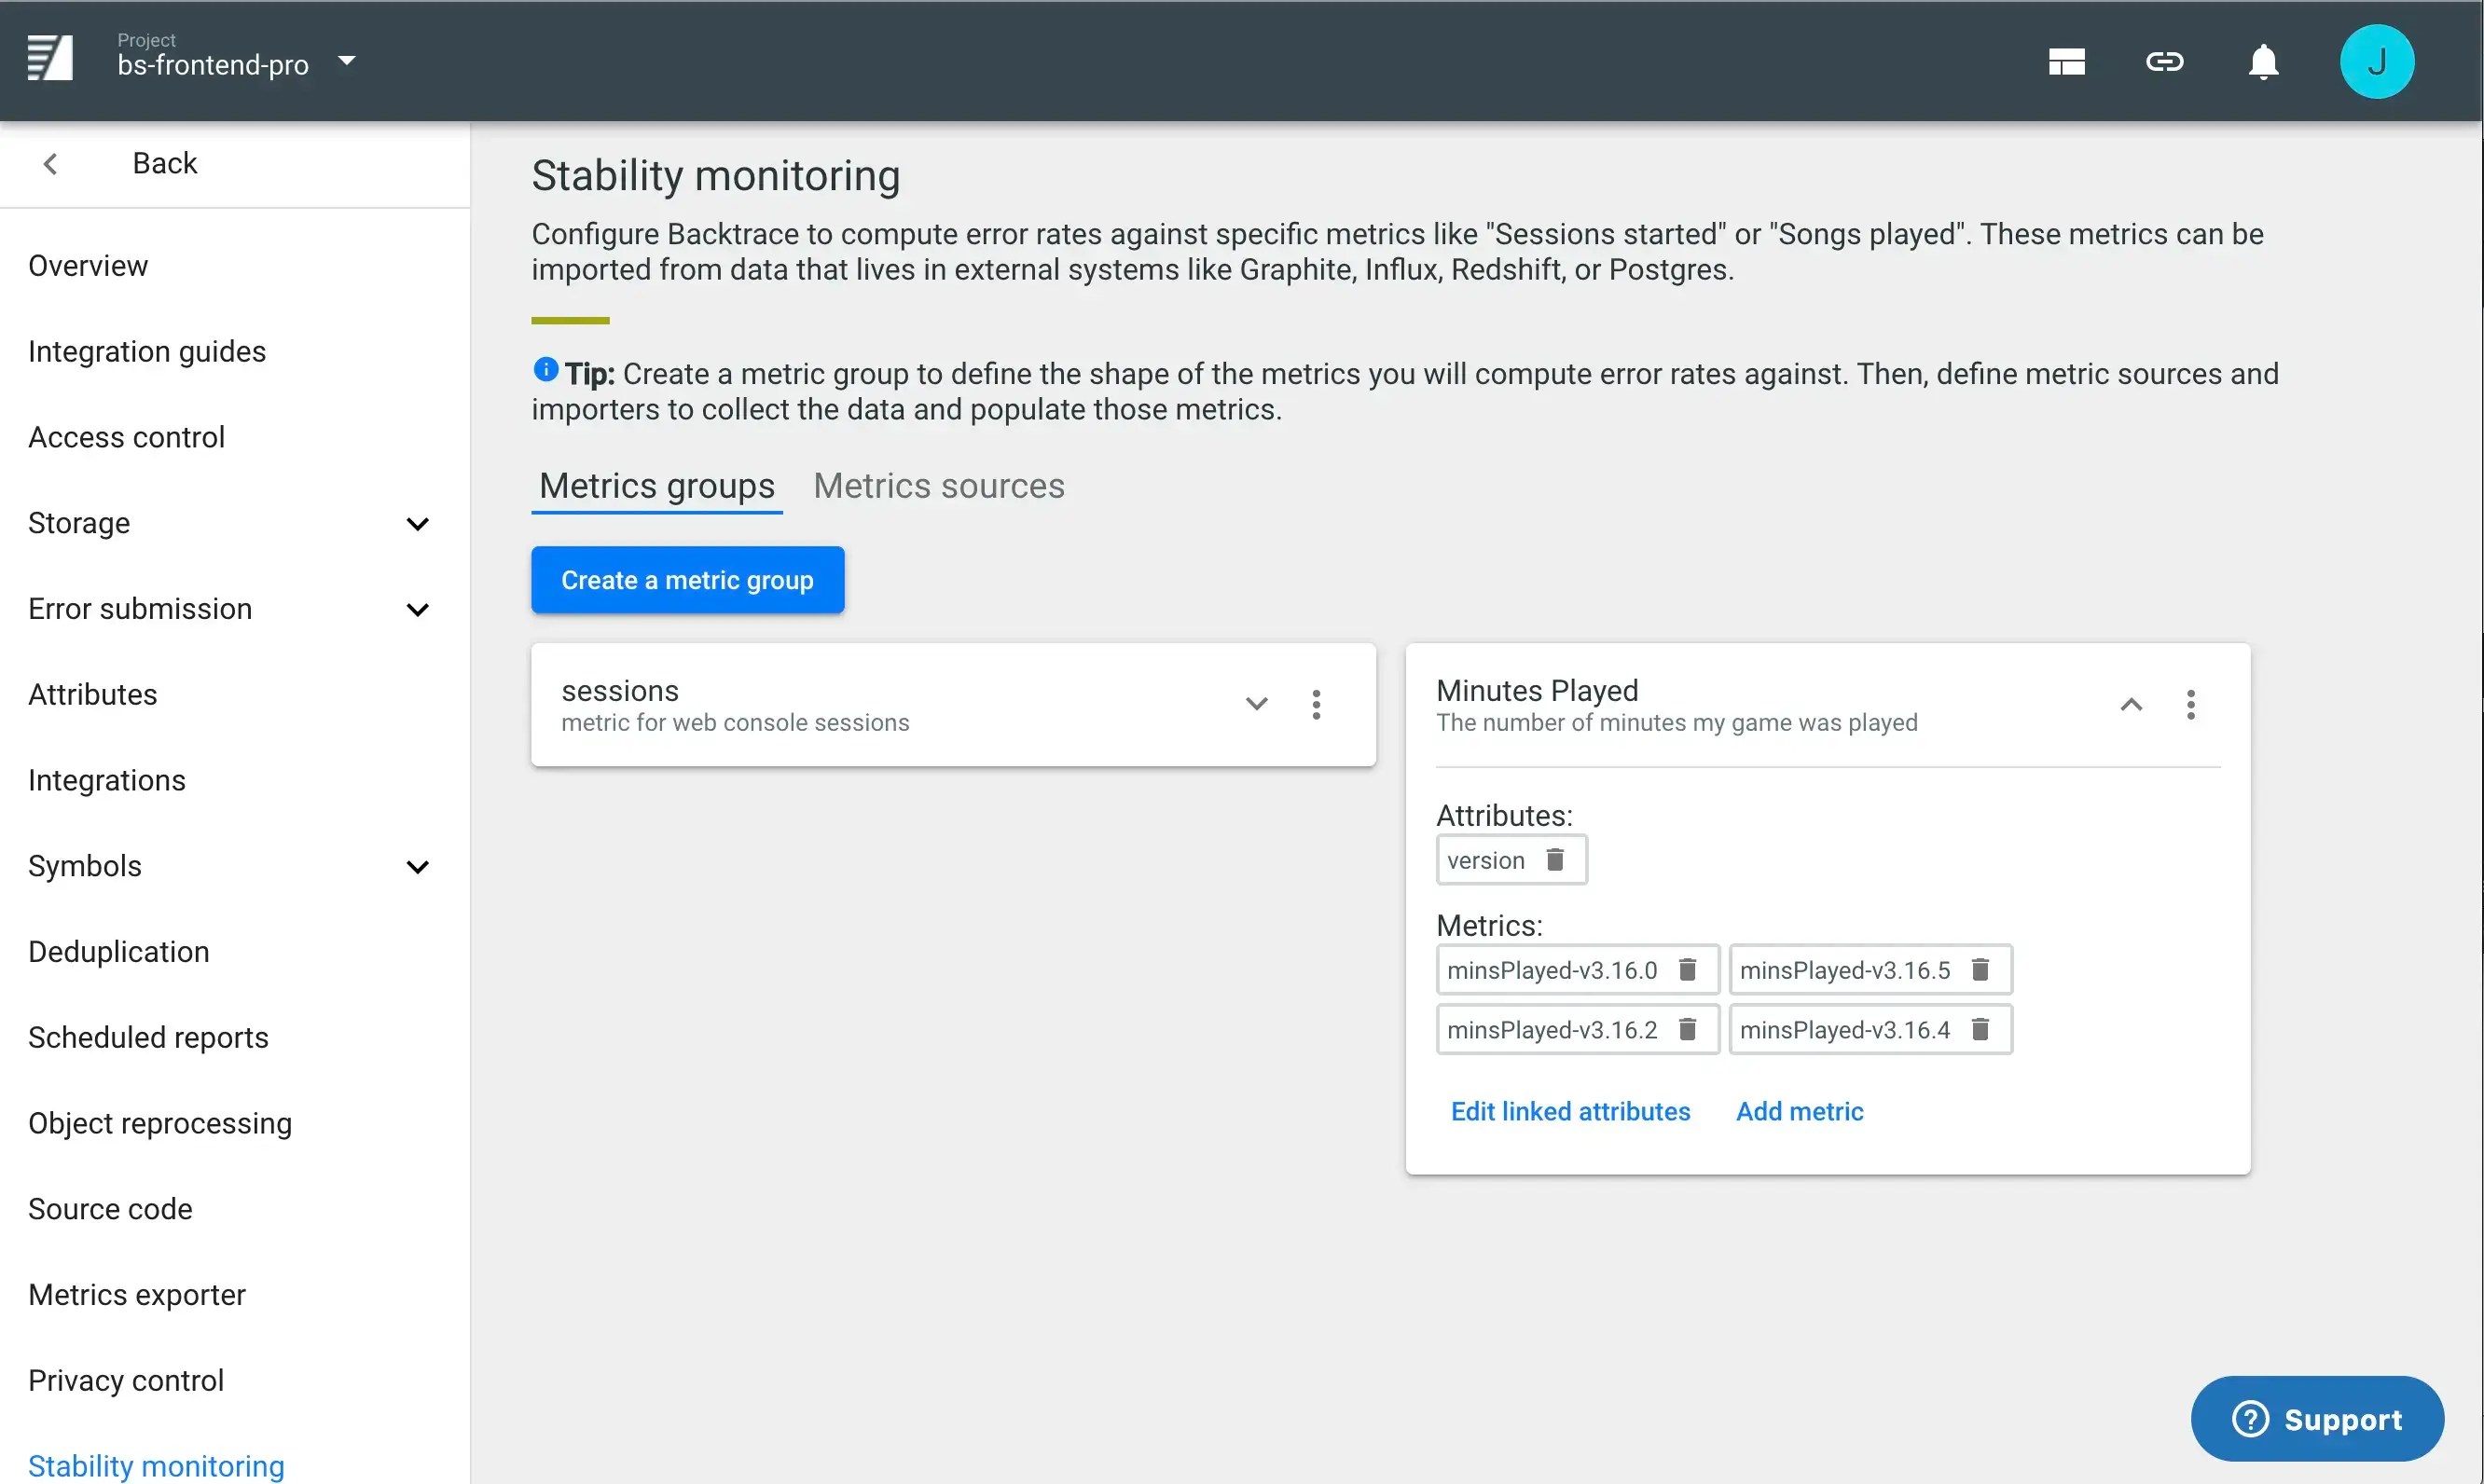
We now have the 'shape' of the metrics in Backtrace. Next, we need to populate these metrics with data.
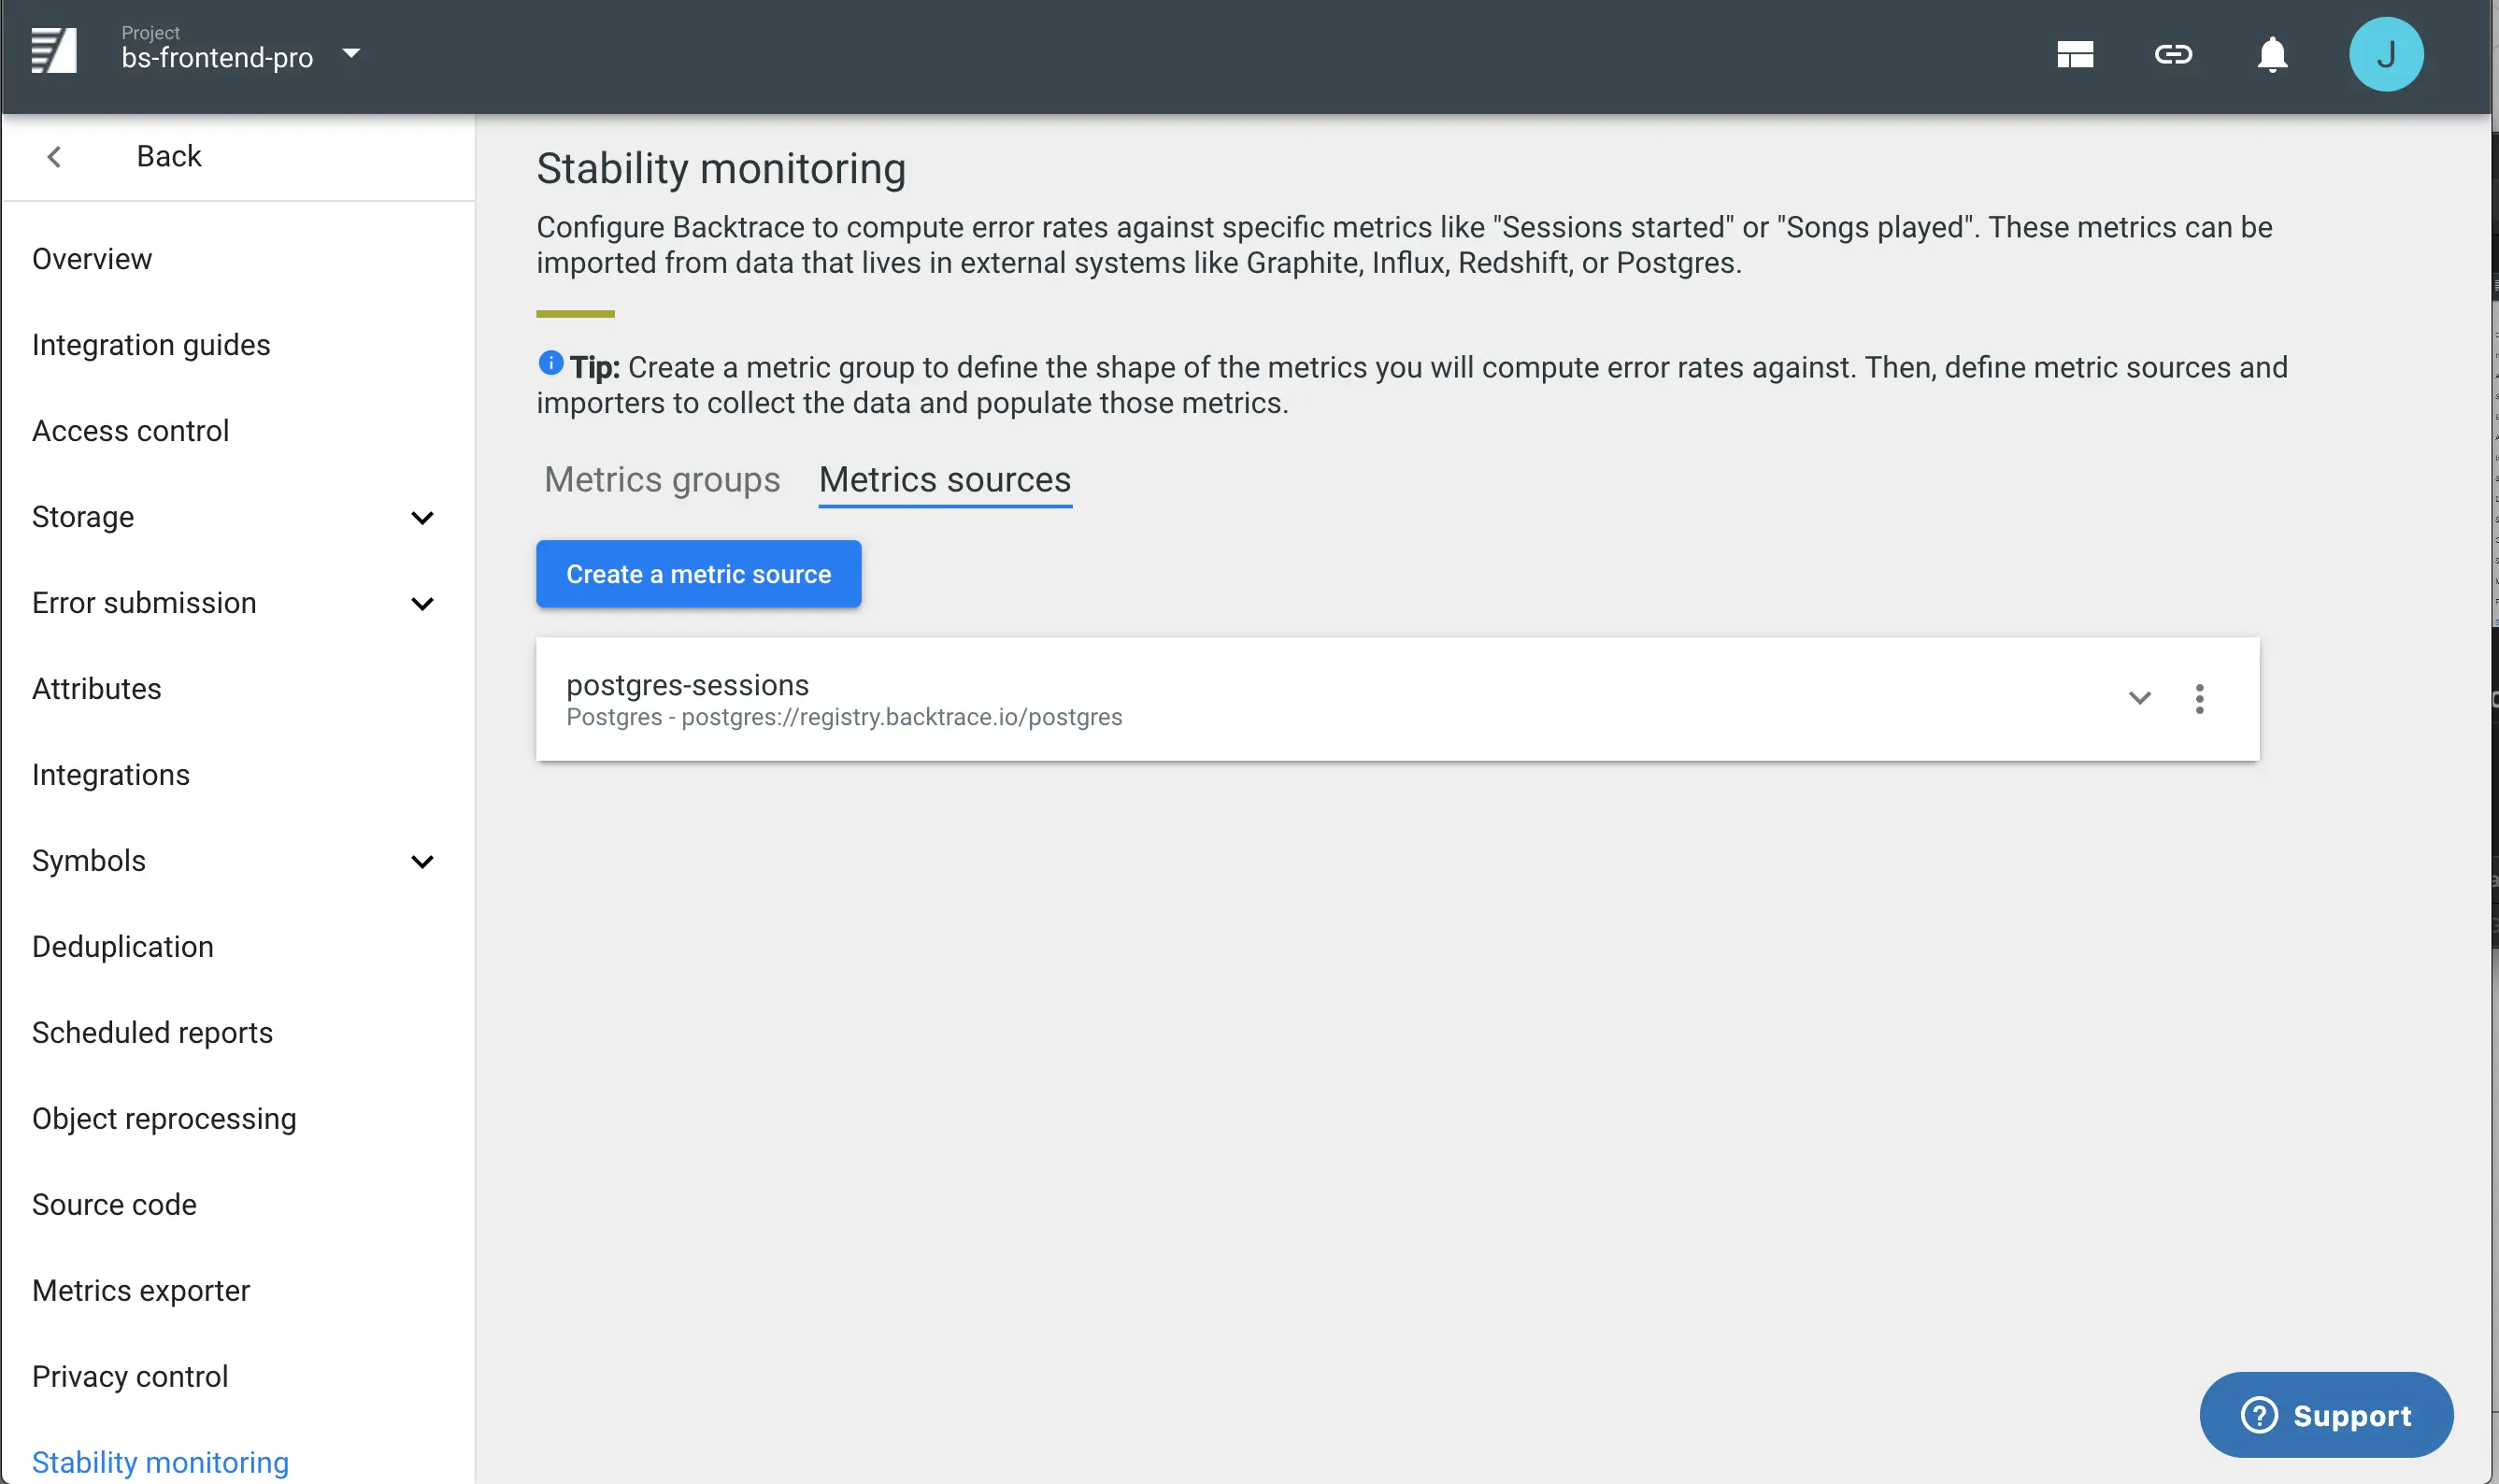
Manage the Data Import System
The Metric Sources tab allows you to define connections to metric systems like Postgres, Graphite, Redshift, or Influx. In the screenshot below, a metric source to a Postgres instance called postgres-sessions is created.
Create the Metric Data Source
Click Add Metric Source to bring up the Create Metric Source dialog. Here, you will name your source, choose your source type (Graphite, Postgres, Influx, Redshift) and relevant connection and authentication options.
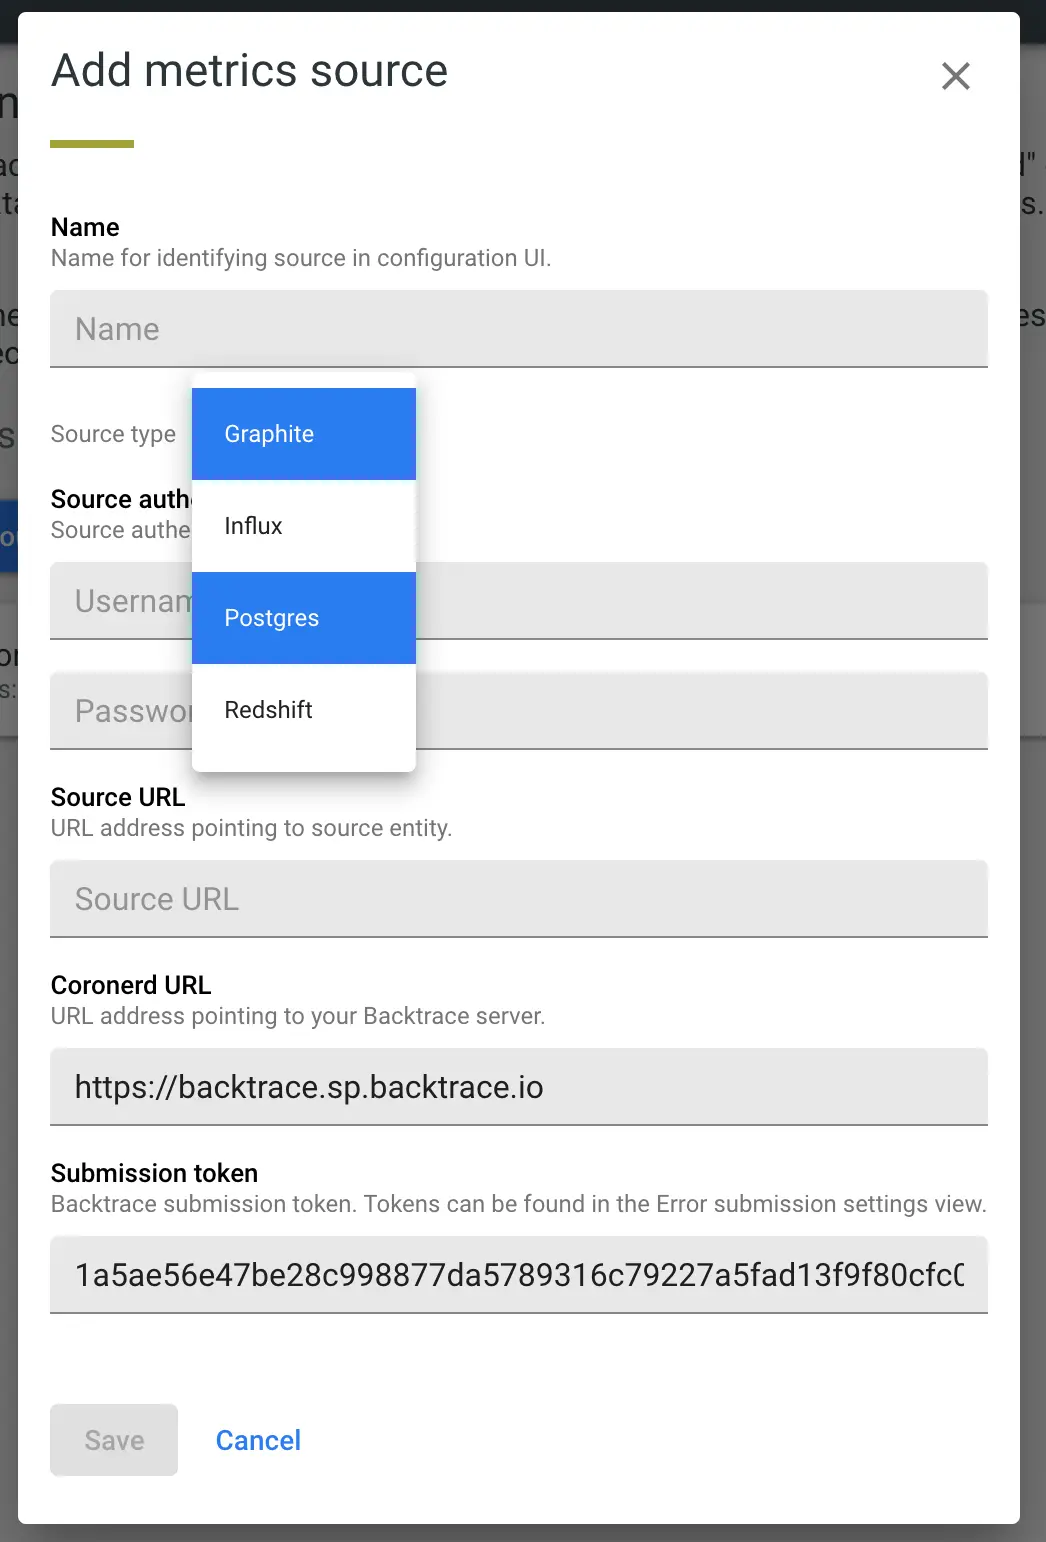
You'll notice above a Coronerd URL and Submission token as part of the metric source creation. Backtrace should fill in default values for you here. These are used by the metrics source to post the results of importers back into your backtrace project. You can generate other tokens to use under Project Settings > Error Submission Tokens.
Create a Metric Importer and link to each Metric
An Importer is the place where you write the query to pull metric information from the source systems and use results of that query to populate one of the metrics you defined earlier. Importers have three key sections
- The query to capture data
- The metric to link the results to
- Execution plan (how much history, how often to run)
See below for an example:
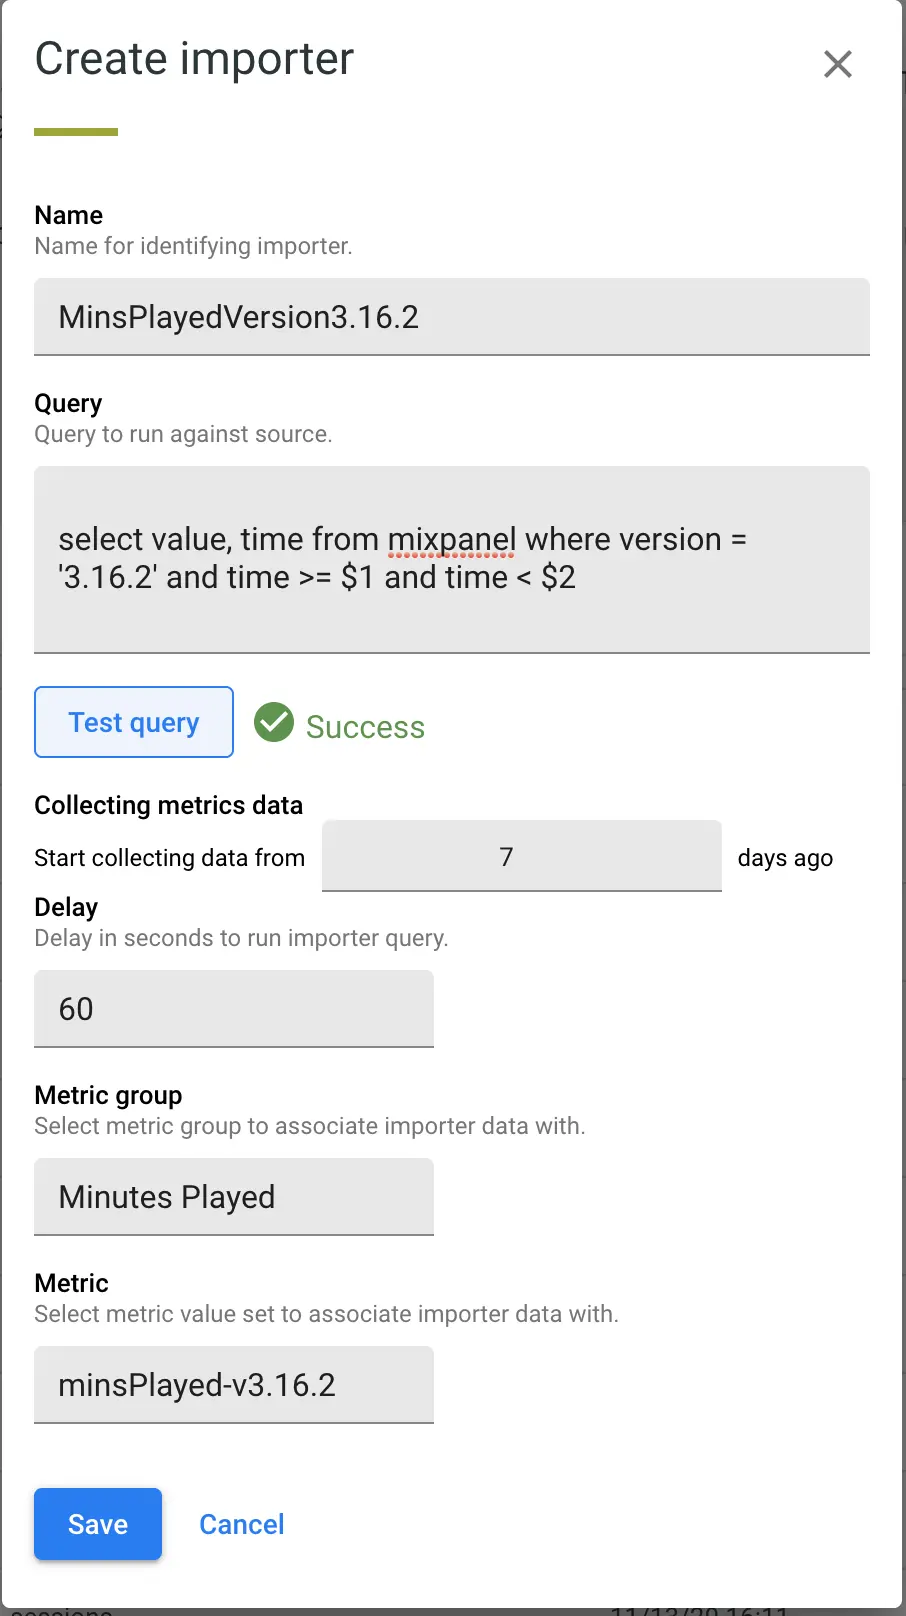
You can see we named the importer something meaningful (MinsPlayedVersion3.16.2) and wrote a query to gather the required metric data, linked it to the Metric Minutes Played/minsPlayed-v3.16.2, and defined the execution plan (7 days of history with a 60 second time period between syncs).
Parameterized Query Expectations
Backtrace uses parametrized queries to bound the time period for which data is being queried. If you use the "Test query" button, the system will try to inform you of any missing variables or other syntax issues. You should use the format of "time >= $1 and time < $2" within your query, and the system will populate $1 as either the last time the query was run or how far back in history you want, and $2 as the current time.
It is expected that you test your rest of your query body against the data source to make sure you are getting the results you expect. For example, below, you see a query to select the number of minutes played for version 3.16.2 with the time bounds.
select mins_played, time from metric_table where version = '3.16.2' and time >= $1 and time < $2
The results of your query will stored in the linked metric, so you may want to confirm the results of the query if you see incorrect data in Backtrace after the importers are run.

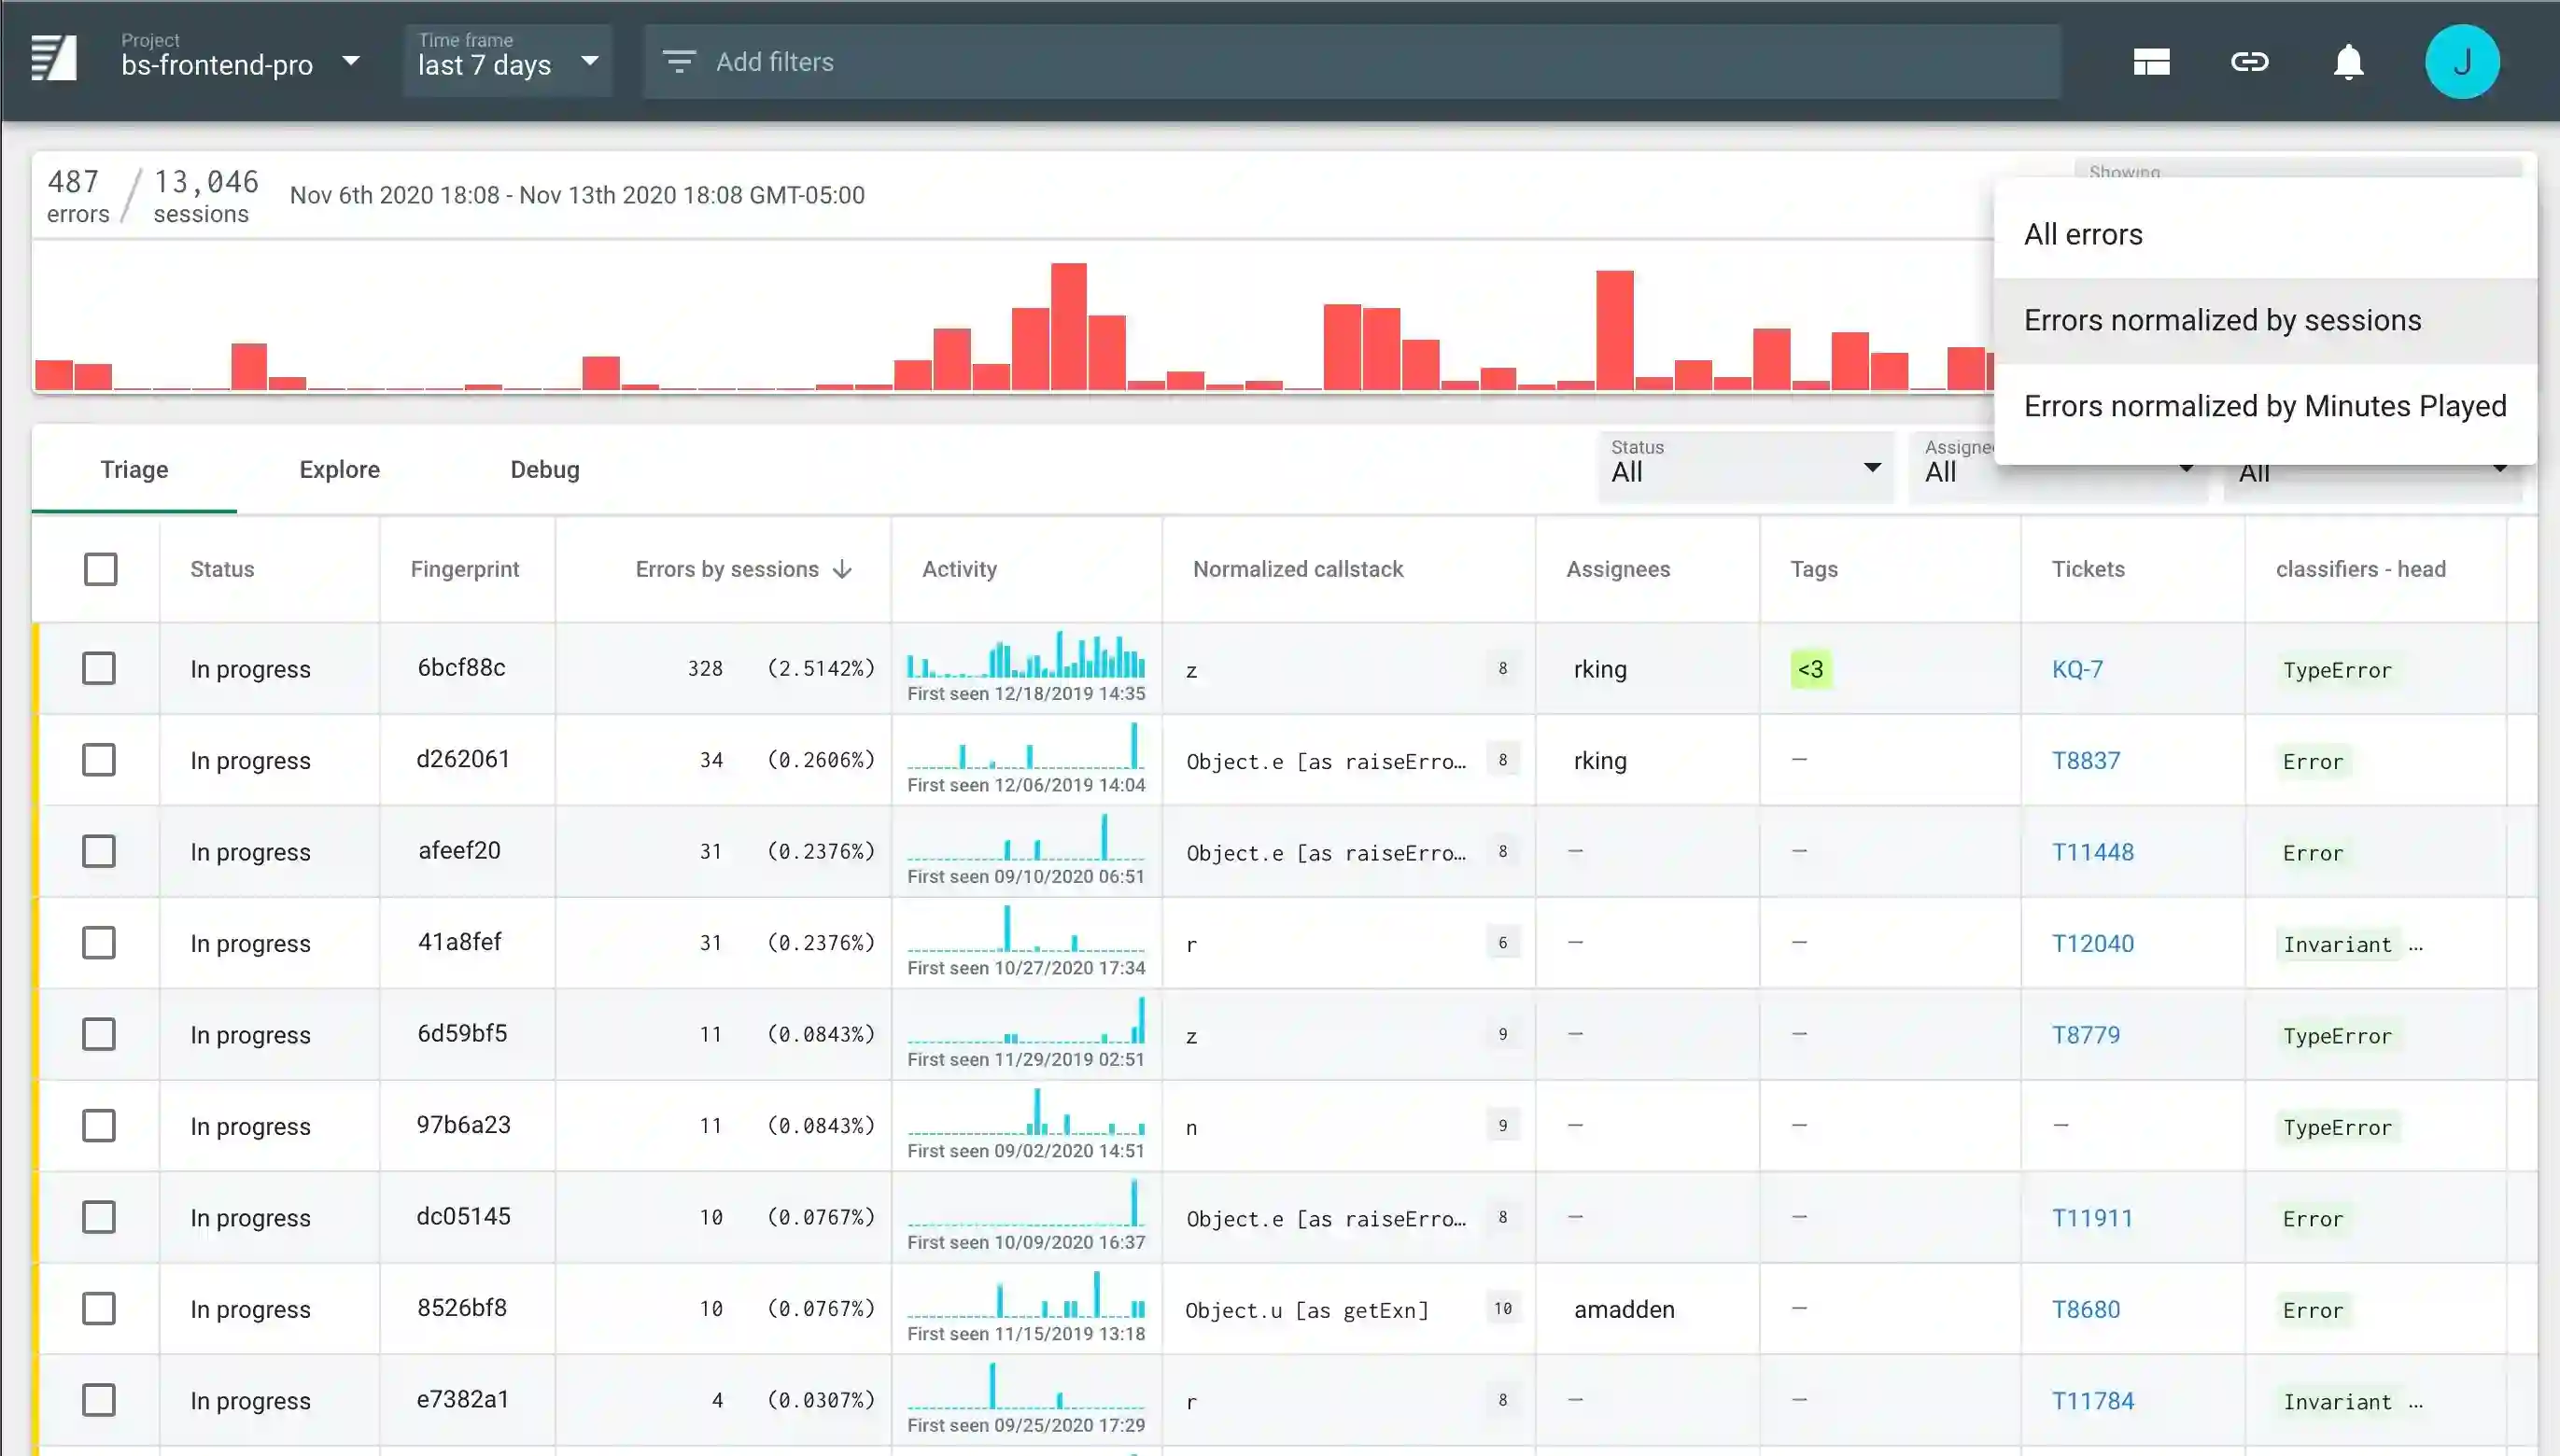
View Stability Scores
Once configured and populating, Stability Scores can be viewed in the Triage and Explore Views. You'll see a dropdown in the upper right for "Errors normalized by {metric group}".
Stability Scores in Triage
Below, we can see errors normalized by sessions started. The top bar graph now shows how many sessions were seen over the time period (last 7 days), and the Errors by Sessions columns shows what % of sessions were impacted by a particular fingerprint.
Stability Scores in Explore with Group By
When we defined the original metric group, we linked to an attribute (version), and then defined metrics and importers for getting the minutes played metric for each version. Now, when you use Explore and Group By version, the "Errors" column will show a % of sessions that have seen errors seen for that given version. It helps better see which versions are buggier than others.