Filter the Scope of Your Jobs Data
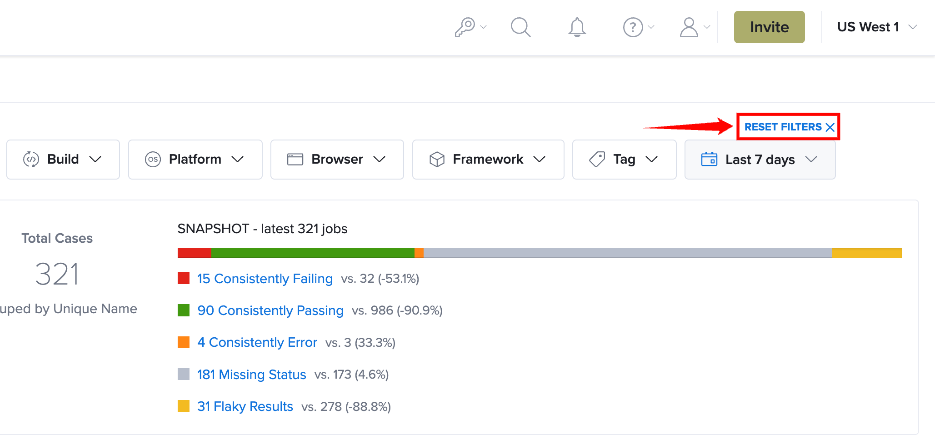
You can filter results by device type, organization, build, platform, browser, framework, tag, and reporting period. The selected filters are applied across all visualizations on the page, including Job Health Snapshot, Jobs Summary, and Jobs Breakdown.
Multiple filters can be applied simultaneously to display a specific subset of job execution data.
Filter Options
The following filters are available to refine the job execution data displayed on the Job Overview page.
| Ref. | Filter | Description |
|---|---|---|
| 1 | Device Type | Filters job execution data by the selected device type. Use this filter to display jobs executed on Virtual devices or Real device categories. |
| 2 | Scope | Filters job execution data by the selected scope. You can view jobs associated with My Jobs, My Organization, My Team, or a Service Account, depending on your available access. |
| 3 | Build | Filters job execution data by one or more application builds. Use this filter to analyze execution results for a specific build or release. |
| 4 | Platform | Filters job execution data by the selected operating system platform, such as Android, iOS, Windows, or macOS. |
| 5 | Browser | Filters job execution data by the selected browser, allowing you to analyze execution results for specific browser environments. |
| 6 | Framework | Filters job execution data by the selected test automation framework. |
| 7 | Tag | Filters job execution data by one or more tags associated with the test jobs. Use tags to narrow the displayed data to a specific feature, release, test suite, or other tagged group. |
| 8 | Date Range | Filters job execution data for the selected reporting period. All charts and metrics are updated to display data only for the specified timeframe. |
Reset Filters
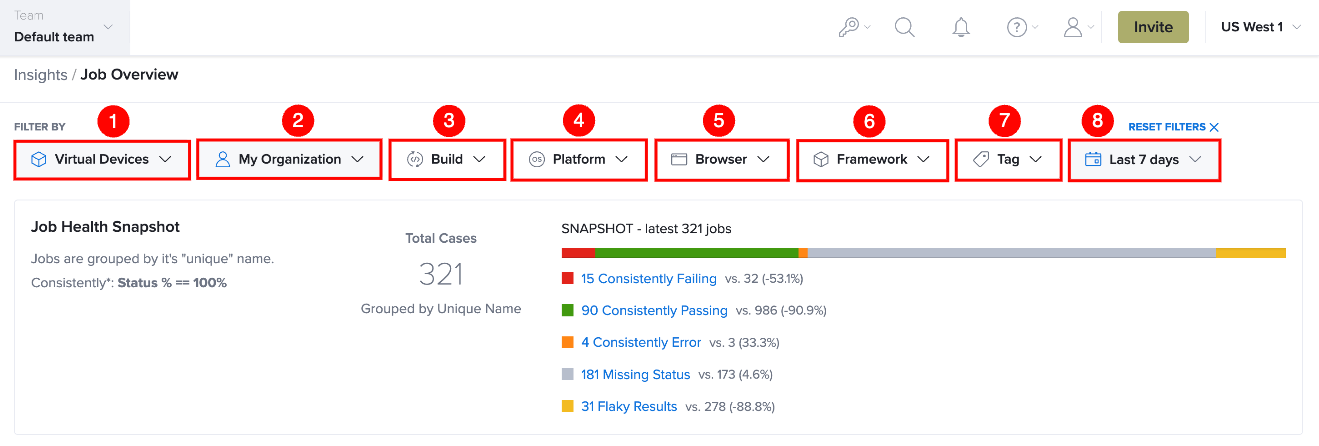
Use Reset Filters to remove all applied filters and restore the default filter settings. After the filters are reset, the Job Overview page refreshes to display job execution data using the default filter configuration.