Monitoring
Sauce Connect Proxy provides server-side monitoring via the REST API and the Sauce Labs web application as well as the client-side monitoring via the local API server and Prometheus metrics.
Sauce Labs Web UI
You can manage and monitor all Sauce Connect Proxy tunnel activity from the Sauce Labs Tunnels page, which displays useful information, such as the number of active tunnels, tunnel status, and specific attributes for each tunnel. You can also check the health of an individual tunnel by running a test on it.
| Column | Description |
|---|---|
| Type | The icon shows whether the tunnel is a Sauce Connect Proxy, or an IPSec Proxy. |
| State | The icon shows whether the tunnel is running or stopped. |
| Tunnel Name | The name of the tunnel. This is the --tunnel-name used when starting the Sauce Connect tunnel. |
| Client Hostname | The name of the machine where the Sauce Connect Proxy client is running. |
| Owner | The name of the account that is running the tunnel. |
| Sharing | Indicates whether or not the tunnel is shared. |
| Duration | The amount of time the tunnel has been running. |
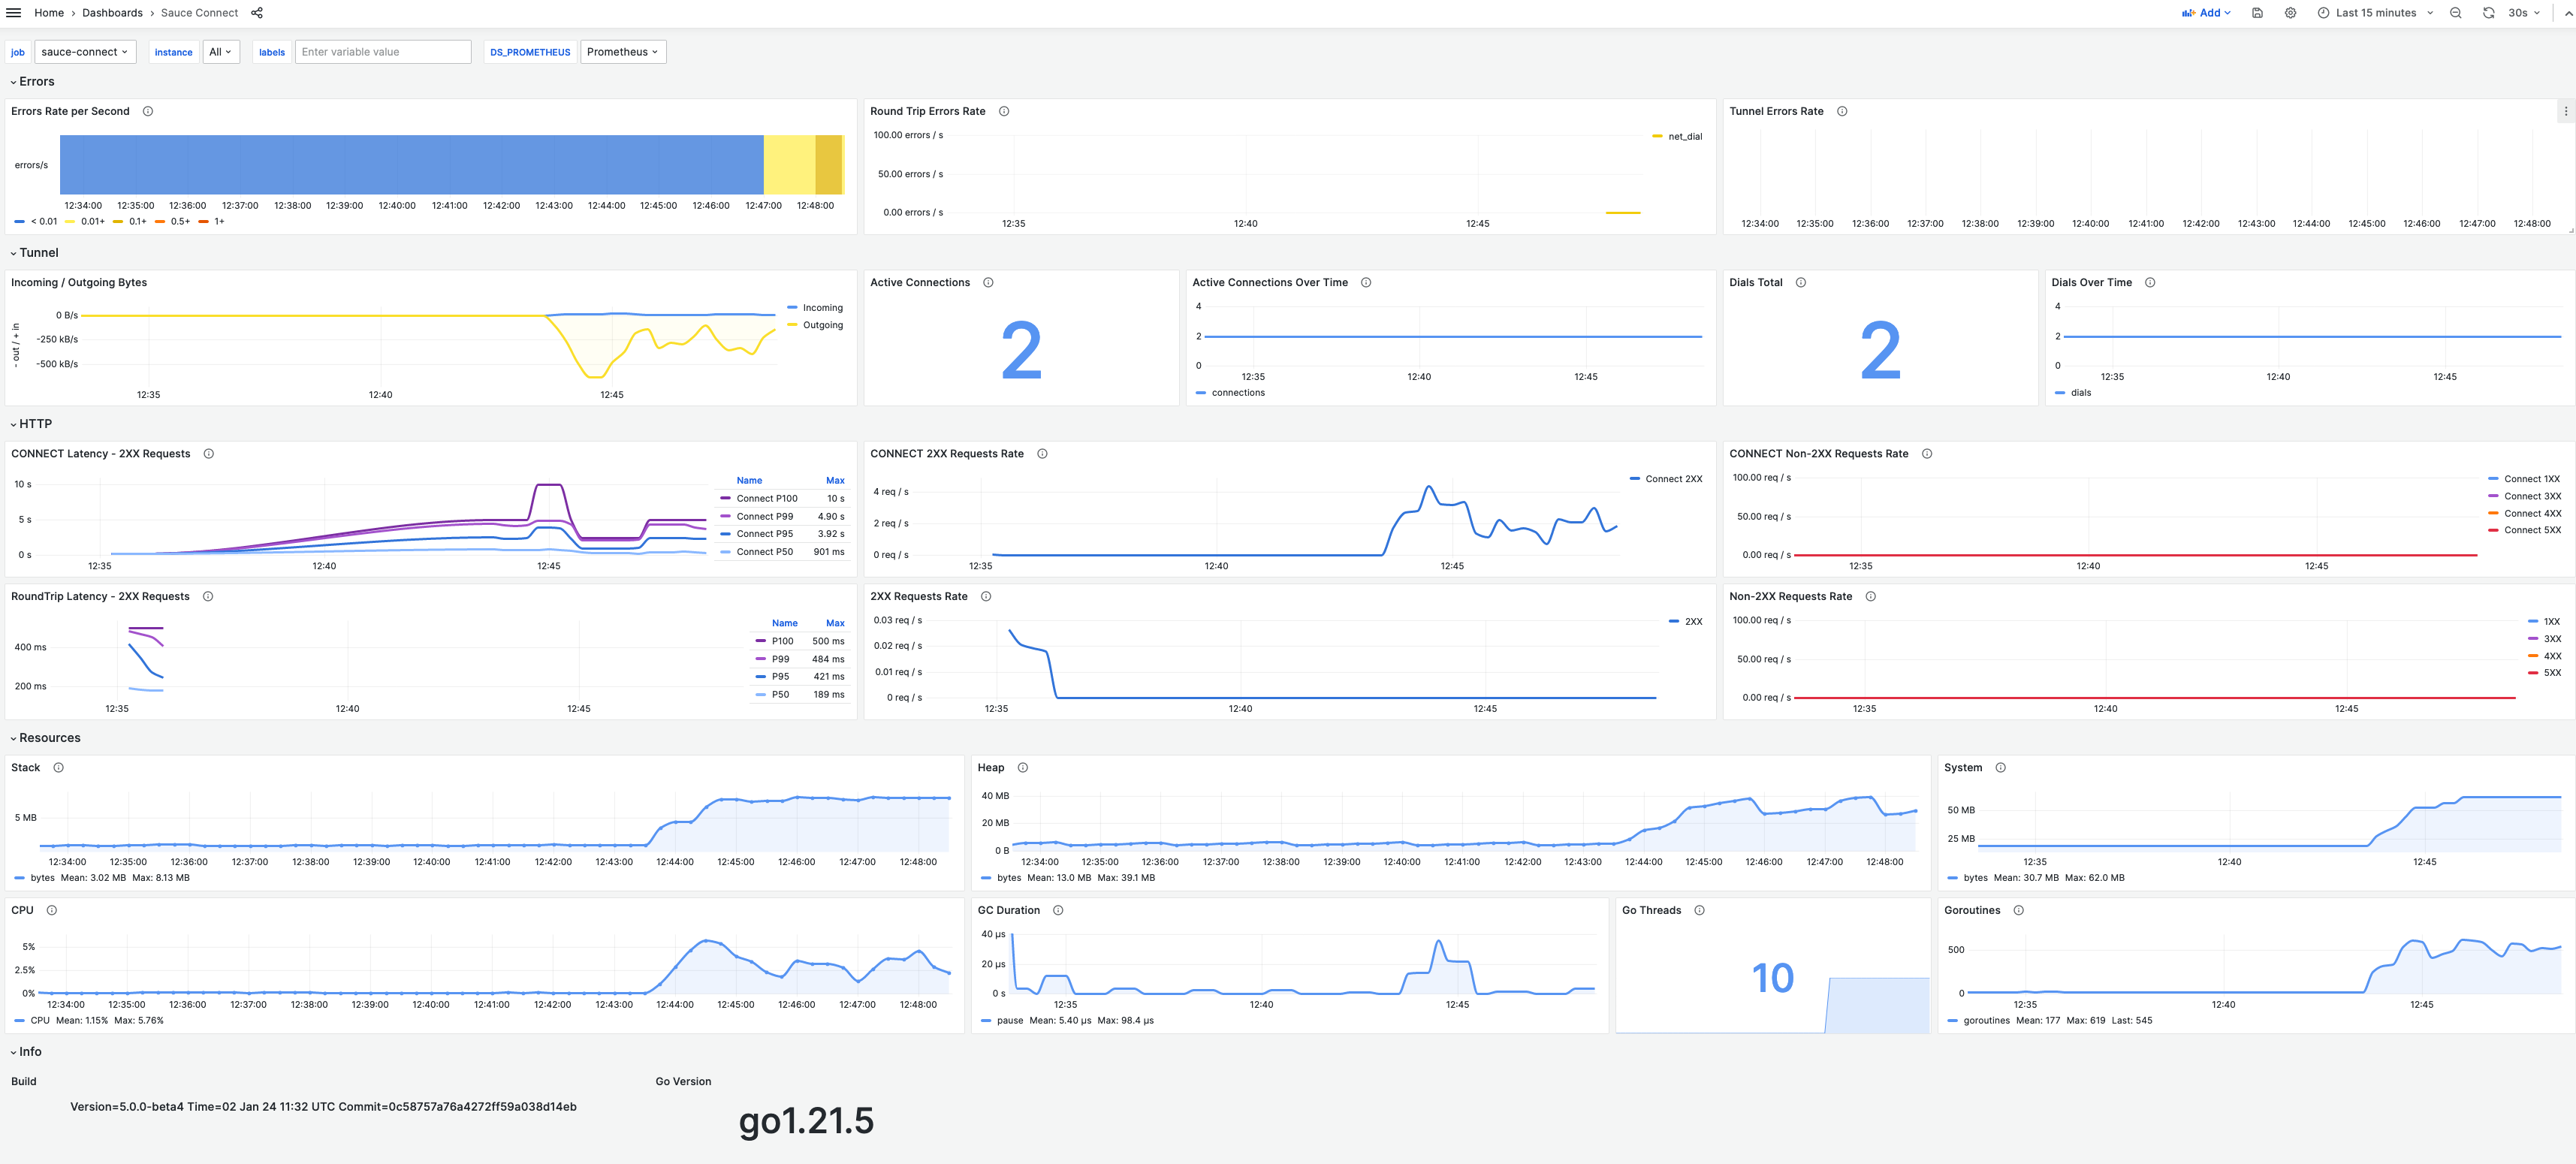
Grafana Dashboard
Prometheus can be used to monitor Sauce Connect Proxy.
The /mertics endpoint is available on the local API server.
Note that the API server must be enabled with the --api-address option, and by default it's disabled.
Grafana dashboard using these metrics is available at Grafana Dashboards. See this demo for an example of running Sauce Connect Proxy along with Prometheus server and Grafana dashboard.
Prometheus Metrics
The following metrics are available:
sauce_connect_dialer_closed_total
Number of closed connections
Labels:
- host
sauce_connect_dialer_dialed_total
Number of dialed connections
Labels:
- host
sauce_connect_dialer_errors_total
Number of dialer errors
Labels:
- host
sauce_connect_errors_total
Number of errors
Labels:
- name
sauce_connect_http_request_duration_seconds
The HTTP request latencies in seconds.
Labels:
- code
- method
sauce_connect_http_request_size_bytes
The HTTP request sizes in bytes.
Labels:
- code
- method
sauce_connect_http_requests_in_flight
Current number of HTTP requests being served.
Labels:
- method
sauce_connect_http_requests_total
Total number of HTTP requests processed.
Labels:
- code
- method
sauce_connect_http_response_size_bytes
The HTTP response sizes in bytes.
Labels:
- code
- method
sauce_connect_process_cpu_seconds_total
Total user and system CPU time spent in seconds.
sauce_connect_process_max_fds
Maximum number of open file descriptors.
sauce_connect_process_open_fds
Number of open file descriptors.
sauce_connect_process_resident_memory_bytes
Resident memory size in bytes.
sauce_connect_process_start_time_seconds
Start time of the process since unix epoch in seconds.
sauce_connect_process_virtual_memory_bytes
Virtual memory size in bytes.
sauce_connect_process_virtual_memory_max_bytes
Maximum amount of virtual memory available in bytes.
sauce_connect_proxy_errors_total
Number of proxy errors
Labels:
- reason
sauce_connect_tunnel_closed_idle_total
Total number of connections closed due to inactivity.
sauce_connect_tunnel_connections_total
Total number of connections.
sauce_connect_tunnel_dialer_closed_total
Number of closed connections
Labels:
- host
sauce_connect_tunnel_dialer_dialed_total
Number of dialed connections
Labels:
- host
sauce_connect_tunnel_dialer_errors_total
Number of dialer errors
Labels:
- host
sauce_connect_tunnel_errors_total
Total number of errors by type.
Labels:
- type
sauce_connect_tunnel_info
Information about Sauce Connect tunnel, value is always 1
Labels:
- addr
- hostname
- id
- name
sauce_connect_tunnel_received_bytes
Total number of bytes received.
Labels:
- conn
sauce_connect_tunnel_sent_bytes
Total number of bytes sent.
Labels:
- conn
sauce_connect_version
Sauce Connect Proxy version, value is always 1
Labels:
- commit
- time
- version
go_gc_duration_seconds
A summary of the pause duration of garbage collection cycles.
go_goroutines
Number of goroutines that currently exist.
go_info
Information about the Go environment.
Labels:
- version
go_memstats_alloc_bytes
Number of bytes allocated and still in use.
go_memstats_alloc_bytes_total
Total number of bytes allocated, even if freed.
go_memstats_buck_hash_sys_bytes
Number of bytes used by the profiling bucket hash table.
go_memstats_frees_total
Total number of frees.
go_memstats_gc_sys_bytes
Number of bytes used for garbage collection system metadata.
go_memstats_heap_alloc_bytes
Number of heap bytes allocated and still in use.
go_memstats_heap_idle_bytes
Number of heap bytes waiting to be used.
go_memstats_heap_inuse_bytes
Number of heap bytes that are in use.
go_memstats_heap_objects
Number of allocated objects.
go_memstats_heap_released_bytes
Number of heap bytes released to OS.
go_memstats_heap_sys_bytes
Number of heap bytes obtained from system.
go_memstats_last_gc_time_seconds
Number of seconds since 1970 of last garbage collection.
go_memstats_lookups_total
Total number of pointer lookups.
go_memstats_mallocs_total
Total number of mallocs.
go_memstats_mcache_inuse_bytes
Number of bytes in use by mcache structures.
go_memstats_mcache_sys_bytes
Number of bytes used for mcache structures obtained from system.
go_memstats_mspan_inuse_bytes
Number of bytes in use by mspan structures.
go_memstats_mspan_sys_bytes
Number of bytes used for mspan structures obtained from system.
go_memstats_next_gc_bytes
Number of heap bytes when next garbage collection will take place.
go_memstats_other_sys_bytes
Number of bytes used for other system allocations.
go_memstats_stack_inuse_bytes
Number of bytes in use by the stack allocator.
go_memstats_stack_sys_bytes
Number of bytes obtained from system for stack allocator.
go_memstats_sys_bytes
Number of bytes obtained from system.
go_threads
Number of OS threads created.