Sauce Connect Proxy Monitoring
Sauce Connect Proxy provides server-side monitoring via the REST API and the Sauce Labs web application as well as the client-side monitoring via the local API server and Prometheus metrics.
Sauce Labs Web UI
You can manage and monitor all Sauce Connect Proxy tunnel activity from the Sauce Labs Tunnels page, which displays useful information, such as the number of active tunnels, tunnel status, and specific attributes for each tunnel. You can also check the health of an individual tunnel by running a test on it.
| Column | Description |
|---|---|
| Type | The icon shows whether the tunnel is a Sauce Connect Proxy, or an IPSec Proxy. |
| State | The icon shows whether the tunnel is running or stopped. |
| Tunnel Name | The name of the tunnel. This is the --tunnel-name used when starting the Sauce Connect tunnel. |
| Client Hostname | The name of the machine where the Sauce Connect Proxy client is running. |
| Owner | The name of the account that is running the tunnel. |
| Sharing | Indicates whether or not the tunnel is shared. |
| Duration | The amount of time the tunnel has been running. |
Local API Server
See Sauce Connect Proxy API Server.
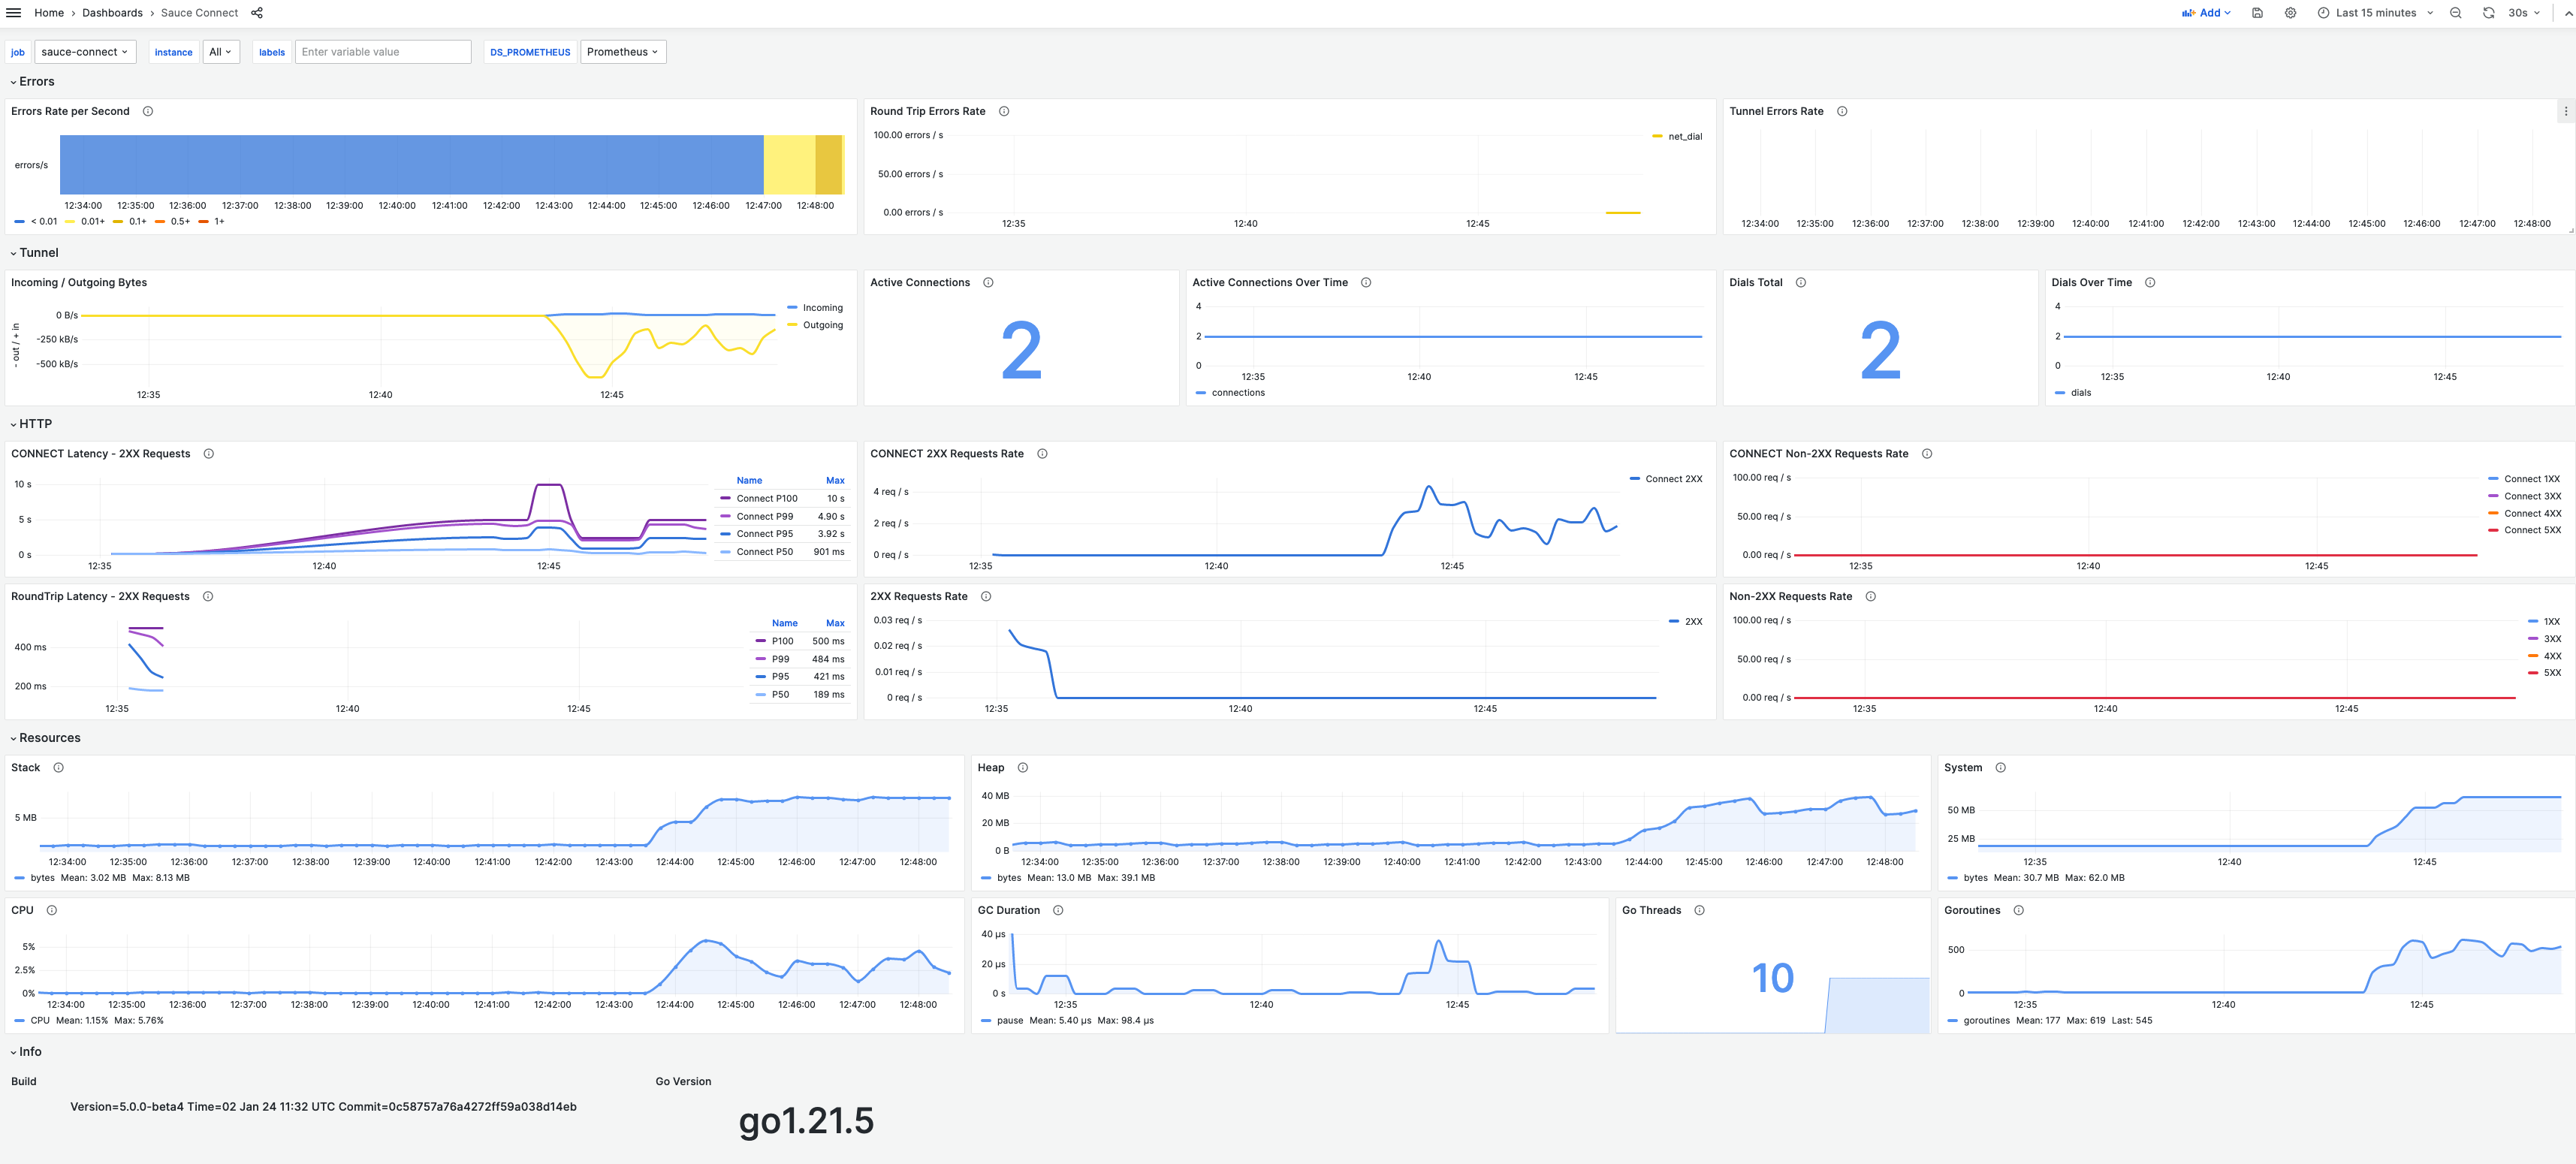
Prometheus metrics
Prometheus metrics could be used to monitor Sauce Connect Proxy traffic. Grafana dashboard using these metrics is available at Grafana Dashboards.
See this demo for an example of running Sauce Connect Proxy along with Prometheus server and Grafana dashboard.