Error Volume Trends
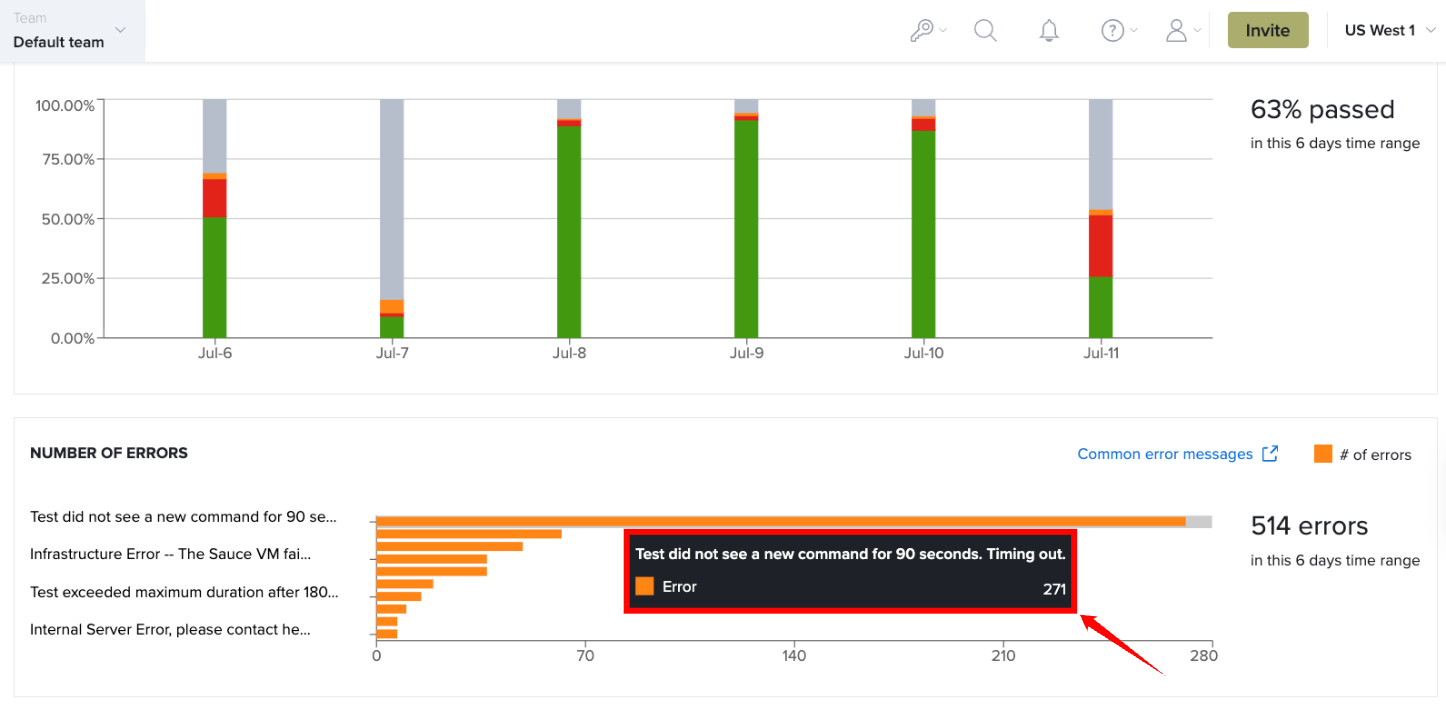
The Error Volume visualization displays the number of test errors that occurred during the selected time period. It helps you identify when errors occur, monitor error trends over time, and investigate periods with increased test failures.
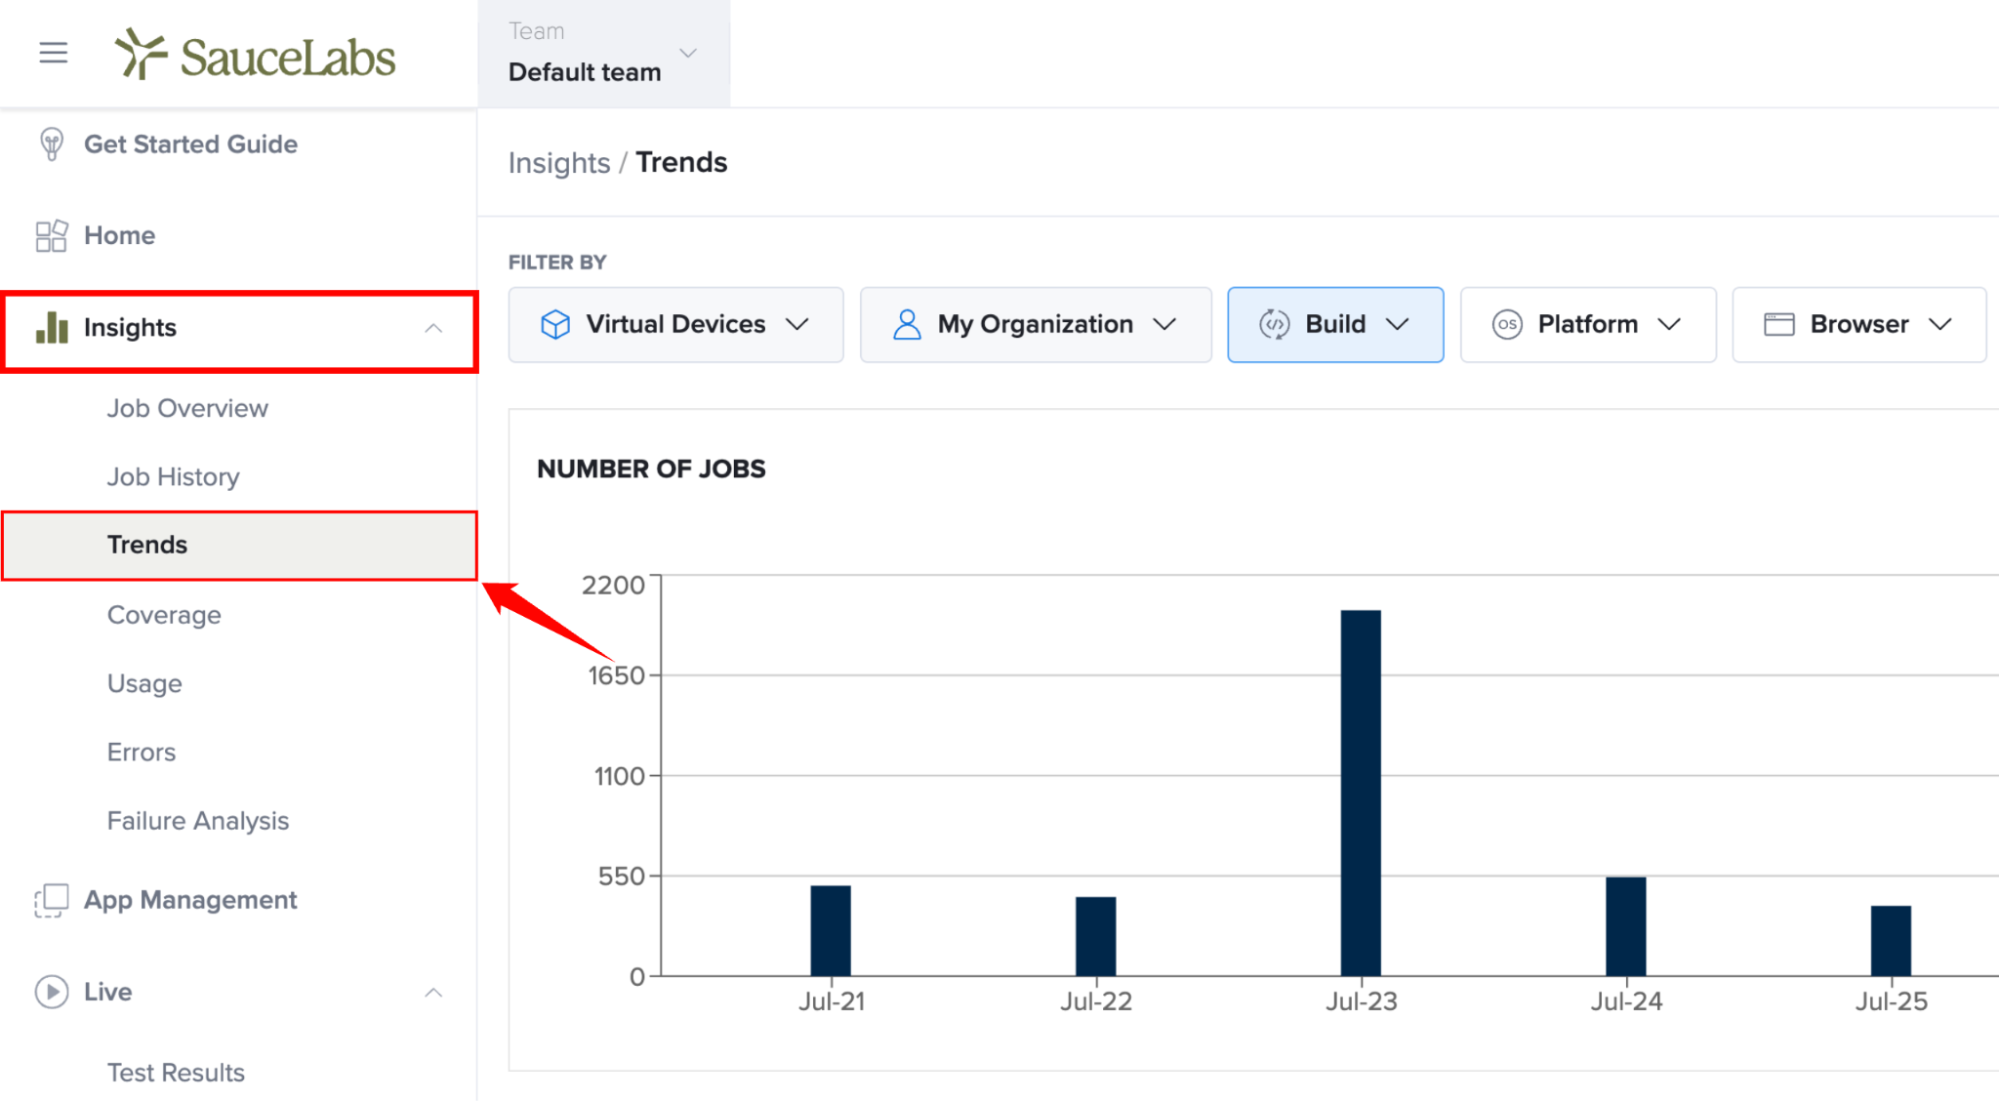
Step 1: Inside your Sauce Labs account, from the left-hand navigation menu, expand Insights, and then select Trends.
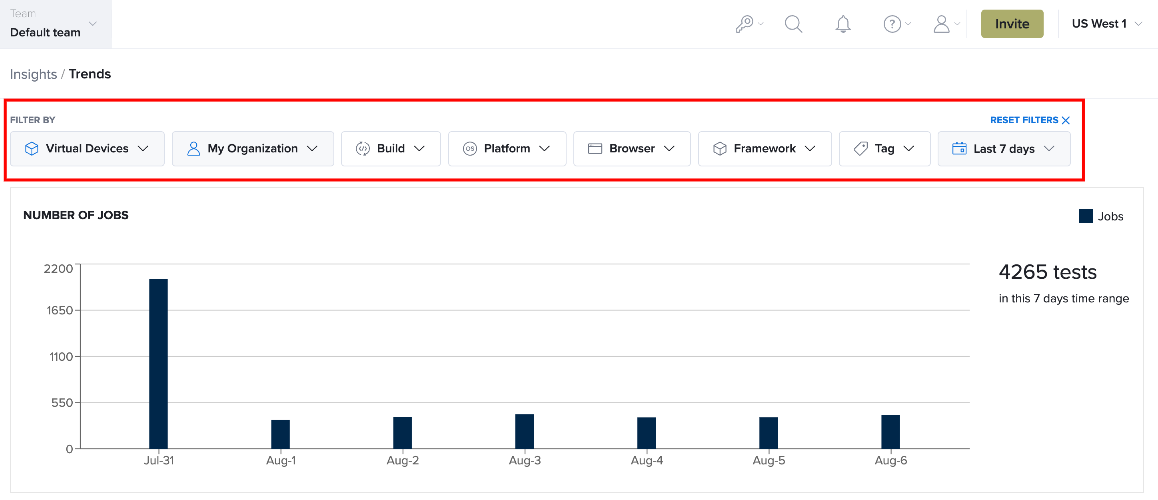
Step 2: Configure the required filters to display the test data you want to analyse. For more information, see Filter Controls for Trends.
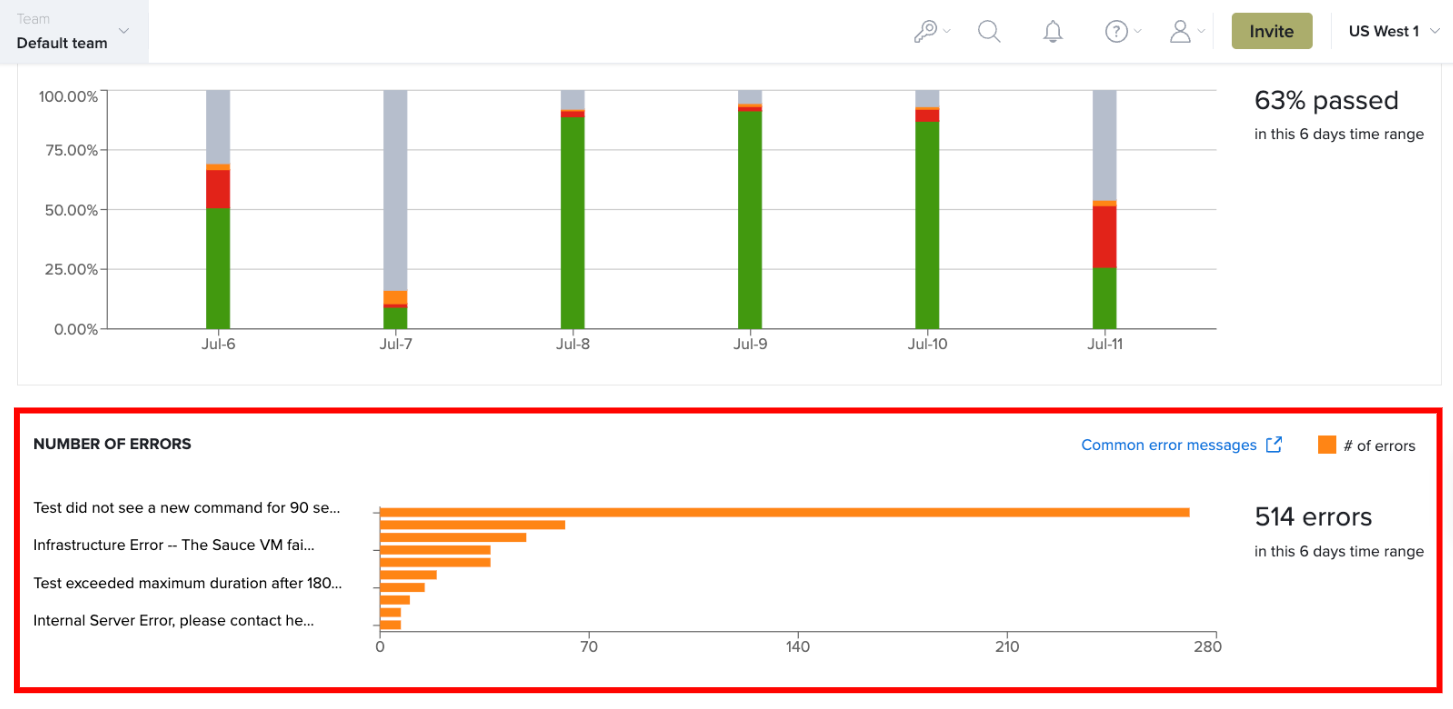
The Error Volume graph displays the total number of test errors for each reporting interval in the selected time period.
View Error Details
Hover over any bar in the Error Volume graph to view detailed information for the selected reporting interval. The tooltip displays the reporting date along with the number of errors that occurred during that interval.
This allows you to quickly identify periods with increased test errors without changing the selected time range.