Job Volume Trends
The Job Volume visualization displays the number of tests executed during a selected time period. It helps you monitor test execution activity, identify trends, and understand changes in testing volume over time. The graph automatically adjusts its reporting intervals based on the selected time range, providing a clear view of testing activity across both short and long periods.
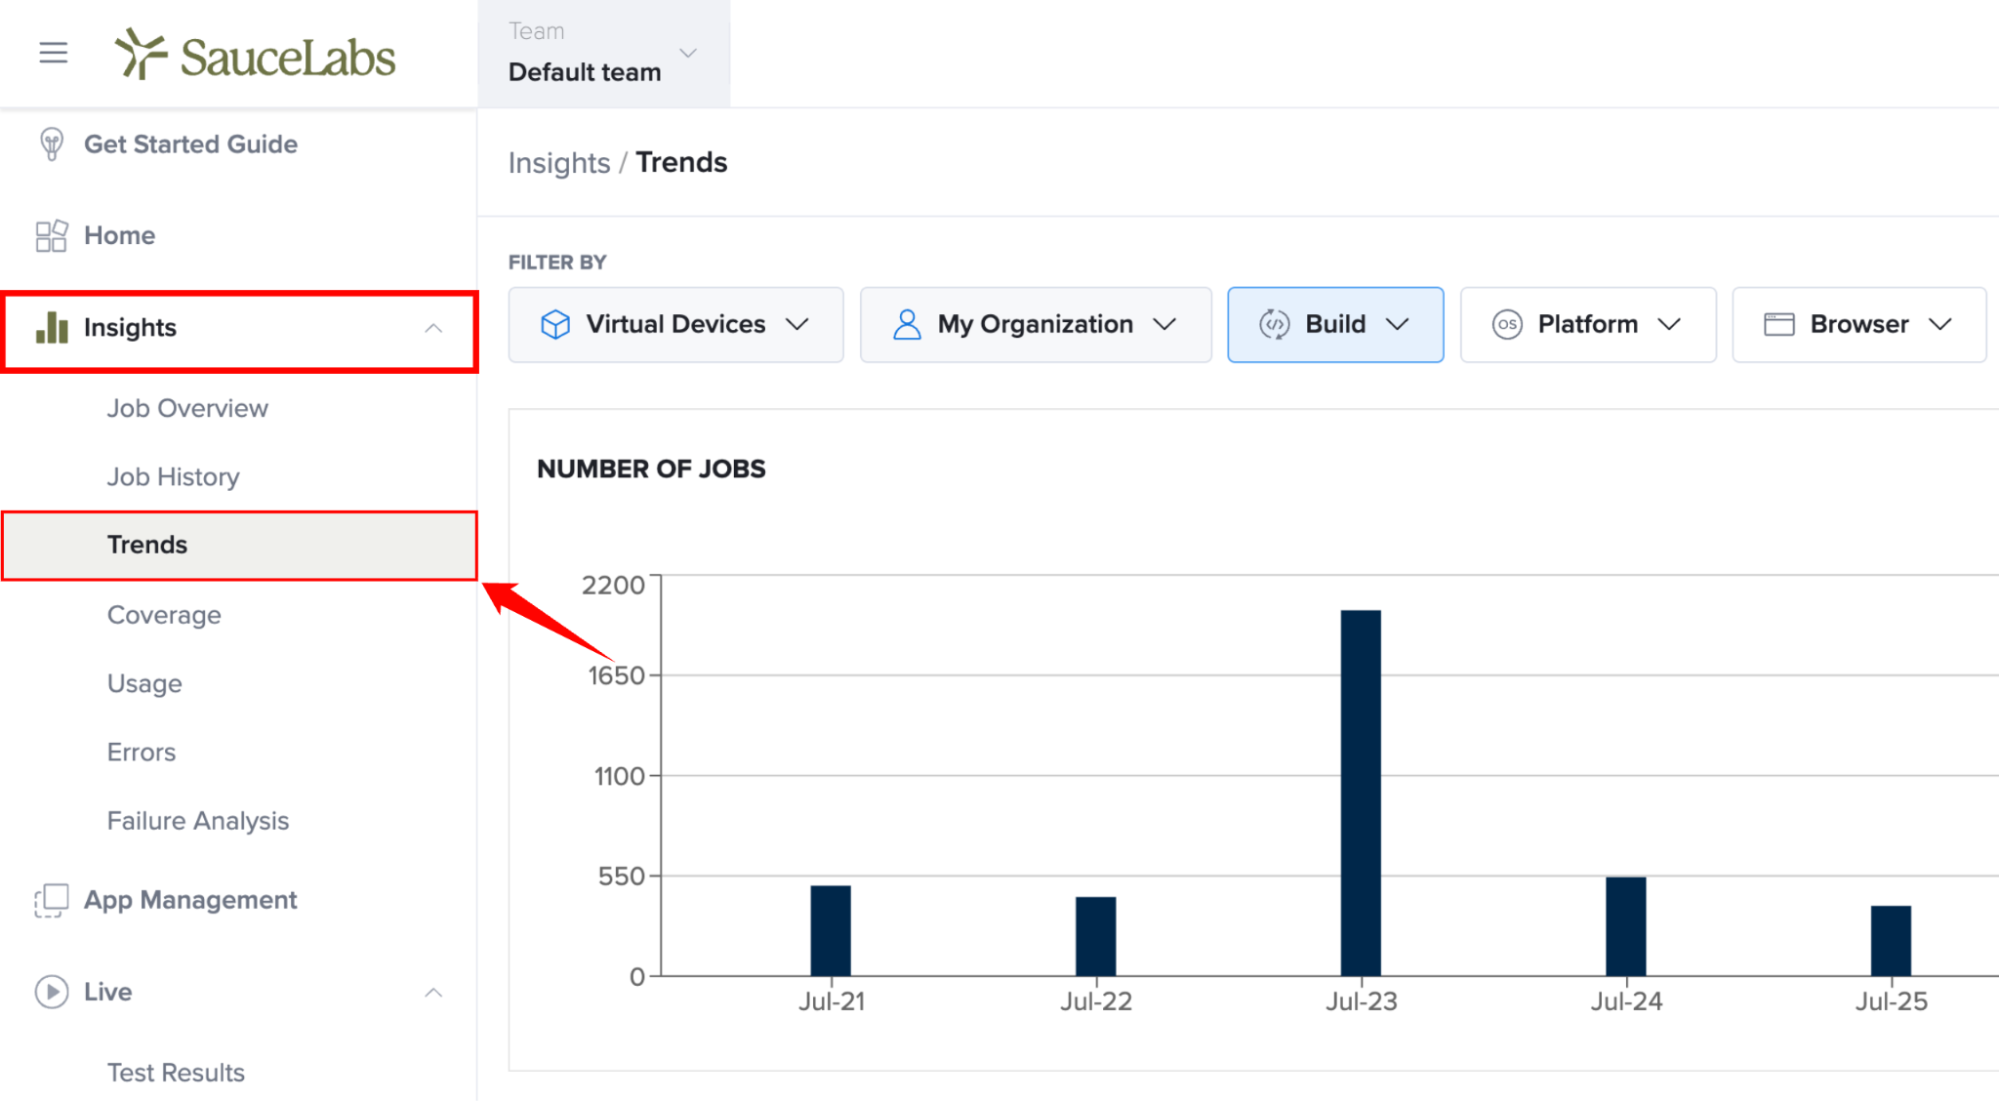
Step 1: Inside your Sauce Labs account, from the left-hand navigation menu, expand Insights, and then select Trends.
The Trends page displays several visualizations that provide an overview of your test execution activity over time.
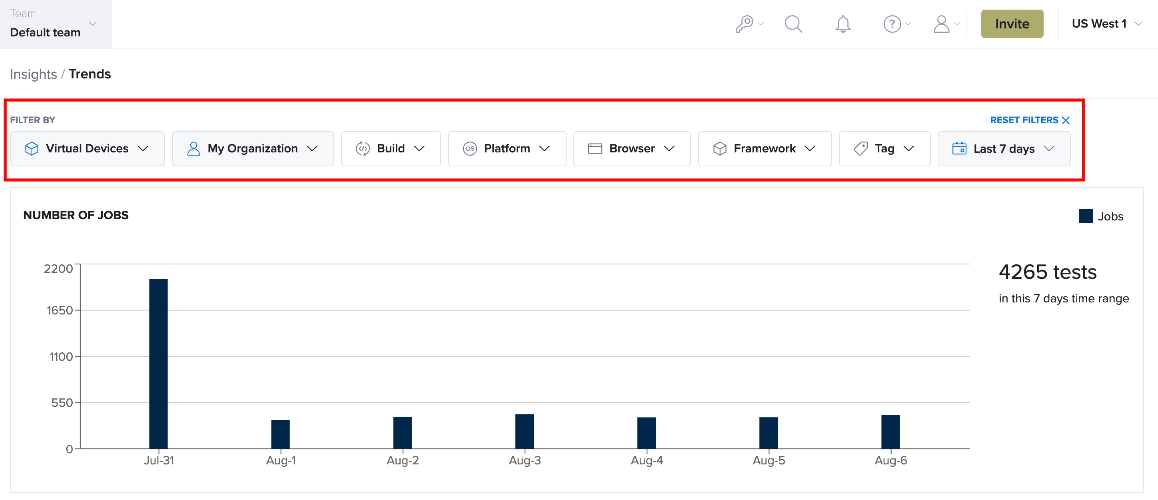
Step 2: Configure the filters to display the data you want to analyse. You can filter results by owner, build, browser, operating system, device, framework, tag, and time period.
For more information about the available filters and how to use them, see Filter Controls for Trends.
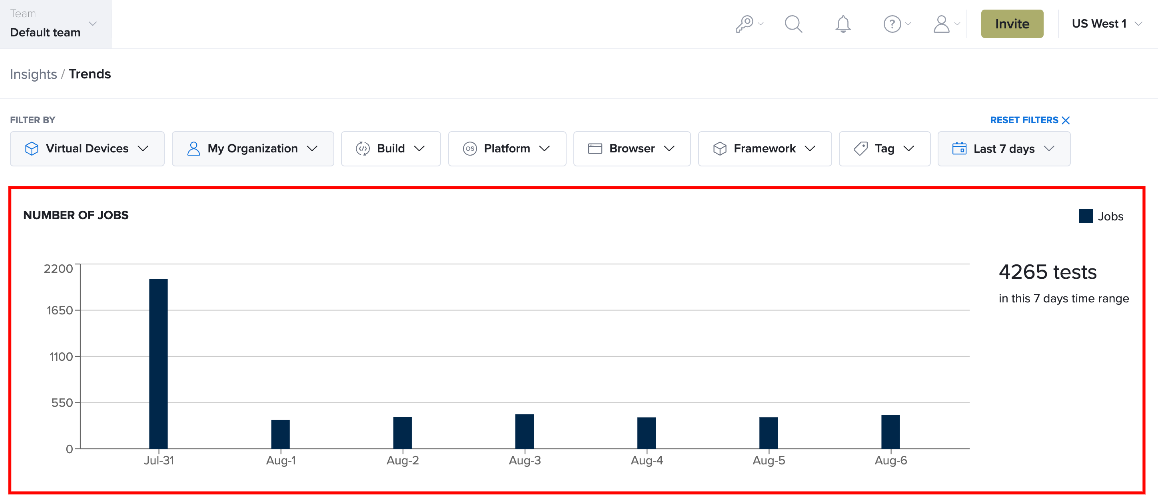
Step 3: After applying the required filters, review the Job Volume graph. The visualization automatically refreshes and displays the total number of test jobs executed during the selected time period.
Each bar represents the number of jobs executed in a specific reporting interval.
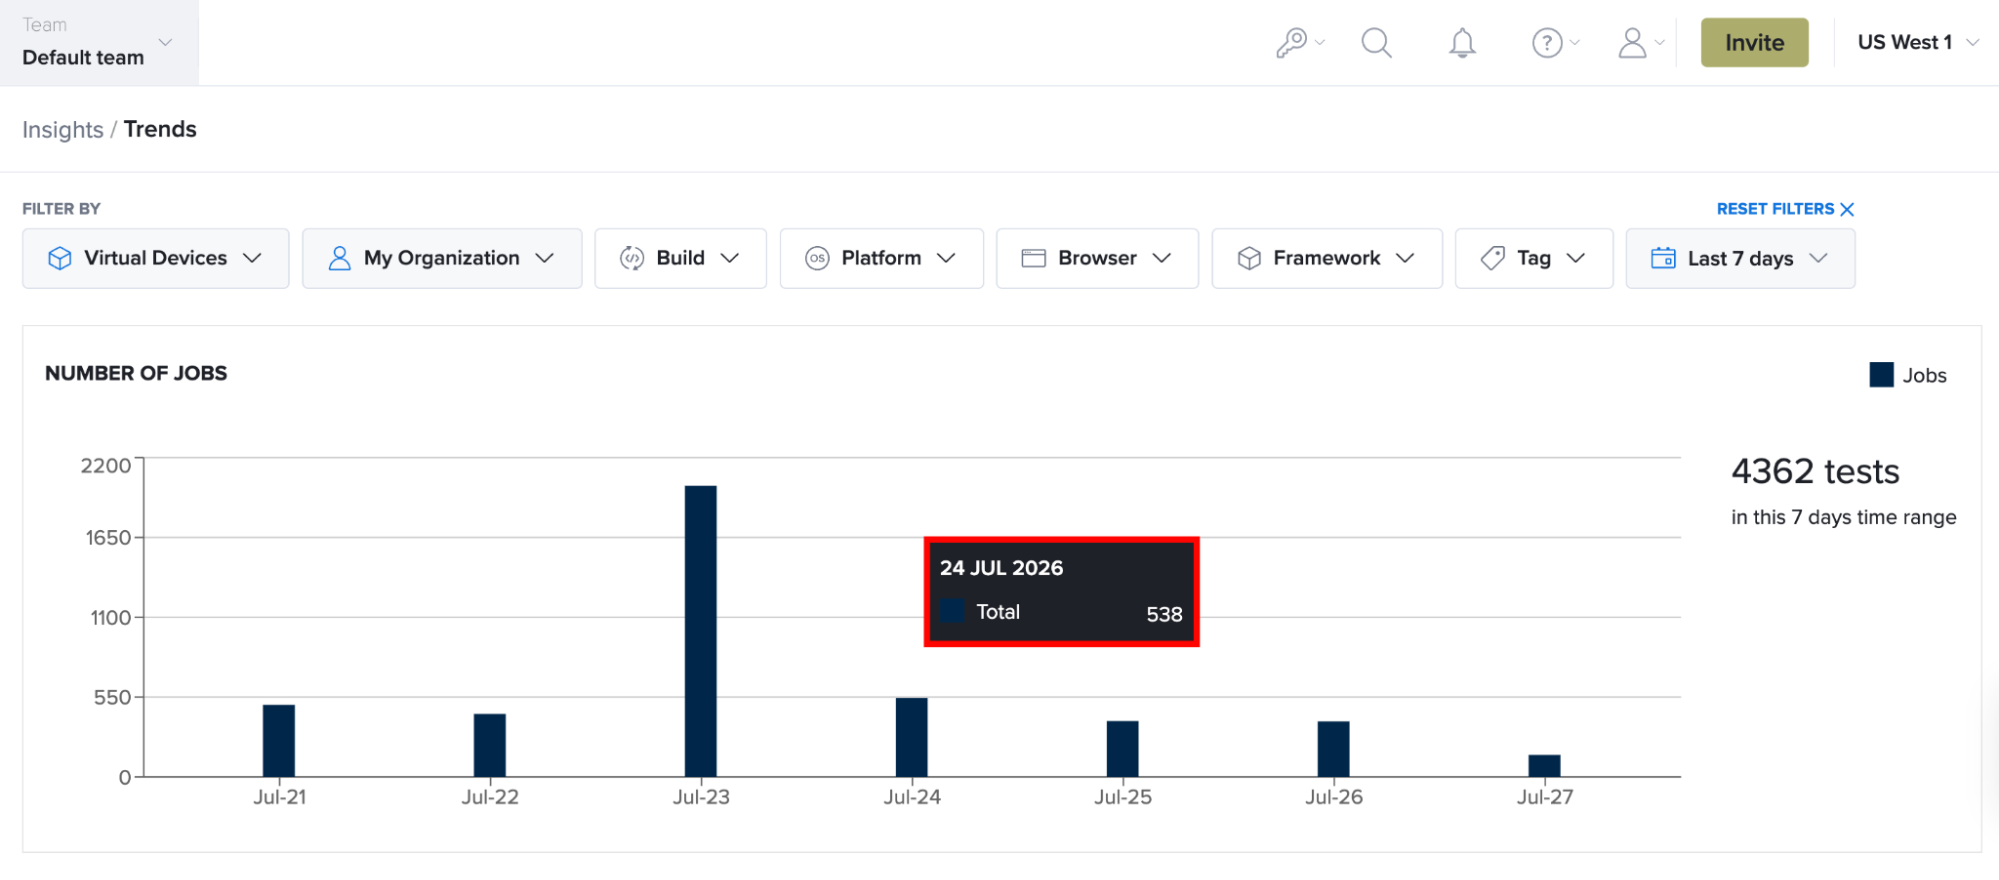
Step 4: Hover over any bar in the graph to view additional details for that reporting interval, including the total number of jobs executed and the corresponding date and time range.
View Detailed Trend Data
You can analyse test execution activity for a specific period by selecting a time range directly from the graph. This allows you to focus on the selected interval and investigate trends in greater detail.
To zoom into a specific period:
Step 1: In the Job Volume graph, click and hold the mouse button, drag across the desired time range, and then release the mouse button to zoom into the selected interval.
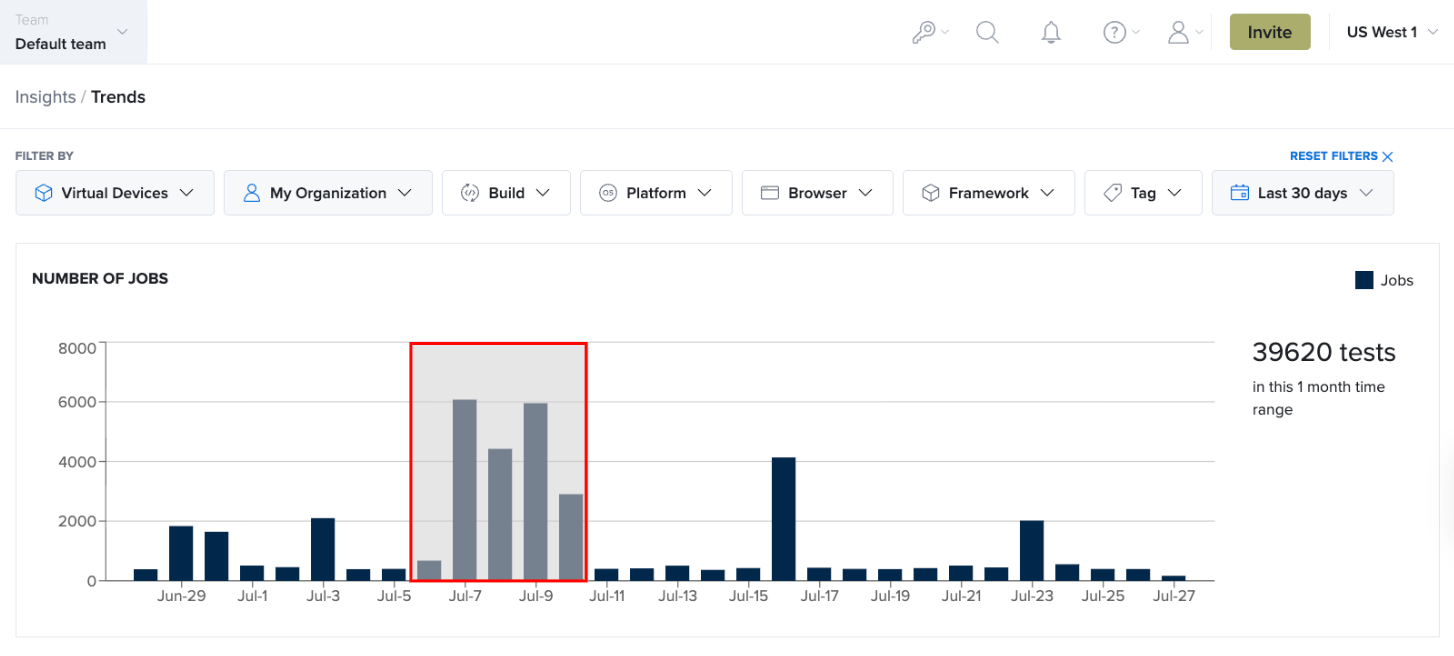
The graph automatically zooms into the selected time range and updates the displayed data, allowing you to analyse test execution activity in greater detail without manually adjusting the date range.
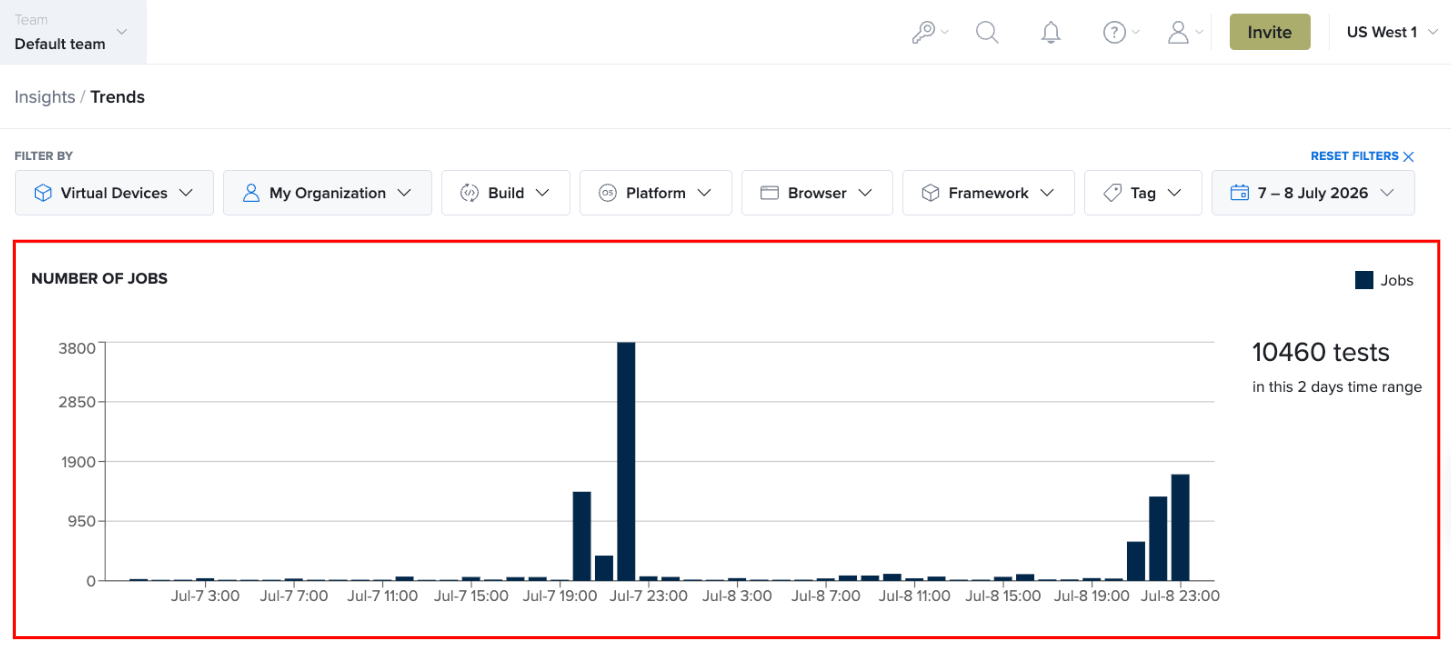
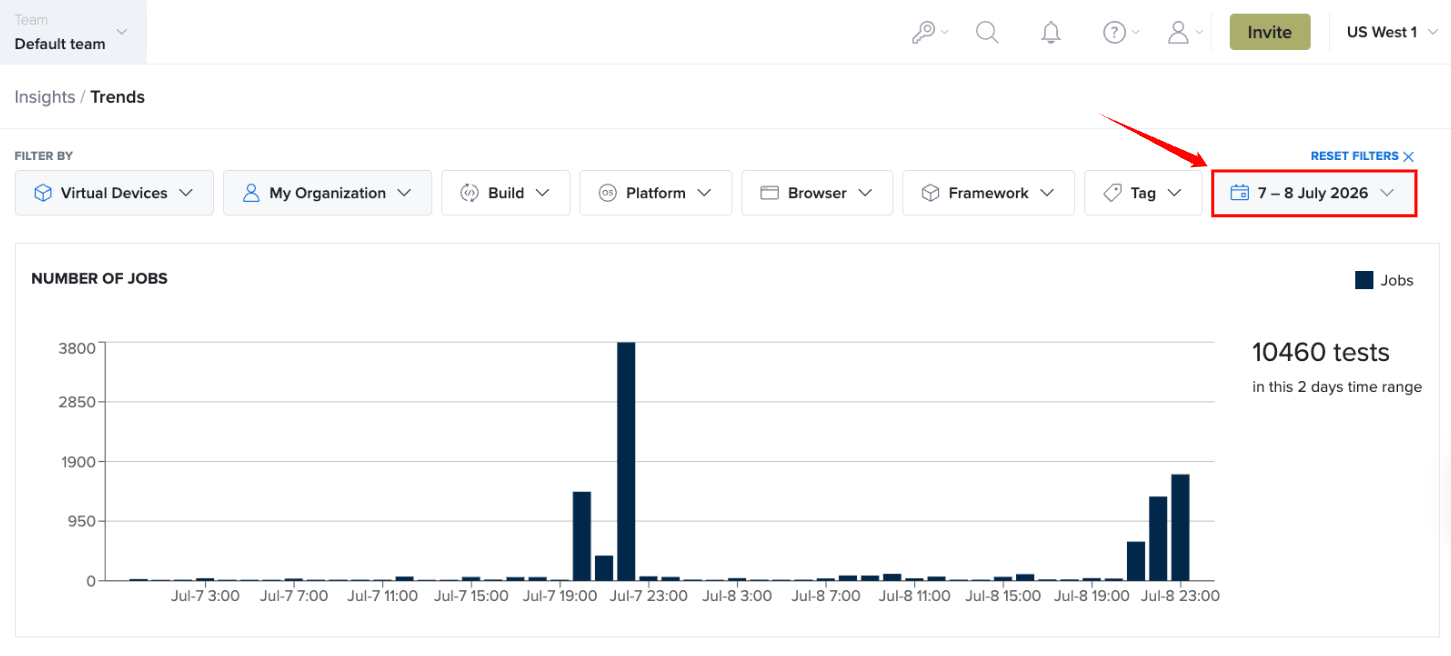
Step 2: To return to a broader view, adjust the Time Period filter or select a different date range. The Job Volume graph automatically updates to display the number of tests executed during the selected period.
Analyse Testing Activity
Job Volume Trends help you understand how testing activity changes over time.
For example, you may observe:
-
Increased test execution after introducing a new release or feature.
-
Reduced activity during weekends or scheduled maintenance windows.
-
Periodic spikes caused by nightly regression suites.
-
Sudden drops that may indicate CI/CD pipeline failures or scheduling issues.
-
Increased execution volume before major product releases.
Monitoring these trends helps verify that automated tests are executing as expected and allows you to identify unusual testing behaviour before it impacts release quality.