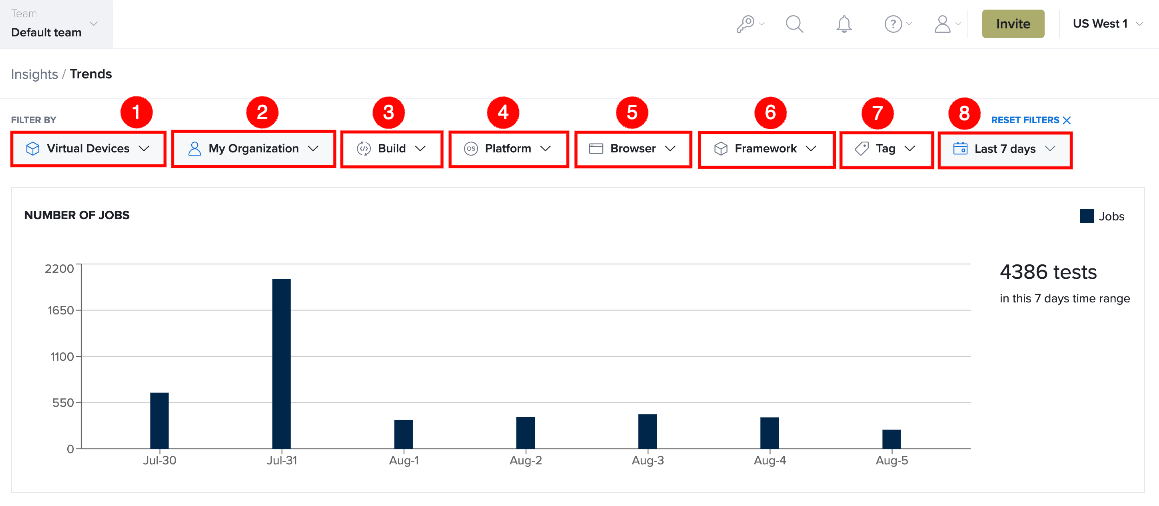
Filter Controls for Trends
Use the filters at the top of the Trends page to narrow the displayed analytics and focus on specific test execution data. You can filter results by device type, scope, build, platform, browser, framework, tag, and reporting period. The selected filters are applied across all visualizations on the page, including Number of Jobs, Pass/Fail Rate, Number of Errors, and Build and Job Statistics.
Multiple filters can be applied simultaneously to display a specific subset of test execution data, making it easier to analyze trends, compare environments, and investigate specific test results.
Filter Options
The following filters are available to refine the analytics displayed on the Trends page.
| Ref. | Filter | Description |
|---|---|---|
| 1 | Device Type | Filters trend data by the selected testing environment. Use this filter to display analytics for tests executed on Virtual Devices or Real Devices. |
| 2 | Scope | Filters trend data by the selected scope. Depending on your access permissions, you can view analytics for My Jobs, My Organization, My Team, or a Service Account. |
| 3 | Build | Filters trend data by one or more Build IDs. Use this filter to analyze trends for a specific application build, release, or CI/CD pipeline execution. |
| 4 | Platform | Filters trend data by the selected operating system platform, such as Android, iOS, Windows, macOS, or other supported platforms. |
| 5 | Browser | Filters trend data by the selected browser and browser version. This filter is available only when Virtual Devices is selected. |
| 6 | Framework | Filters trend data by the selected test automation framework, allowing you to analyze trends for specific testing technologies such as Appium, Cypress, Playwright, Espresso, or WebDriver. |
| 7 | Tag | Filters trend data by one or more tags associated with test executions. Tags can be used to focus the analytics on a specific feature, release, branch, test suite, or any other tagged group. The Tag filter also supports Match Any, Match All, and Exclude matching options. |
| 8 | Date Range | Filters trend data for the selected reporting period. Available options include predefined date ranges such as Today, Last 7 Days, Last 14 Days, Last 30 Days, and All Time. All charts and statistics are updated to display data only for the selected timeframe. |
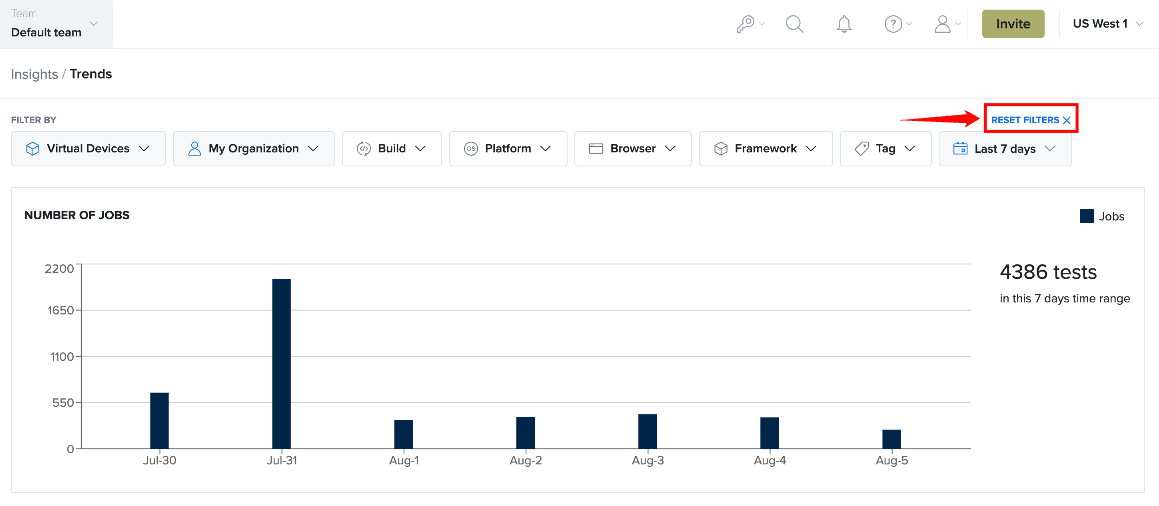
Reset Filters
Use Reset Filters to remove all applied filters and restore the default filter configuration. After the filters are reset, the Trends page refreshes, and all charts and statistics display data using the default filter settings.
Compare Test Results Between Chrome 150.0 and Chrome 151.0
To evaluate the impact of a browser update on your automated tests, apply filters to compare test execution data for different browser versions over the same reporting period. This helps determine whether changes in browser behavior have affected test execution, pass rates, or overall stability.
Chrome 150.0
The Chrome 150.0 filter shows 346 test executions during the selected seven-day period, with an overall 26% pass rate.
Most test executions occurred on July 30 and July 31, while only a small number of tests were executed during the remaining days. The Pass/Fail Rate visualization shows a combination of Passed, Failed, and Completed test executions, indicating that many tests finished without reporting a definitive pass or fail status.
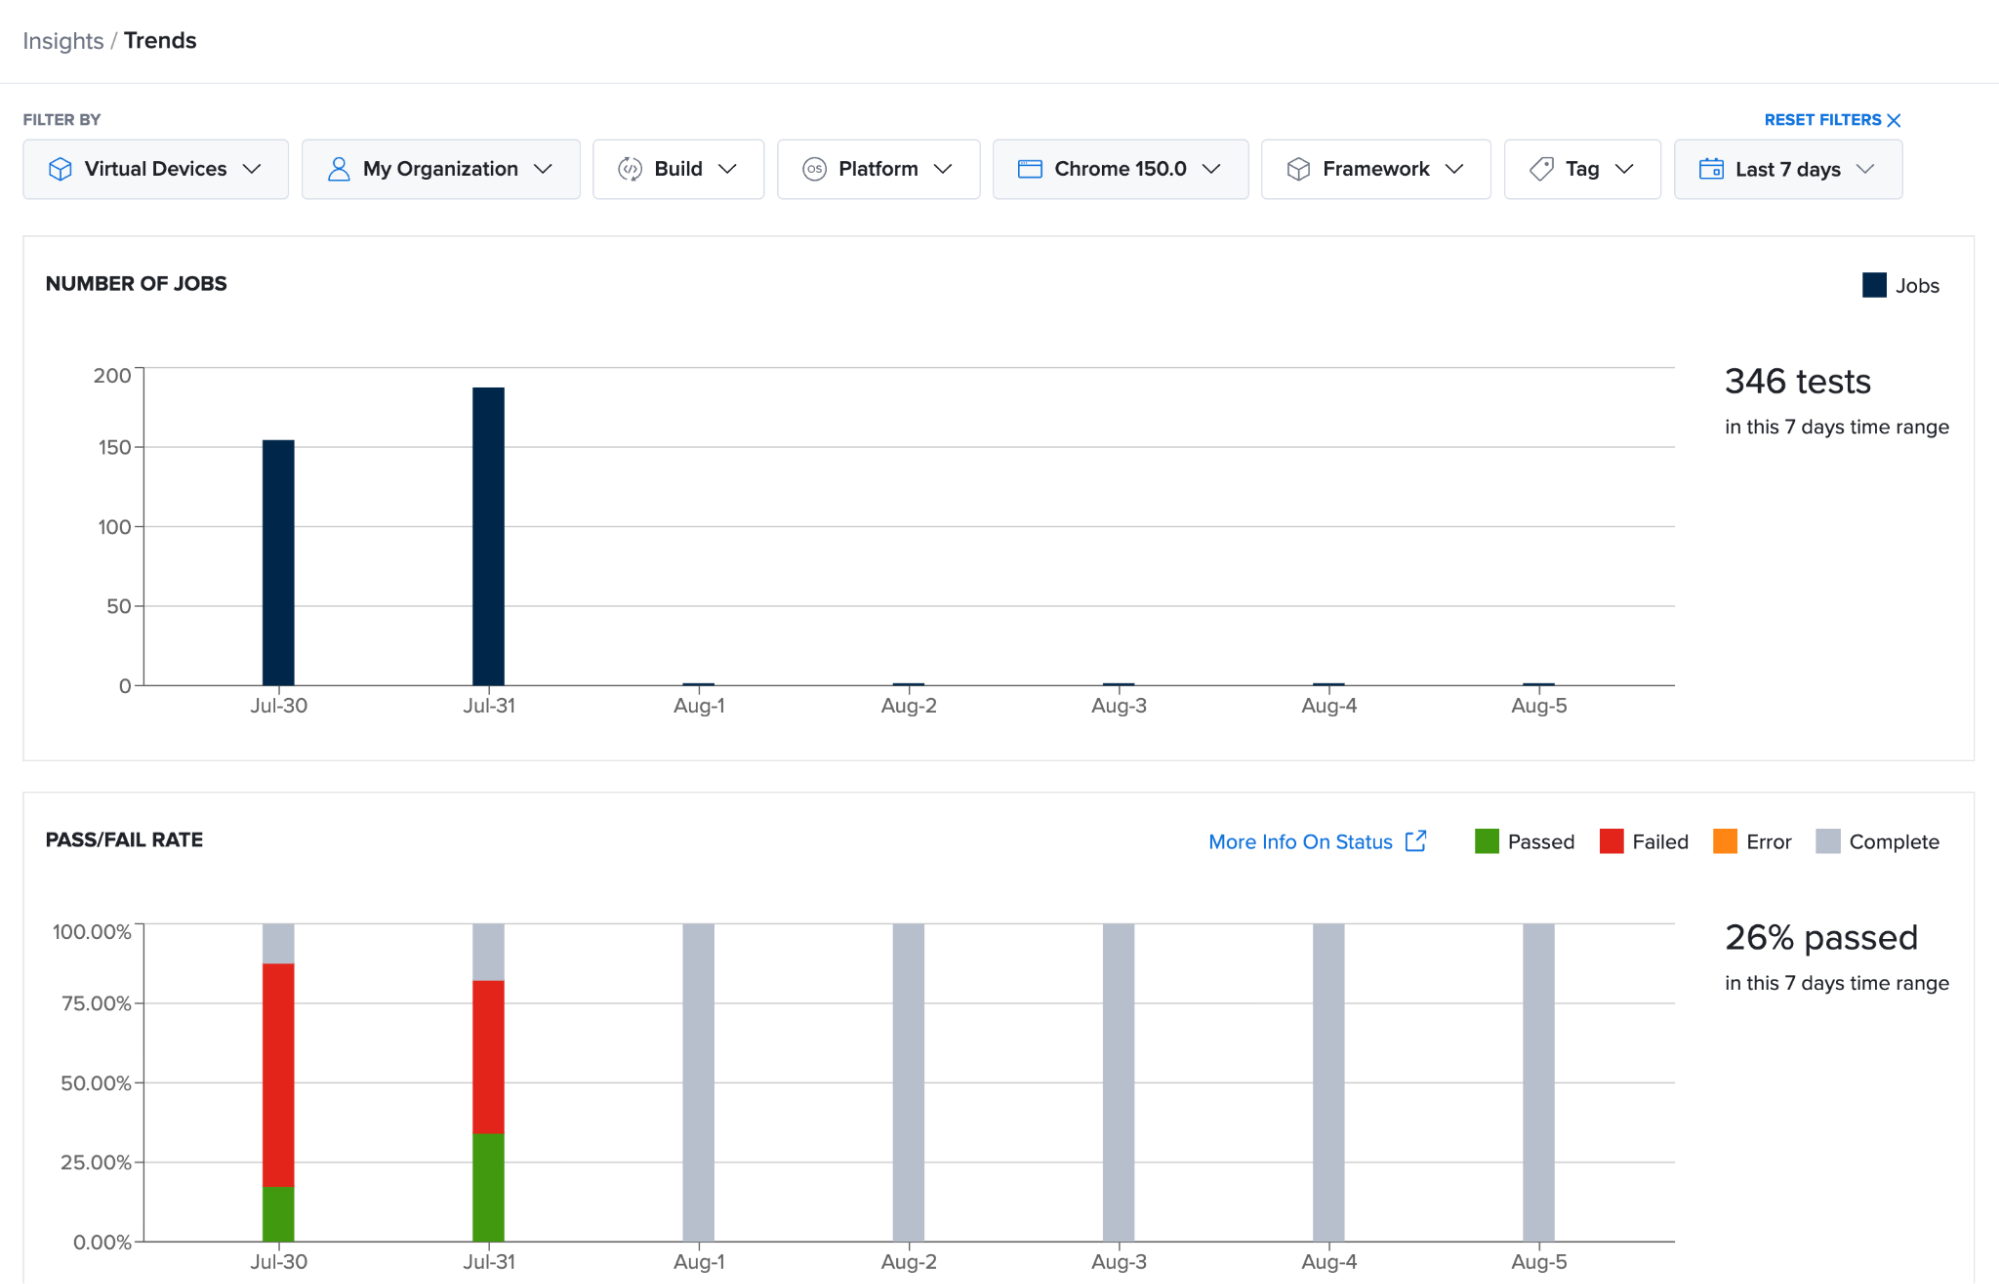
While the tests themselves perform well, it's difficult to judge how well the site functions when completed tests do not offer a definitive outcome. To provide a better baseline for cross-browser comparison, annotate these tests with relevant status using the Jobs API or the Selenium Javascript Executor.
Chrome 151.0
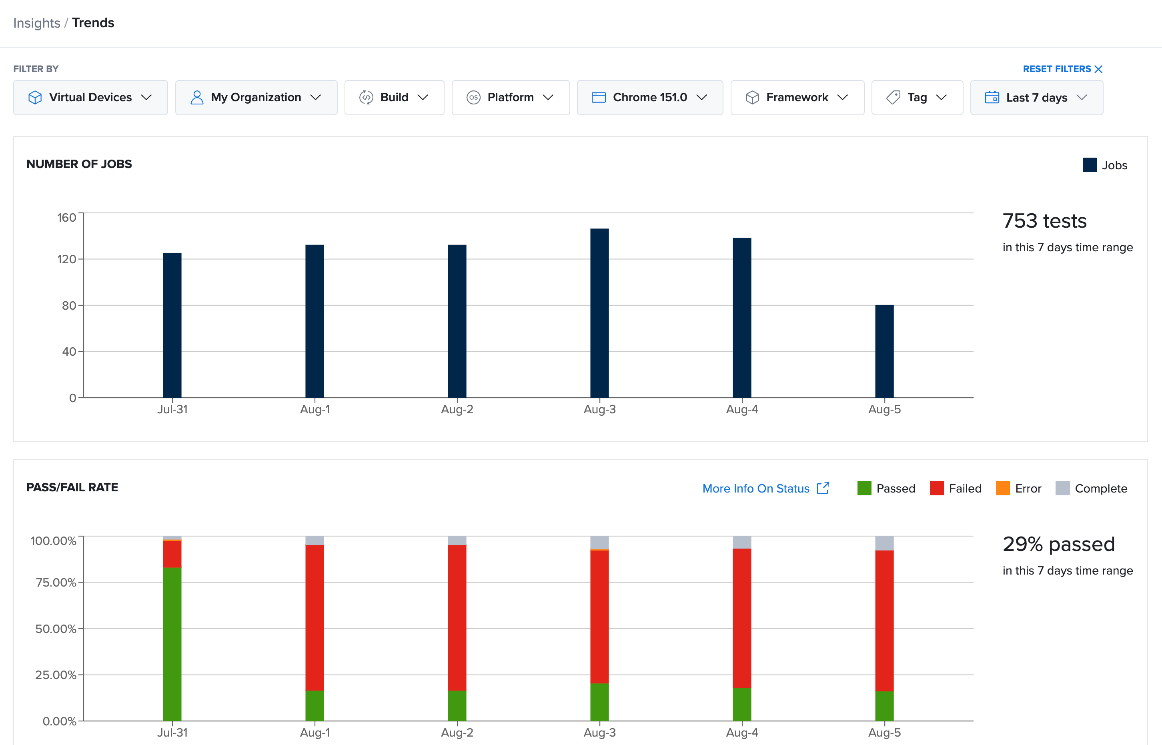
The Chrome 151.0 filter shows 753 test executions during the same seven-day period, with an overall 29% pass rate.
Test executions are distributed more consistently across the reporting period, providing a broader data set for analysis. The Pass/Fail Rate visualization shows a higher volume of executed tests, with Failed tests representing the largest proportion of results, followed by Passed and Completed executions.