Network Traffic Capture
Real Devices Only
Network Traffic Capture is a feature that allows you to record and analyze HTTP/HTTPS network traffic, during mobile app tests on real Android and iOS/iPadOS devices. This functionality provides detailed insights into how an app interacts with network services, making it an essential tool for debugging, performance optimization, and identifying issues in the app's data exchange processes. By capturing network traffic, users can pinpoint the exact moment and nature of a failure, such as identifying requests that time out, pinpointing requests that slow down the loading process, or locating faulty API calls. This enables quicker resolution and ensures a more precise assignment of responsibility when passed on to developers.
The captured traffic is presented in the HTTP Archive (HAR) file format, which offers a comprehensive view of the request and response cycles, including headers, payloads, and timings, enabling in-depth troubleshooting and performance analysis.
In combination with our Network Throttle functionality to simulate various network scenarios, you have the tools to replicate and troubleshoot any performance concerns stemming from network operations.
What You'll Need
- A Sauce Labs account (Log in or sign up for a free trial license)
- A native Android, iOS, or iPadOS mobile app that makes HTTP/HTTPS requests.
System-wide Network Capture
Our system-wide network capture feature enhances network monitoring by capturing all HTTP/HTTPS requests made from the device, offering visibility beyond just a single app or service. It works seamlessly regardless of the app’s framework or if it’s a hybrid application. This comprehensive approach provides a holistic view of network activity, giving you deeper insights into how various components of the device interact with external services. To ensure the captured data remains relevant and manageable, our system filters out some OS-specific services that can otherwise create unnecessary noise.
On iOS/iPadOS devices, this feature works seamlessly without requiring any resigning or changes to the app, making it simple and efficient to use.
For Android devices, a minor modification in the manifest is necessary, but all required changes will be handled by us. The app will be patched to circumvent SSL pinning if it is used.
Using system-wide Network Capture
- In Sauce Labs, from the left navigation, click App Management.
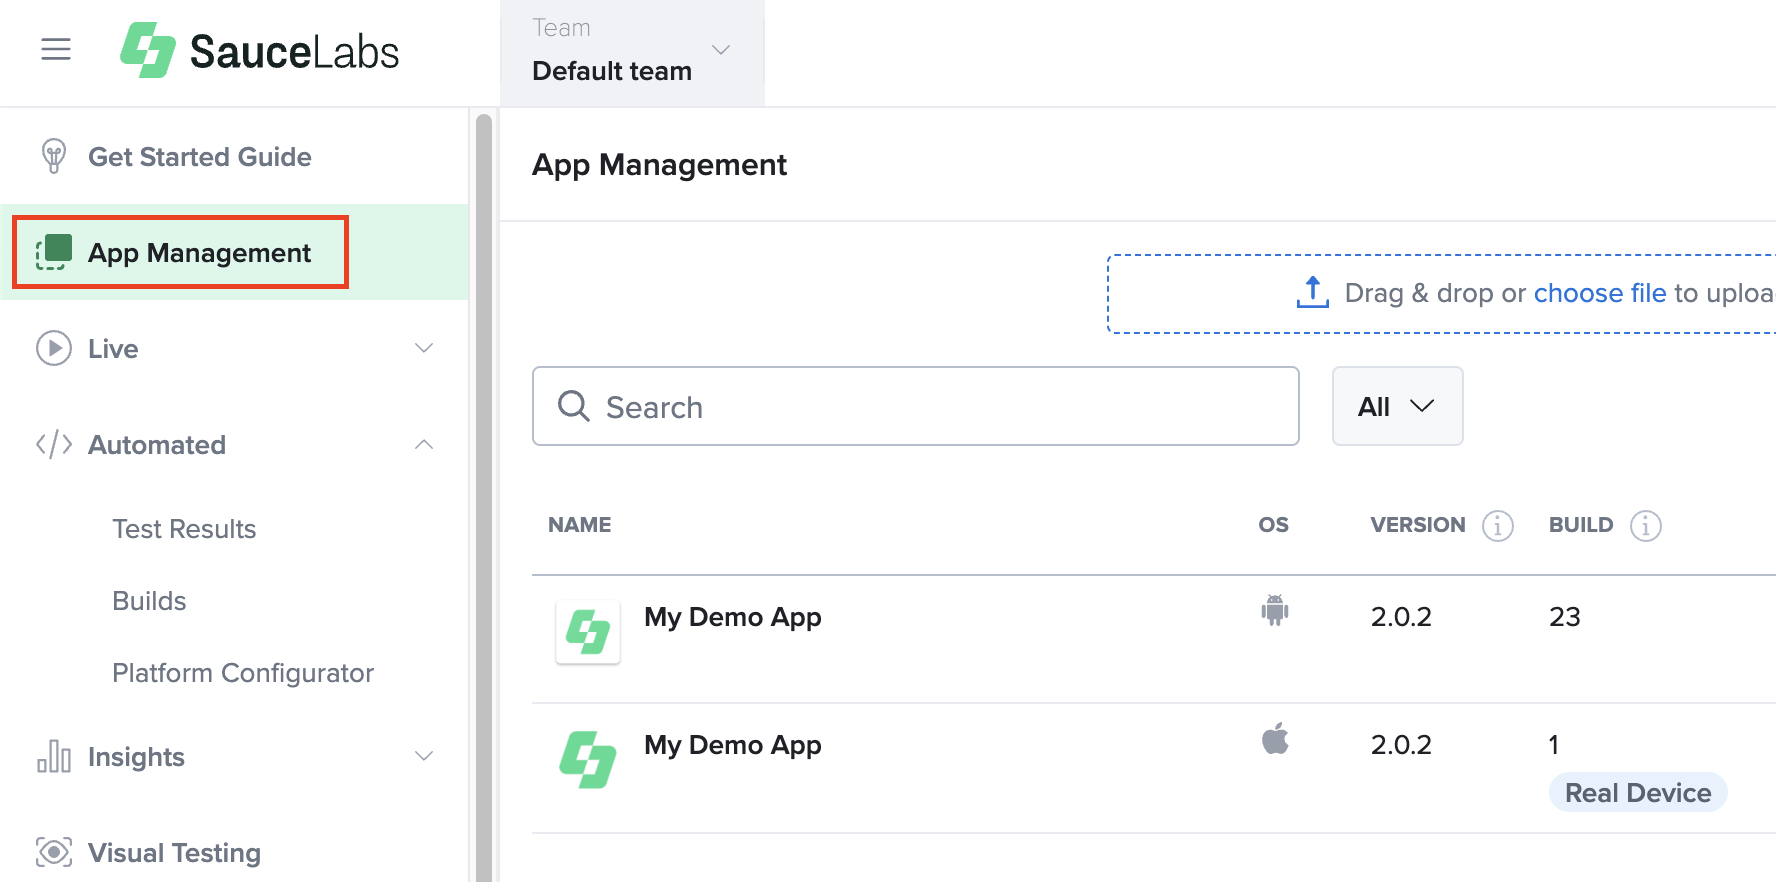
- Upload your mobile app to Sauce Labs through our UI or our REST API.

- After you’ve uploaded your app, locate it in the table and select Settings from the corresponding row.

- Under Real Device Settings enable Network Capture.
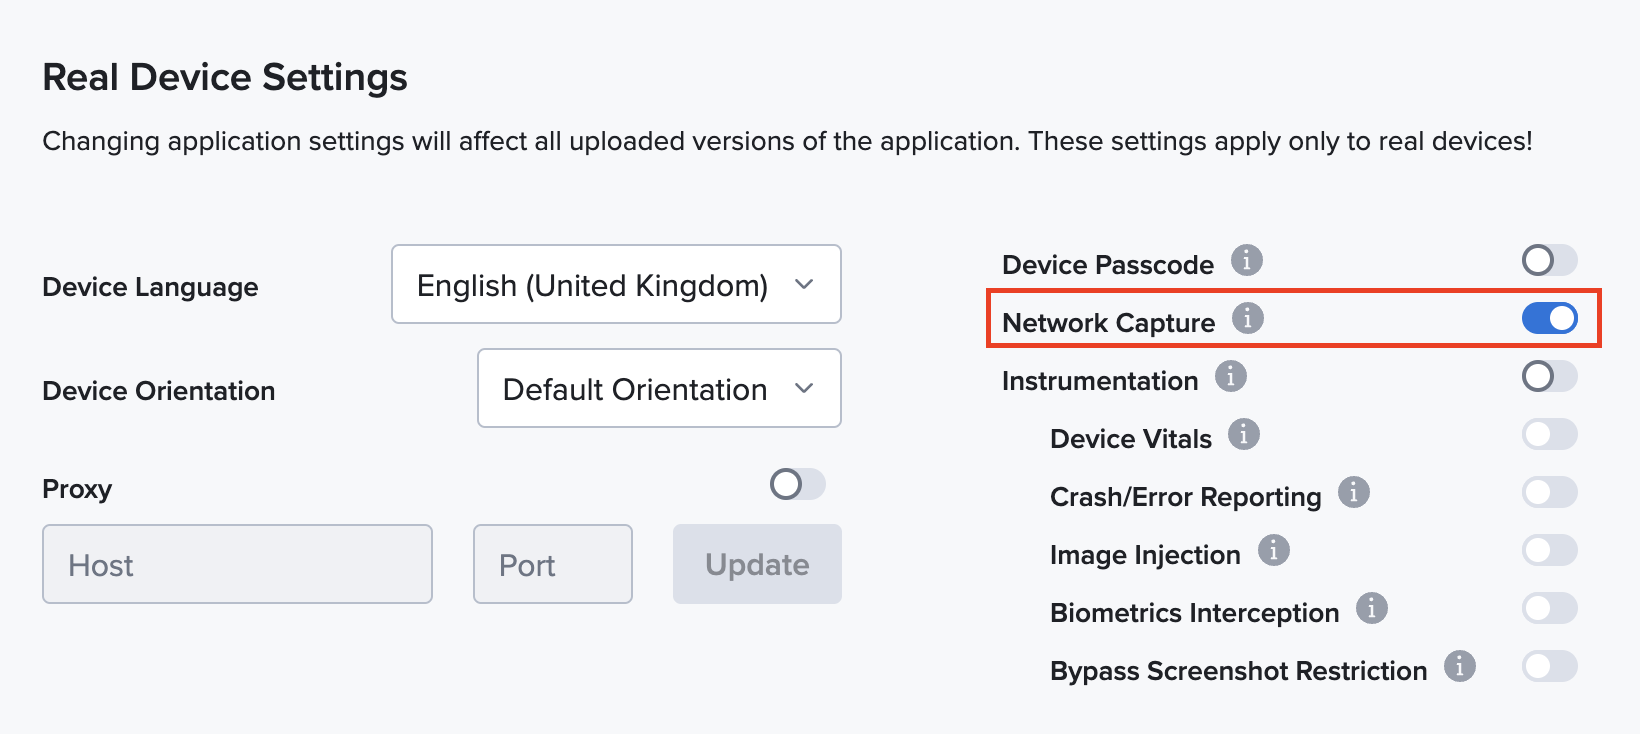
Now you can start your live or automated testing session. Your network logs will be captured and displayed in the test results page as well as during a Live Testing session with the Developer Options window.
In order to be able to see network traffic in your test report and ensure a smooth and error free testing experience, please make sure:
- Network protection features in 3rd party networking SDKs and Secure SDKs are disabled.
- All runtime checks for SSL pinning (iOS/Android) are disabled.
- Upload a debug build of your application. (iOS/Android)
Otherwise your app will accidentally mark Sauce's capture as untrustworthy and internet access for HTTPS will be limited.
For Android applications, a minor modification in the manifest is necessary to make your app trust our proxy certificate. We'll do this for you automatically on the fly, right before we install the app to the target device.
Automated Testing
The App Settings act as default configurations, but can be overridden by the capabilities specified in your test script. To control whether network capture is enabled or disabled, add the networkCapture capability to your test script.
Appium
Enable the following capability when you execute your tests.
Native Tests (Espresso/XCUITest)
Upload your mobile app to Sauce Labs through our UI or our REST API.
Navigate to App Management and locate your app's settings to enable the feature by default for all tests.

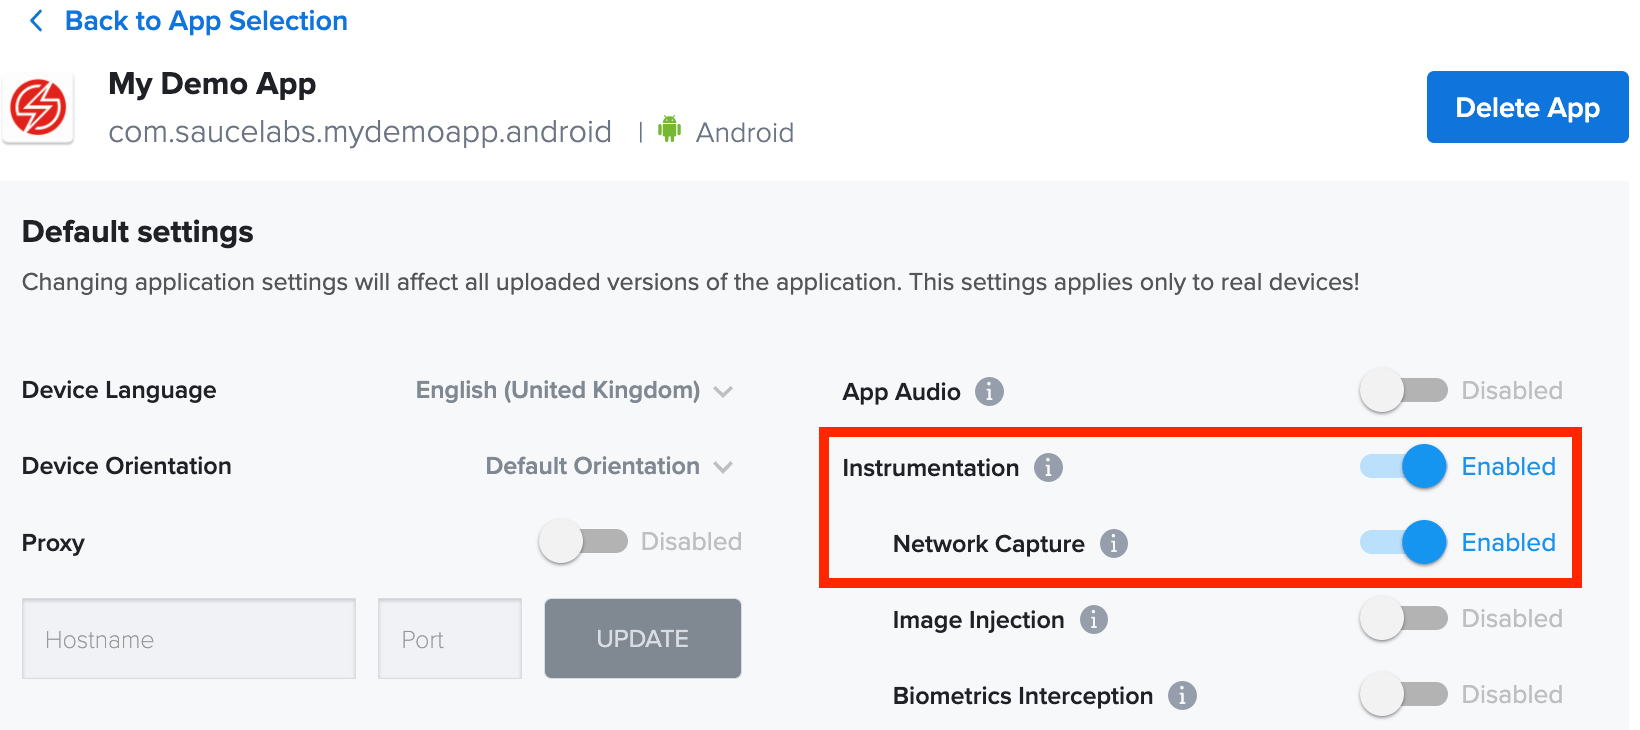
Alternatively, define it in your saucectl configuration the following way:
Accessing Network Traffic in real-time (Live Testing)
To be able to observe network traffic in real-time:
- Navigate to Live -> Mobile App/Cross Browser
- Choose device and start a session
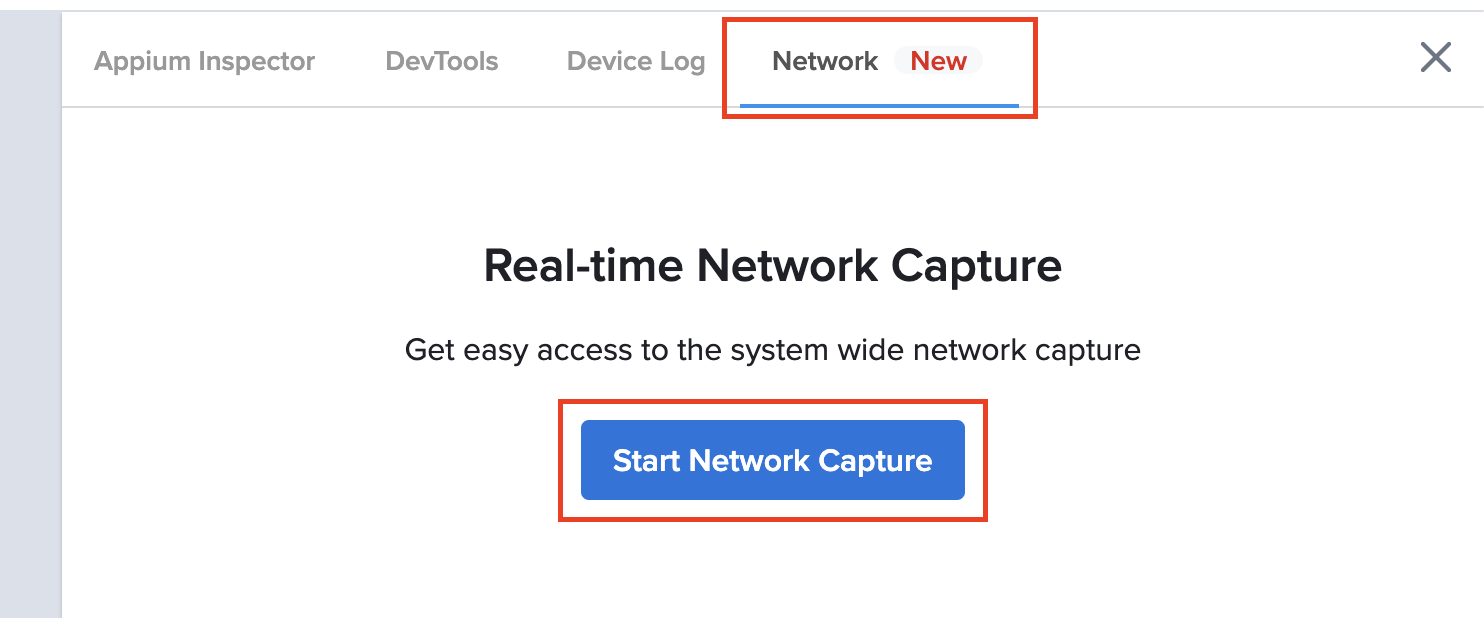
- In the live test window, in the left toolbar, open the Developer Options and select the Network tab.
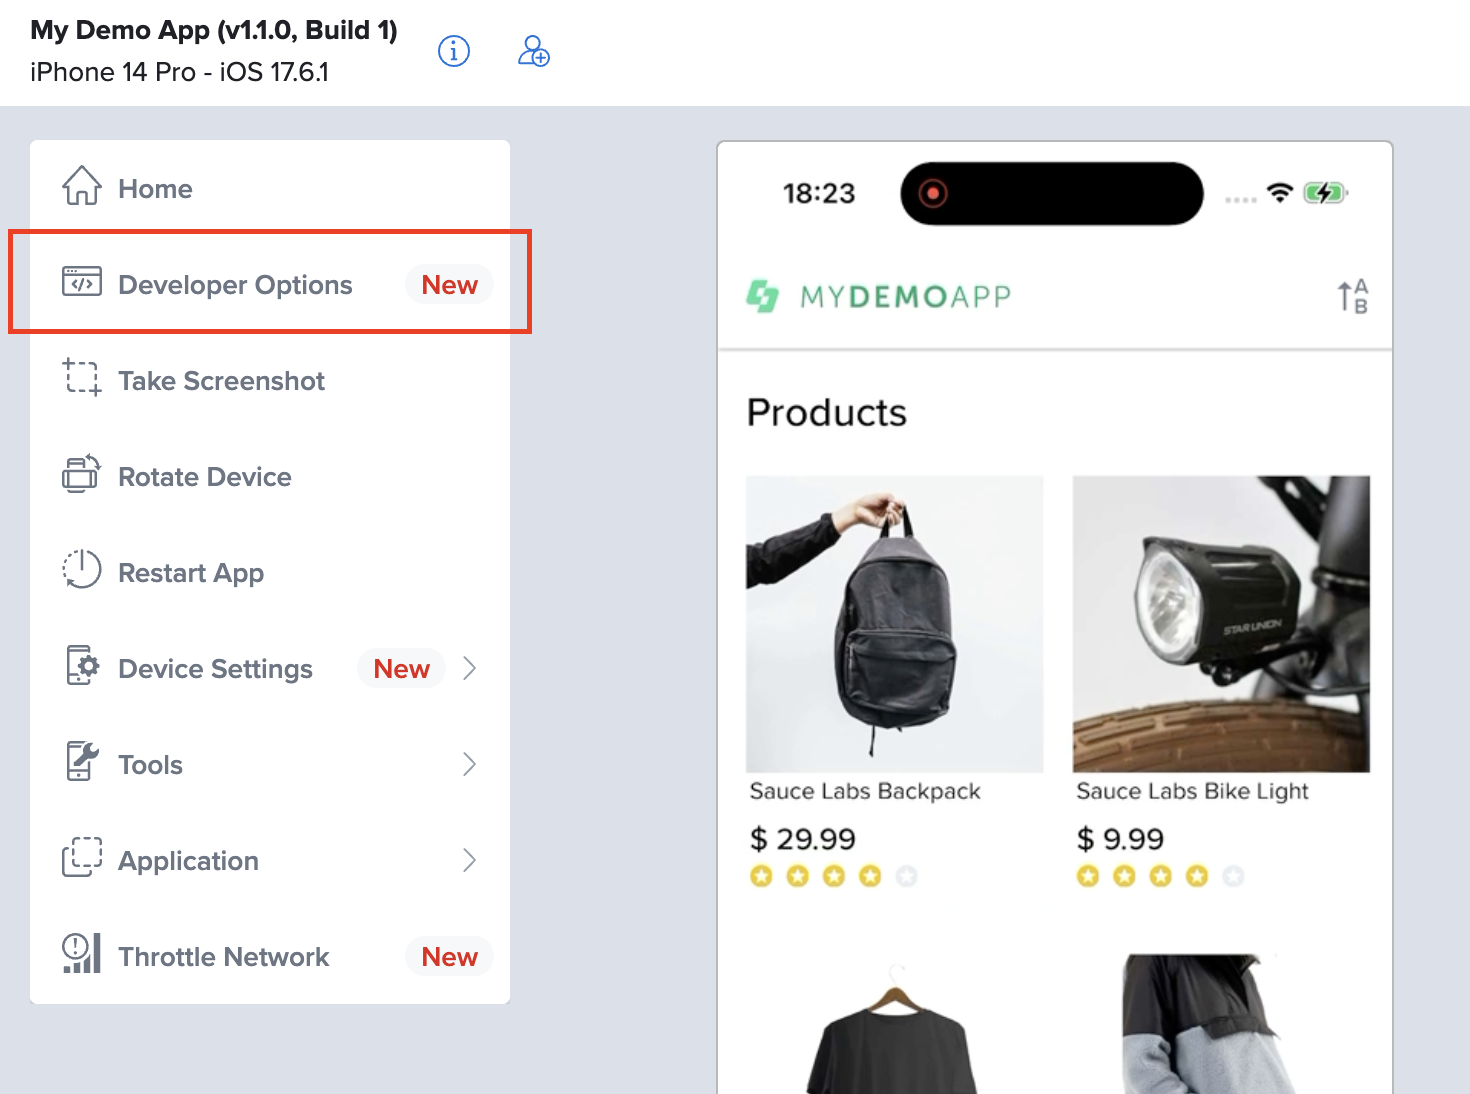
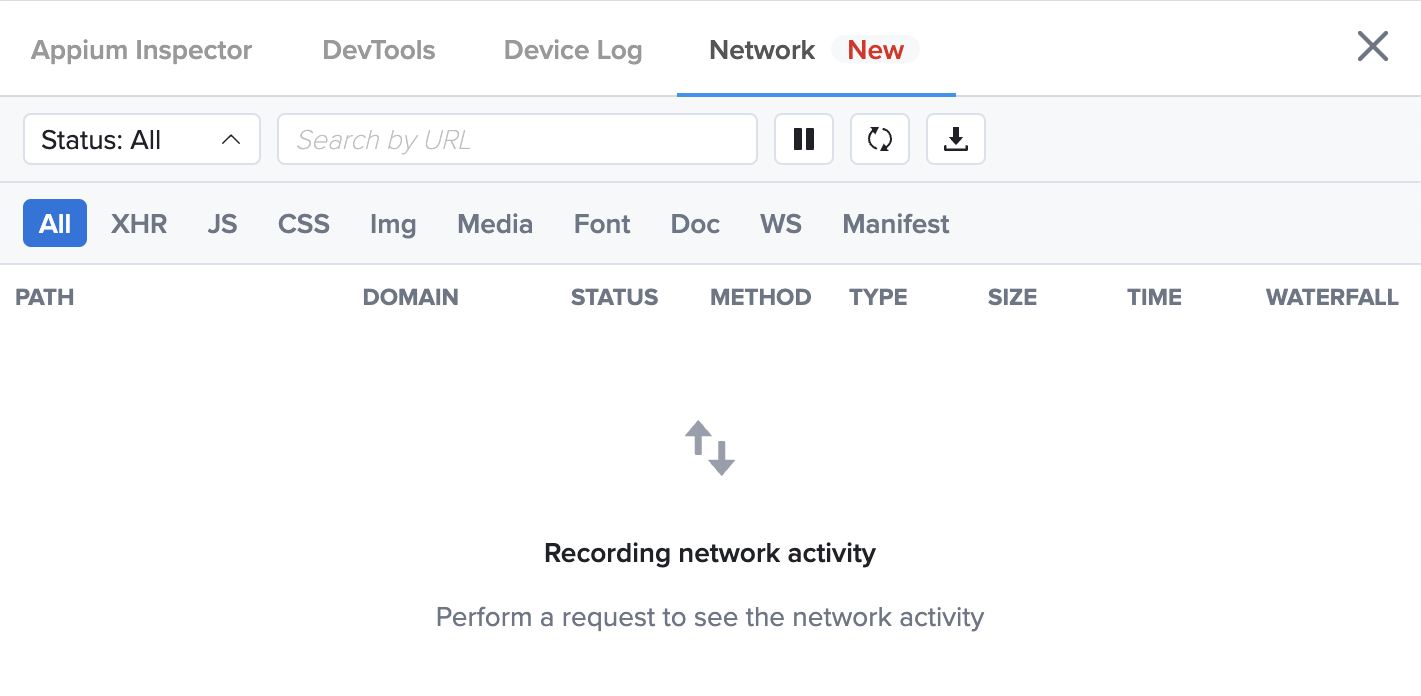
- Start the network capture.
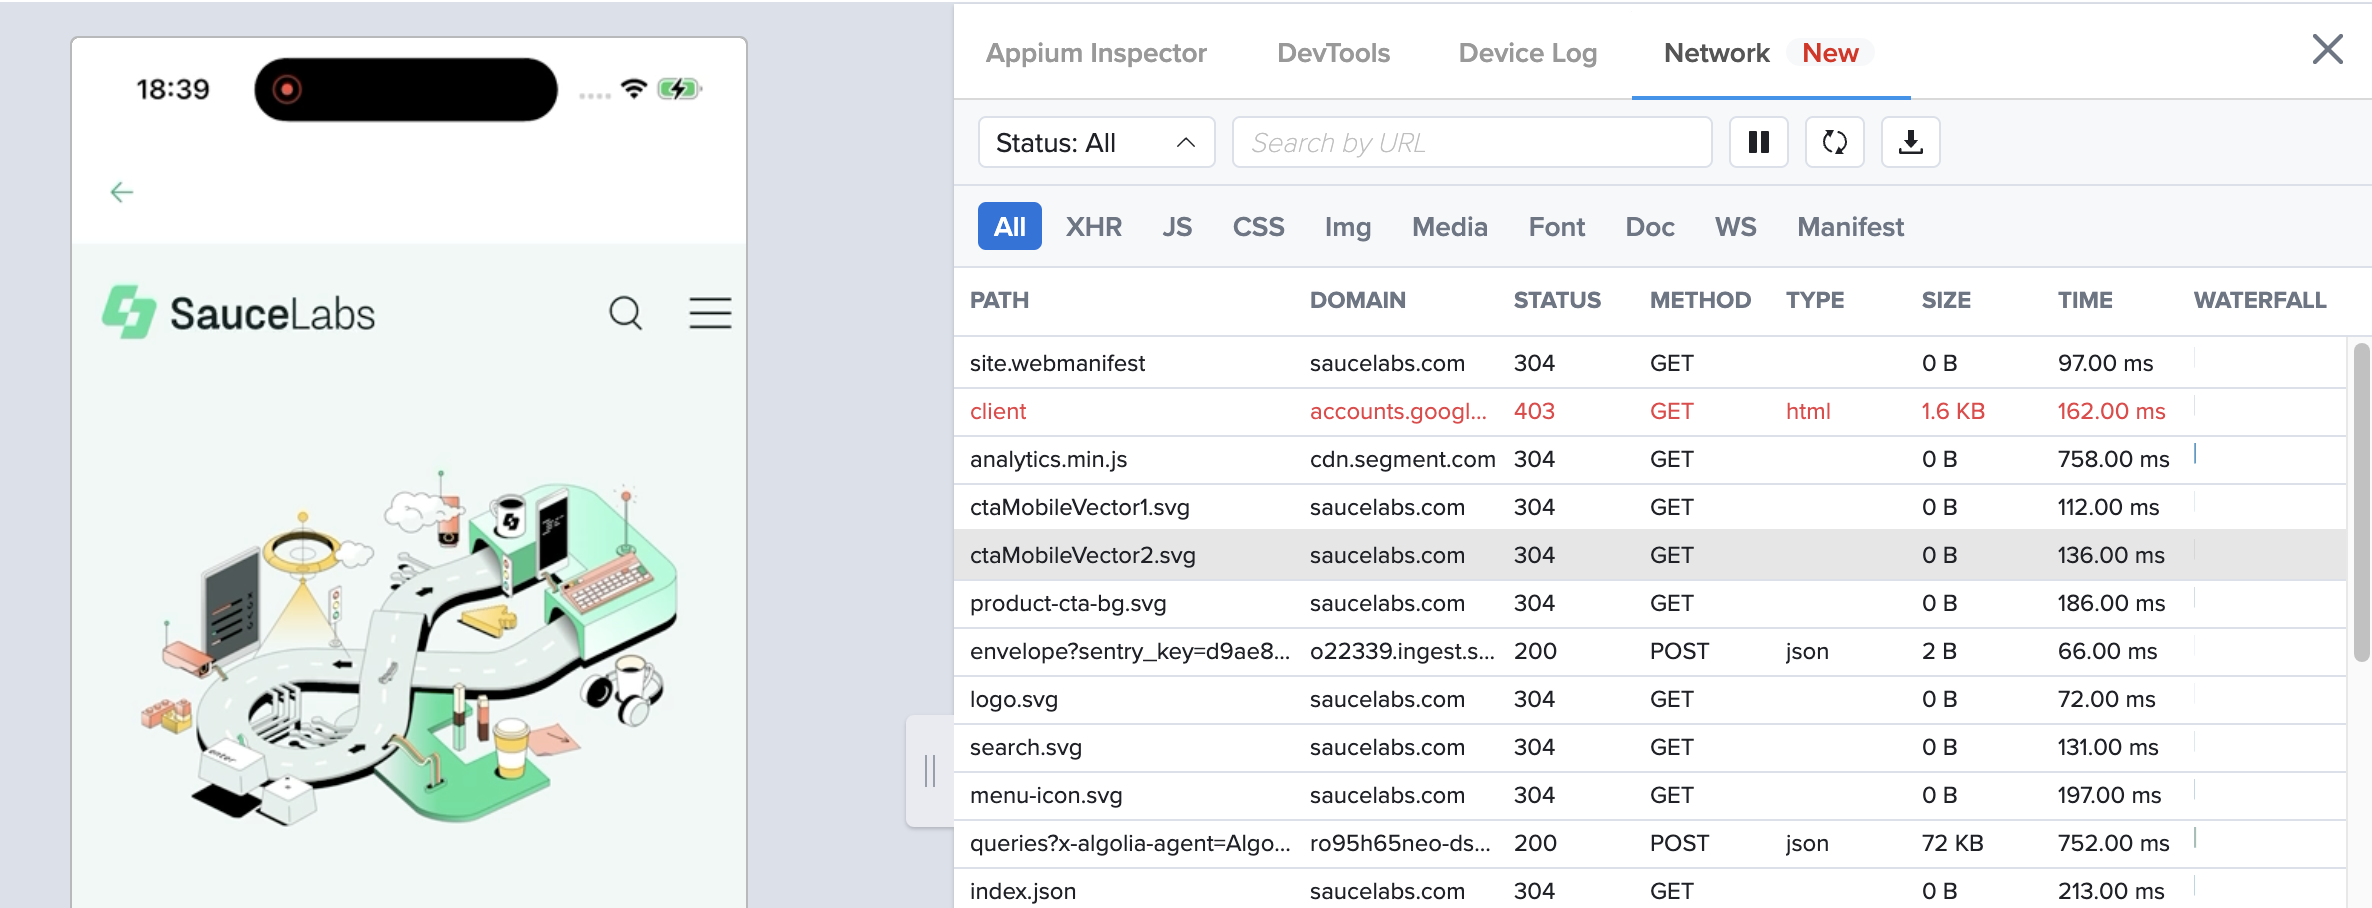
- Inspect network logs in the Sauce Labs Network Viewer as they arrive.
Cross Browser
To enable System-wide network capture for cross-browser tests, click on Developer Options during a Live Testing session on the sidebar.
If you need to localize the capture context with just the browser and omit all network calls from the system entirely, then prefer using our DevTools solution. It will allow you to isolate network calls from individual browser tabs and provide a richer debugging experience.
Limitations
- iOS network capture is supported on iOS/iPadOS 14.0 and above.
- Android network capture is supported on Android 10 and above.
- Flutter applications are not supported at the moment.
- Only HTTP/HTTPS network traffic is captured.
- Android Emulators are not supported.
- iOS Simulators are not supported.
- SSL pinning, e.g. when using a self-signed certificate, your custom trust manager must not trust only your certificate.
- Some common domains are excluded, like those used by system services and analytics providers
Excluded domains:
apple.com,google.com,googleapis.com,gstatic.com,crashlytics.com,doubleclick.net,app-measurement.com,facebook.com,xiaomi.com,xiaomi.net,miui.com
Accessing HAR Files (Live and Automated Testing)
To download HAR files from Sauce Labs:
- Navigate to Test Results.
- Select the applicable test.
- Click the Network tab on the right panel to preview all captured network requests.
You can also download a HAR file programmatically using the following API request:
- United States
- Europe
curl -u "$SAUCE_USERNAME:$SAUCE_ACCESS_KEY" --location \
--request GET 'https://api.us-west-1.saucelabs.com/v1/rdc/jobs/{JOB_ID}/network.har'
curl -u "$SAUCE_USERNAME:$SAUCE_ACCESS_KEY" --location \
--request GET 'https://api.eu-central-1.saucelabs.com/v1/rdc/jobs/{JOB_ID}/network.har'
Sauce Labs Network Viewer
The Sauce Labs Network Viewer is a visualization tool for HAR files that presents requests in a table view with a range of advanced filtering options.
Pause / Resume
Live Testing Only
Pause and resume the display of new network traffic without affecting the network.har test asset. The final network.har file contains all network traffic from the moment the network capture was initiated and will be available after the session is closed.
Reset
Live Testing Only
Clear the current state of network logs from the inspector. This does not affect the final network.har test asset.
Export HAR file
Download the current state of network logs from the inspector in HAR format. This is helpful for capturing a specific part of the test flow with a network issue, making it easier to share with developers for debugging.

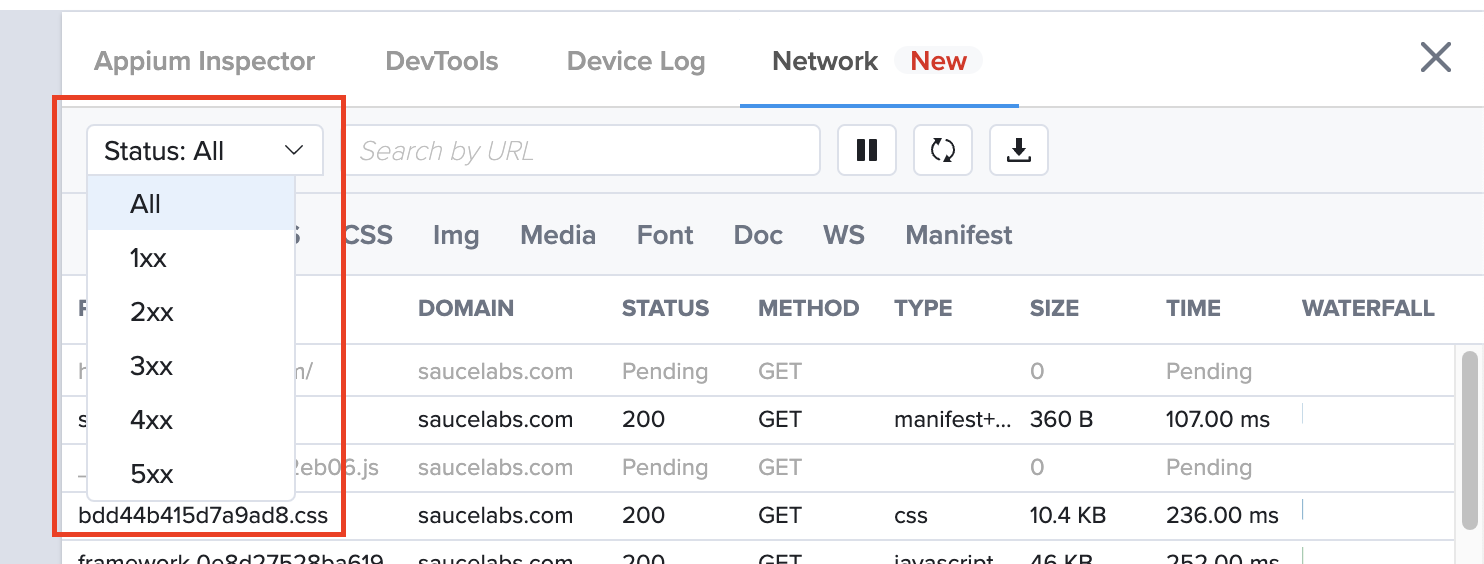
Filter by status
Use the status filter dropdown list to filter network logs based on their status code.
Search by URL
Search for specific network logs using the request URL.

Filter by content type
Filter requests by their content type by selecting the desired category from the options available.

Requests table
The main table displays all captured requests with the following columns:
- Path: The name of the request. Hover over it to view the full resource, including the domain name.
- Domain: The domain of the request.
- Status: The HTTP/HTTPS status code.
- Method: The HTTP/HTTPS method used.
- Type: The MIME type of the requested resource.
- Size: The total size of the response headers plus the response body, as delivered by the server.
- Time: The total duration from the start of the request to the receipt of the final byte in the response.
- Waterfall: A visual representation of the timeline for all network requests.
Each request is color-coded based on their state. Red entries indicate errors with status codes of 400 or higher, while light grey entries represent still pending requests.
Waterfall chart
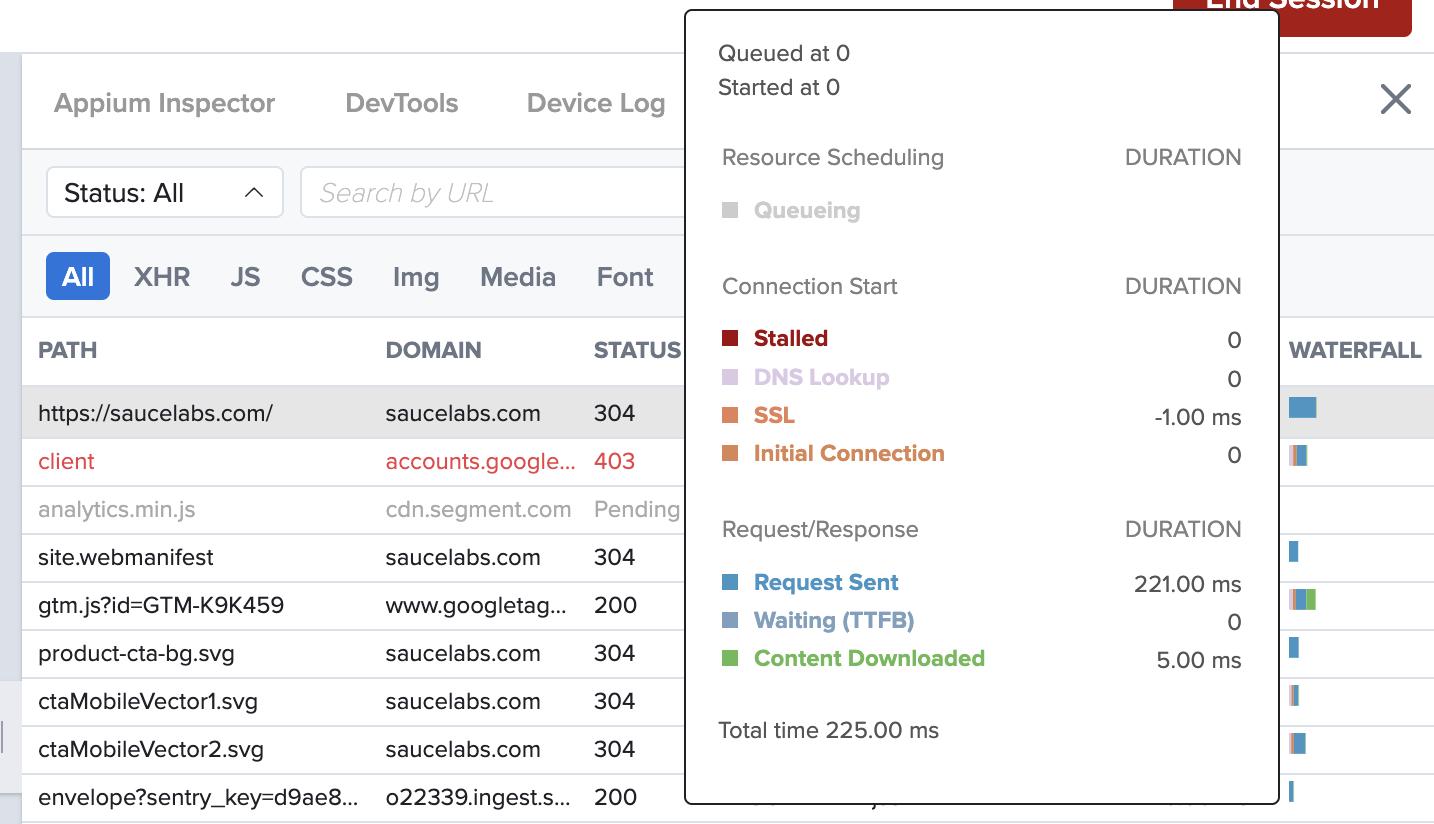
The Waterfall chart shows the request lifecycle, with detailed timing information when hovering over the chart. This helps to gain a deeper understanding of the request's timeline.
Request details
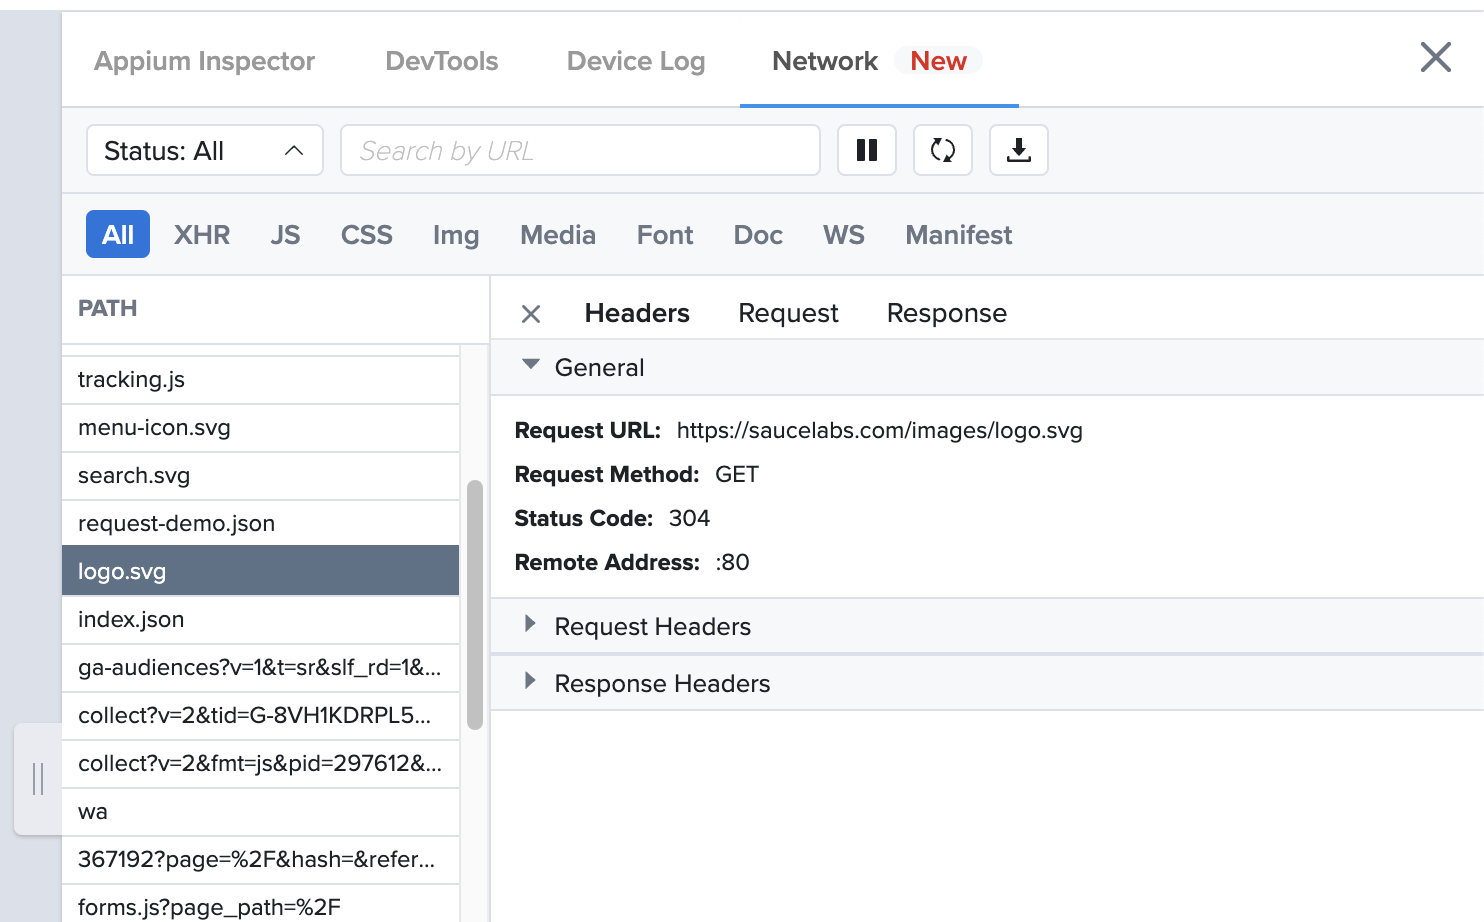
Clicking on a specific request opens the Request Details view, which includes general information about the request, along with the request and response headers, and the request and response payloads.
Failed requests
Some requests will fail before even sending any HTTP data, and will appear in the requests table in red, with a status of "failed" (instead of a legitimate HTTP status code). They are usually caused by SSL errors, which in turn may be a sign of:
- A misconfigured or expired SSL certificate
- The usage of SSL pinning in a mobile app
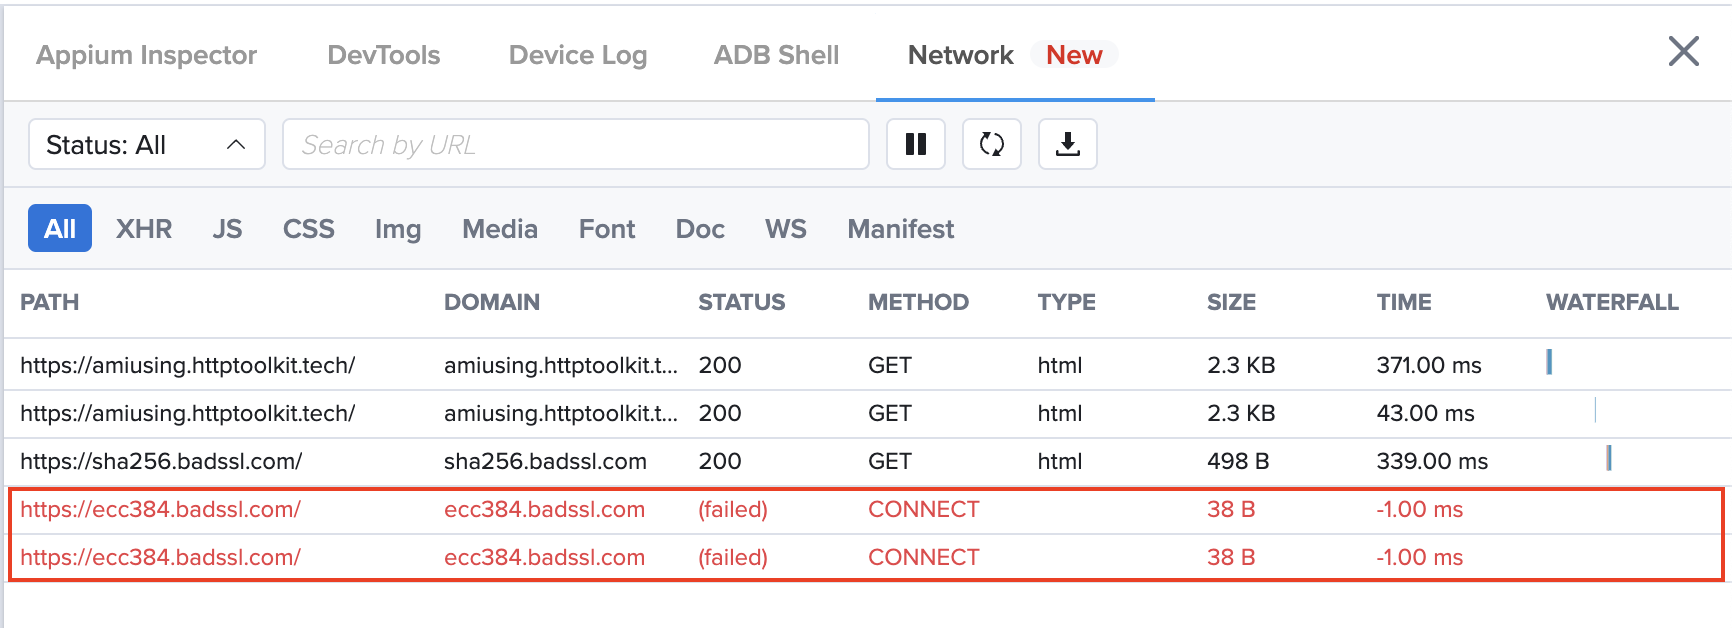
When an app uses SSL pinning, encrypted traffic will not work while network capture is active, because outgoing requests will be signed using a Sauce Labs certificate instead of the one included with the app.
If you see failed network requests to domains you're trying to test, try to rule out (and remove) SSL pinning from the app first. Even if it was not implemented deliberately, SSL pinning may sometimes come included out-of-the-box with some mobile SDKs or libraries.
Stats Row
The Stats row in the footer provides details on the number of requests, transferred data size, resource sizes, and time metrics such as Page Load, DOMContentLoaded, and Finished time.

Limitations
- Android Emulators
- iOS Simulators
More Information
- Network Throttling
- Sauce Labs Test Results
- Sauce Labs Insights
- Visualize HAR Files With The New React Network Viewer Component
Viewing HAR Files
You need a HAR viewer to read HAR files. Sauce Labs provides a React Network Viewer HAR viewer for your convenience.
Alternatively, some other commonly used HAR viewers include:
- Charles Proxy
- Telerik Fiddler
- Chrome DevTools builtin HAR imports
- Google Admin Toolbox HAR Analyzer
- Software is Hard blog HTTP Archive Viewer
- Firefox network monitoring builtin HAR imports