Dashboard Walkthrough
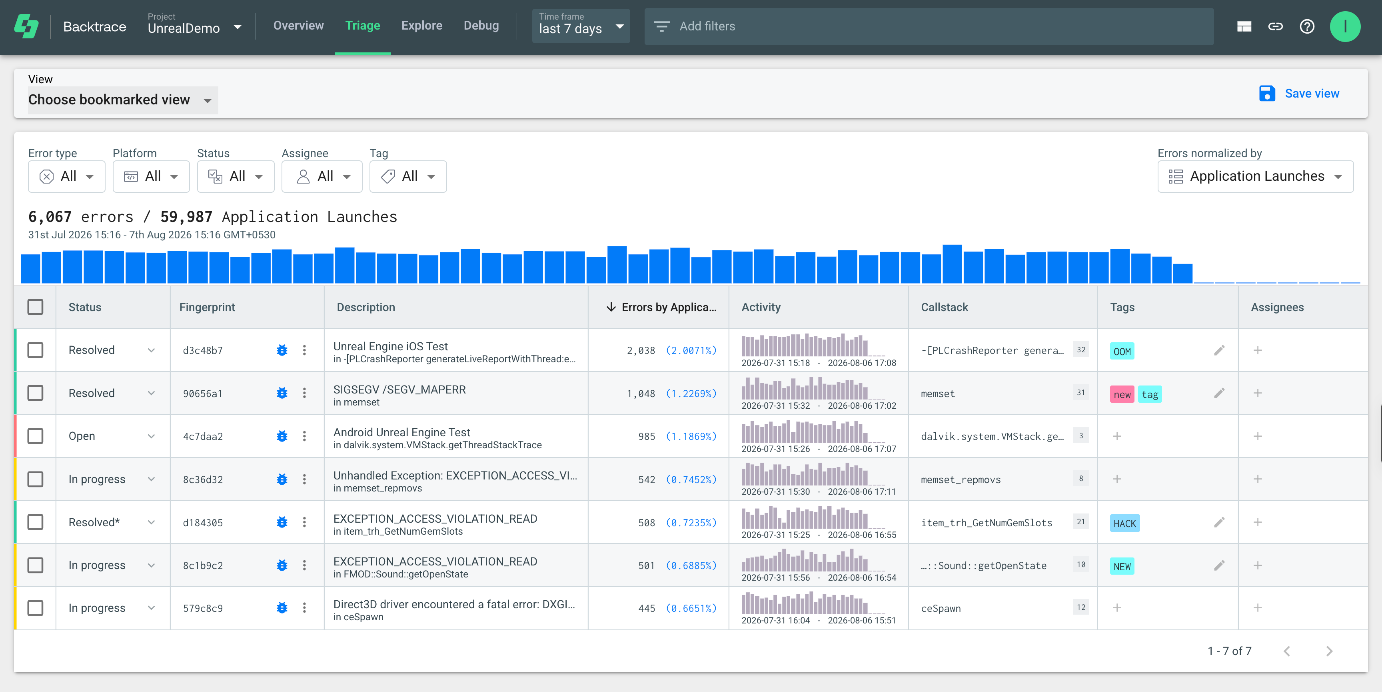
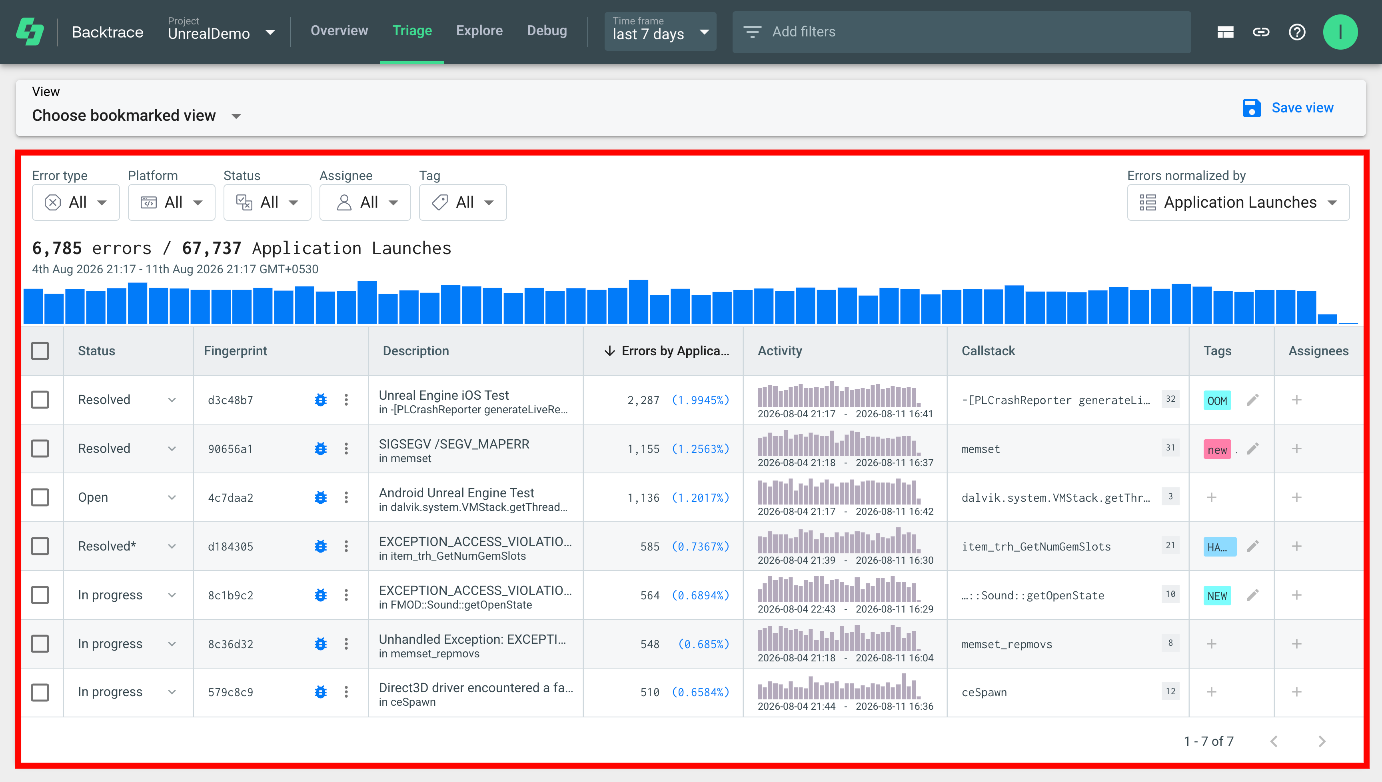
The Triage dashboard is the first screen you see when you open a project in the Web Console. It shows the crashes and errors reported for the project during the selected time period, grouped into fingerprints, so you can see at a glance how much error activity there is and which errors need attention.
The dashboard brings together three things: filters to narrow down what you see, a chart that shows how error activity changes over time, and a table that lists each fingerprint with its status, activity, owner, and linked issues. From the table, you can open a fingerprint to investigate it or act on it directly.
Triage Dashboard
The Triage dashboard has three main areas:
| Dashboard Area | Description |
|---|---|
| Filters | Narrow down the fingerprints shown in the dashboard. |
| Error Volume Chart | Shows error activity over the selected time period. |
| Fingerprint Table | Lists fingerprints and the errors grouped under each one. |
Review Error Activity
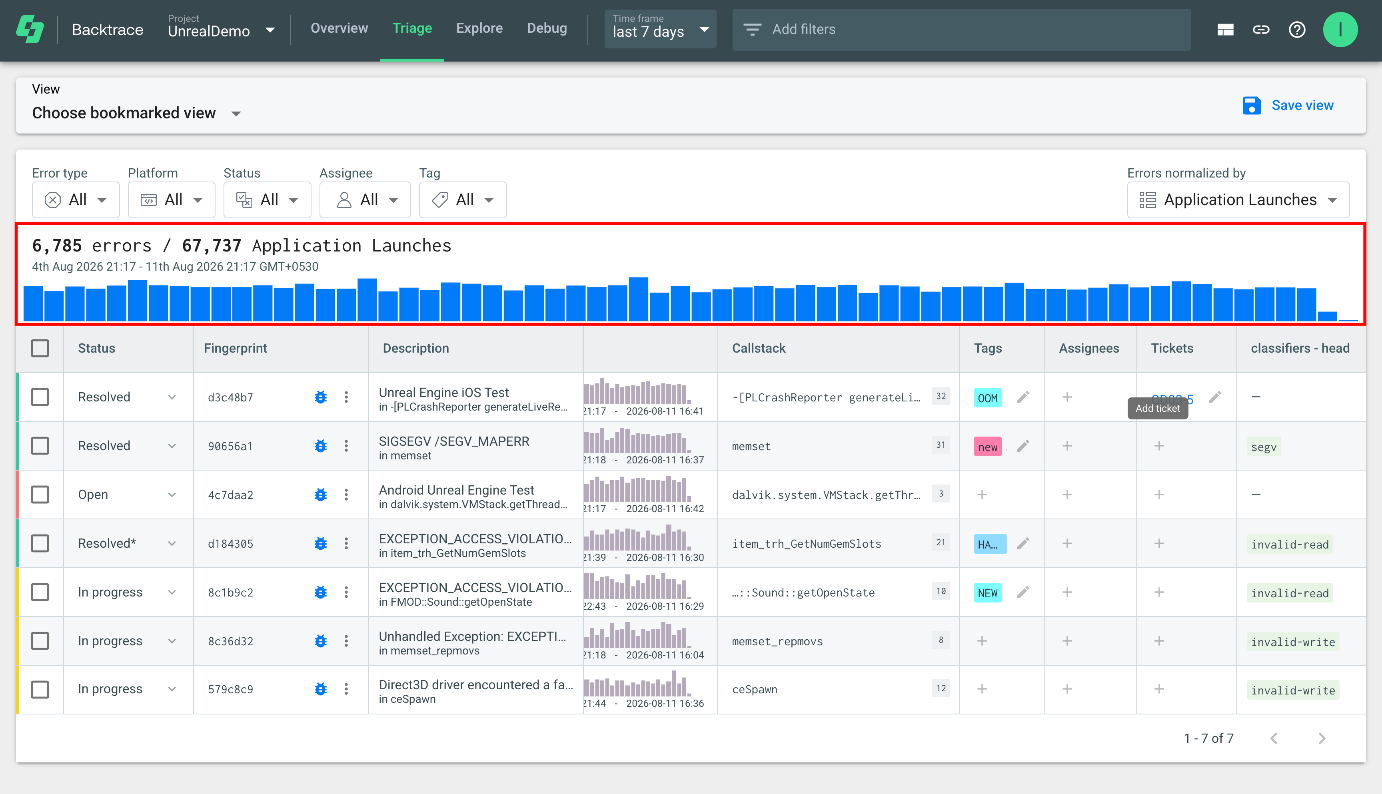
The error-volume chart shows how many errors occurred during the selected time period and how they are spread over time. Use it to spot spikes or drops in error activity.
The total error count appears above the chart. The fingerprint table below the chart lists the fingerprints that make up this activity.
Combine the chart with the Triage filters to focus on the errors that matter to your investigation.
Fingerprint Table
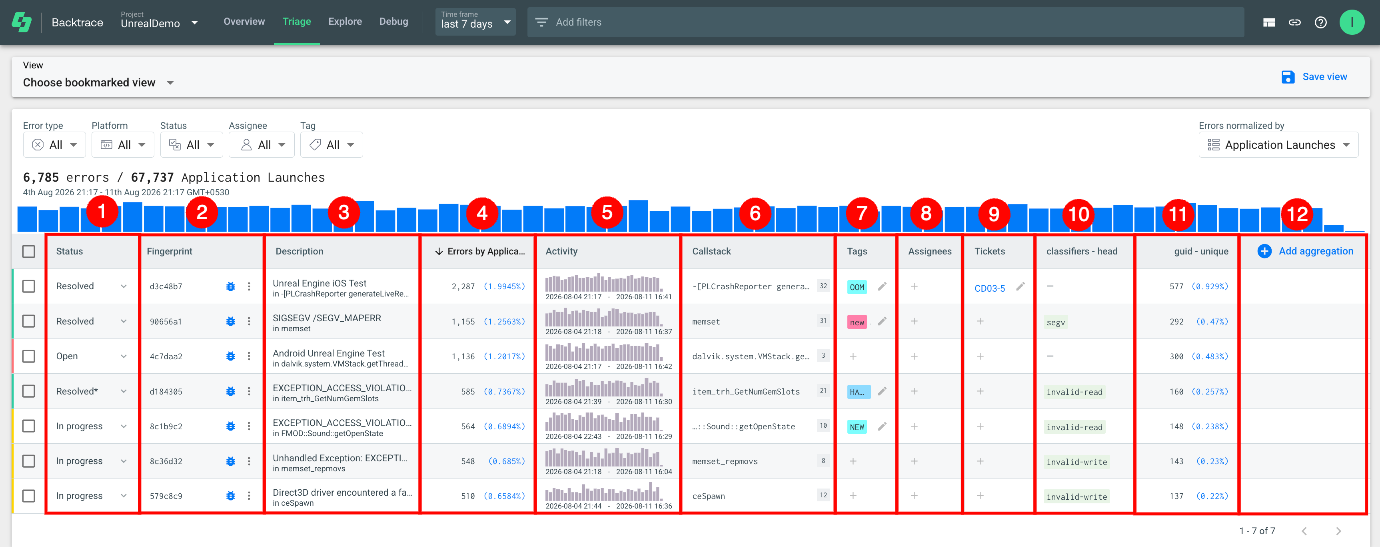
Each row in the fingerprint table represents one fingerprint. Use the table to decide which fingerprints need attention.
| No. | Column | Description |
|---|---|---|
| 1 | Status | The fingerprint's current status, such as Open, In Progress, or Resolved. |
| 2 | Fingerprint | The fingerprint's unique identifier. |
| 3 | Description | A summary of the error. |
| 4 | Errors by Application | The number and percentage of errors for the fingerprint across application launches. |
| 5 | Activity | The fingerprint's error activity over the selected time period. |
| 6 | Callstack | The callstack for the fingerprint. Hover over it to see more frames. |
| 7 | Tags | Tags applied to the fingerprint. You can add or manage tags from this column. |
| 8 | Assignees | The user assigned to the fingerprint. |
| 9 | Tickets | Issues linked to the fingerprint, such as Jira issues. |
| 10 | Classifiers - head | The classifier associated with the fingerprint. |
| 11 | Guid - unique | The number of unique GUIDs for the fingerprint and their percentage. |
| 12 | Add Aggregation | Adds an aggregation column to the table. |
Take Action on a Fingerprint
After you find a fingerprint that needs attention, use the controls in its row:
| Where to Start | What You Can Do | Read More |
|---|---|---|
| Status | View or update the fingerprint's status. | View & Manage Fingerprint Status |
| Fingerprint ID | Open the fingerprint's Details view. | View Fingerprint Group Details |
| Debugger icon | Open the latest trace in the Debugger. | View Fingerprint in Debugger |
| Assignees | Assign the fingerprint to a user. | Assign a Fingerprint |
| Tickets | Create and link a Jira or GitHub issue. | Link a Fingerprint to an Issue |
| Add Aggregation | Add a custom metric column to the table. | Add Custom Metric Columns |
Save a Triage View
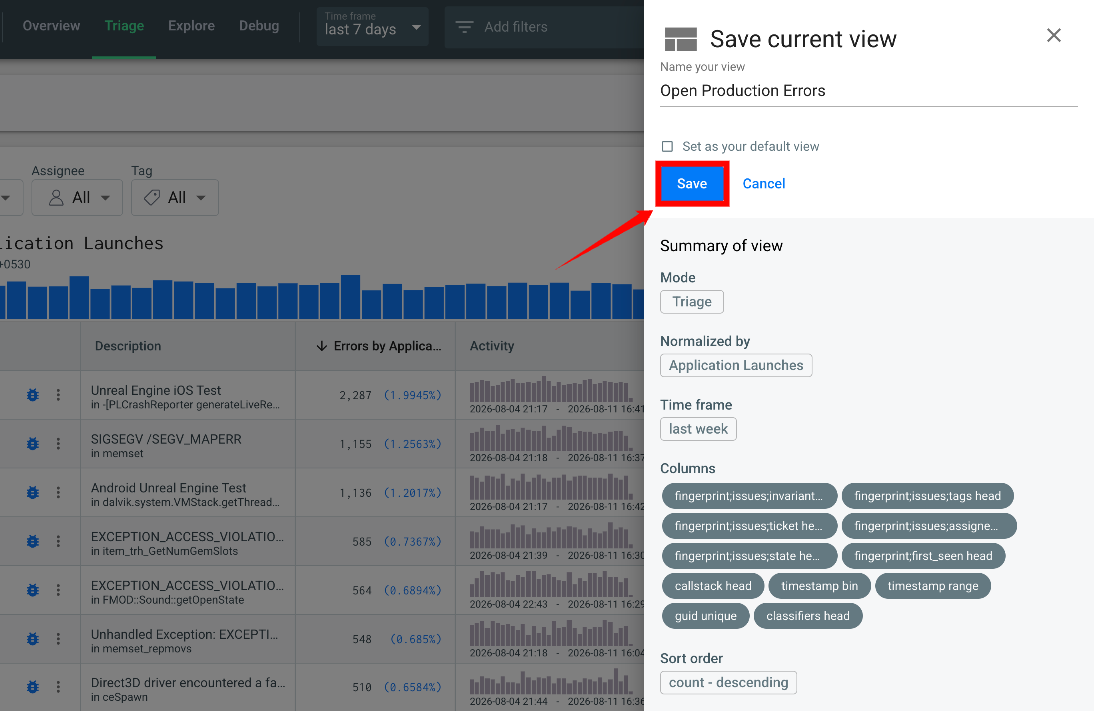
Save your current filters, columns, time frame, and other settings as a view, so you can return to the same setup later without configuring it again.
Step 1: Set up the Triage view with the filters and display settings you want to keep.
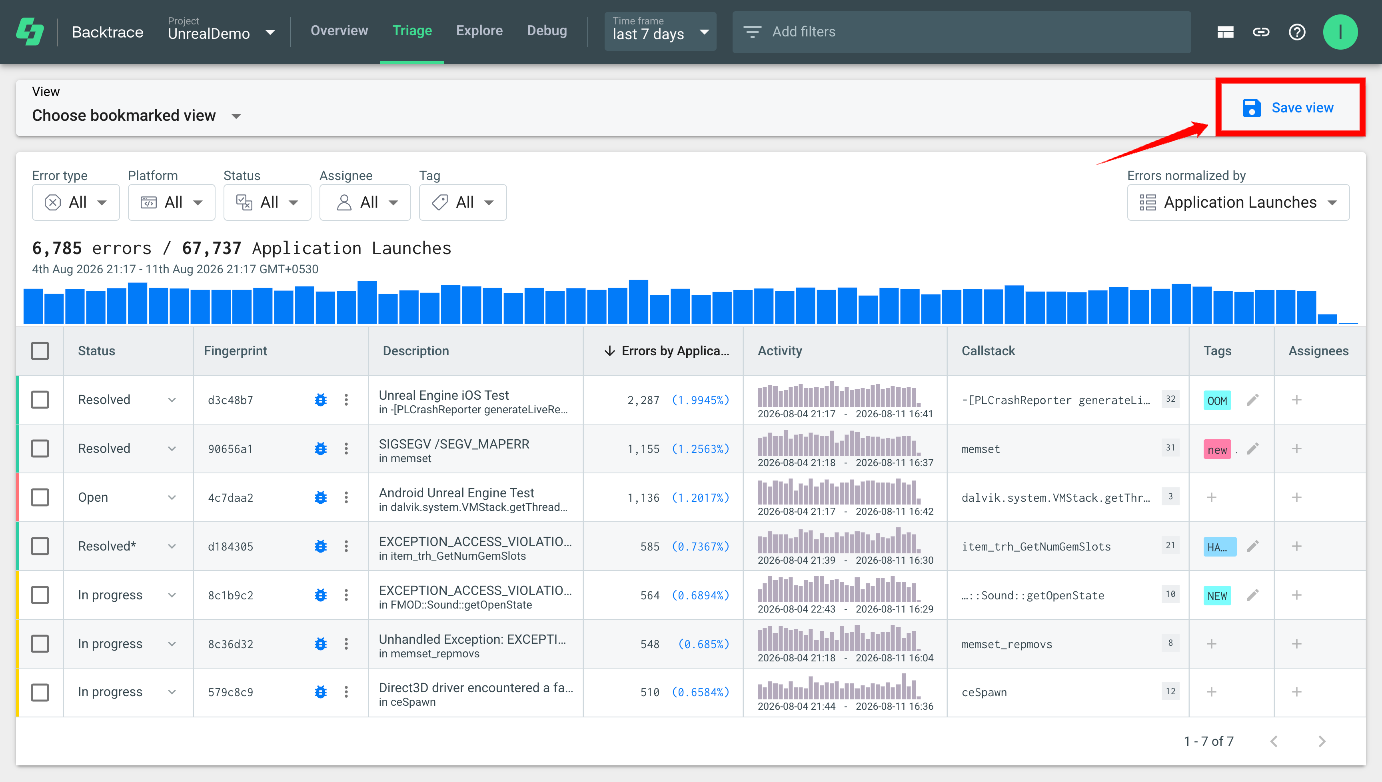
Step 2: Click Save view in the upper-right corner of the dashboard.
Step 3: Enter a name that describes the view, such as the type of fingerprints it shows.
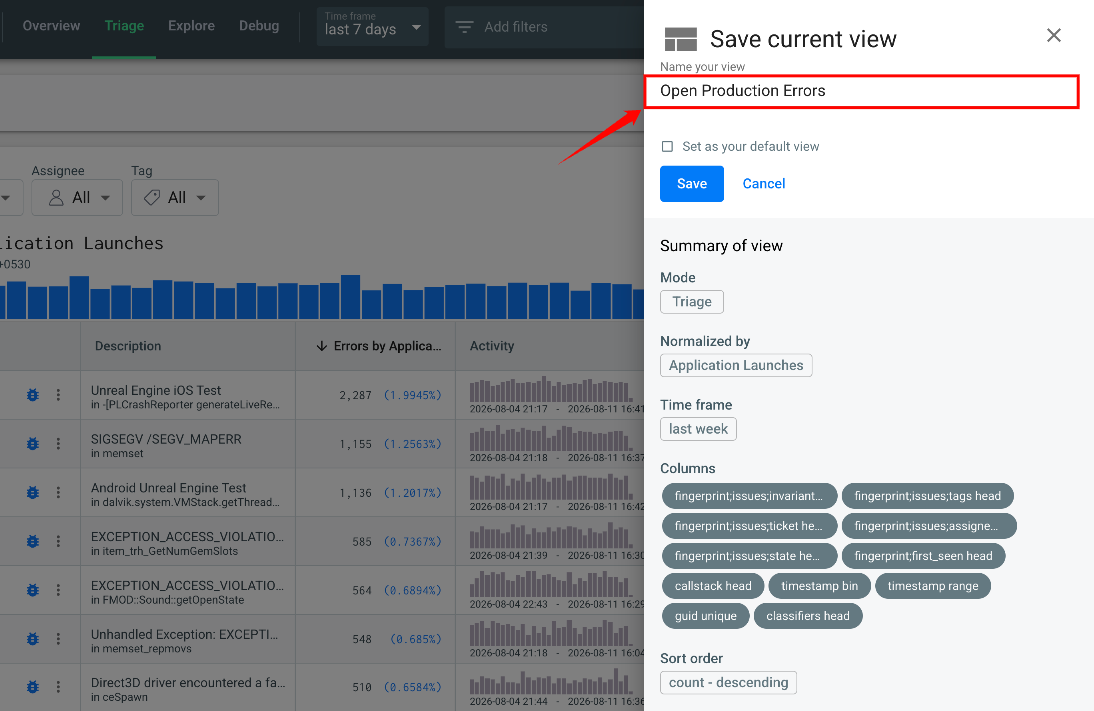
Step 4: Click Save. The view is added to your saved Triage views.