View Fingerprint in Debugger
Open a fingerprint in the Debugger to examine its latest trace and callstack. The Debugger helps you find where an error occurred and gather the details you need to fix it.
The Triage dashboard tells you which errors occur and how often. The Debugger shows what was happening in the application when an error occurred: the error message, the threads that were running, the sequence of function calls that led to the error, and the register values at that moment. Use it when you're ready to dig into the code-level cause of a fingerprint.
Open a Fingerprint in the Debugger
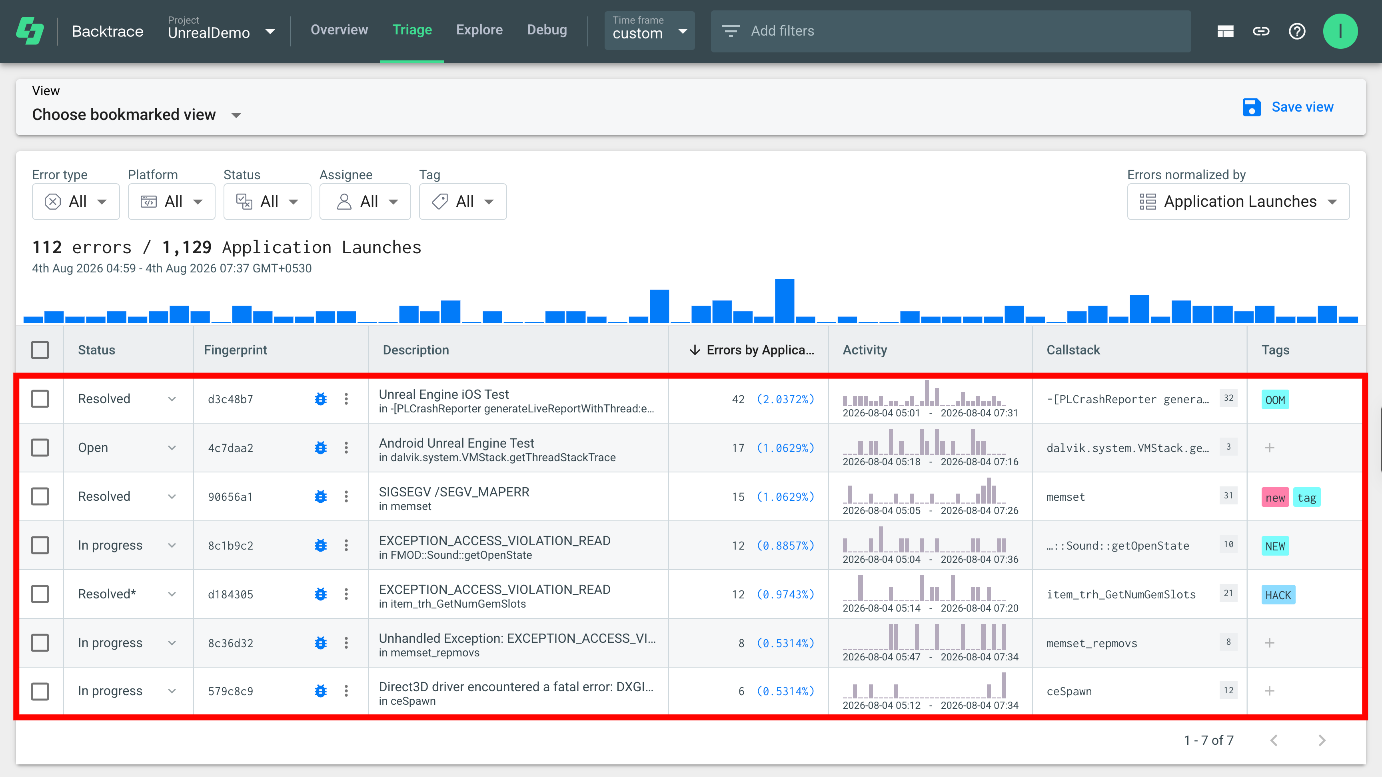
Step 1: In the Triage view, find the fingerprint you want to investigate.
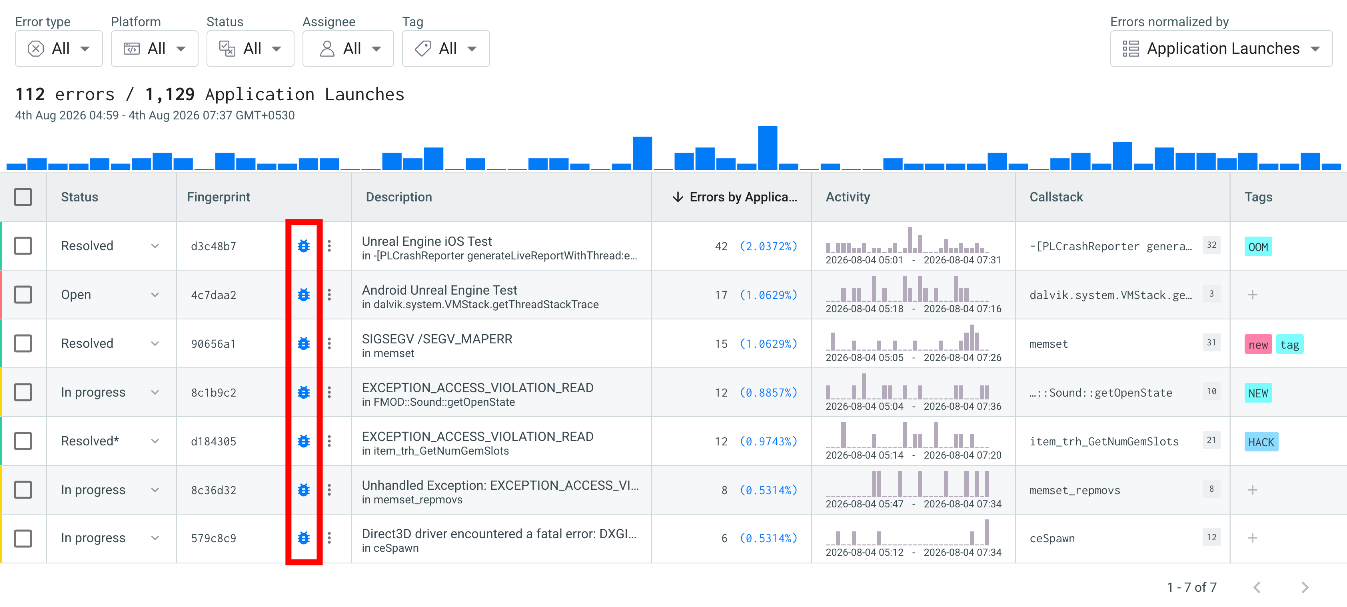
Step 2: Click the Debugger icon for the fingerprint. The View in Debugger tooltip appears when you hover over the icon.
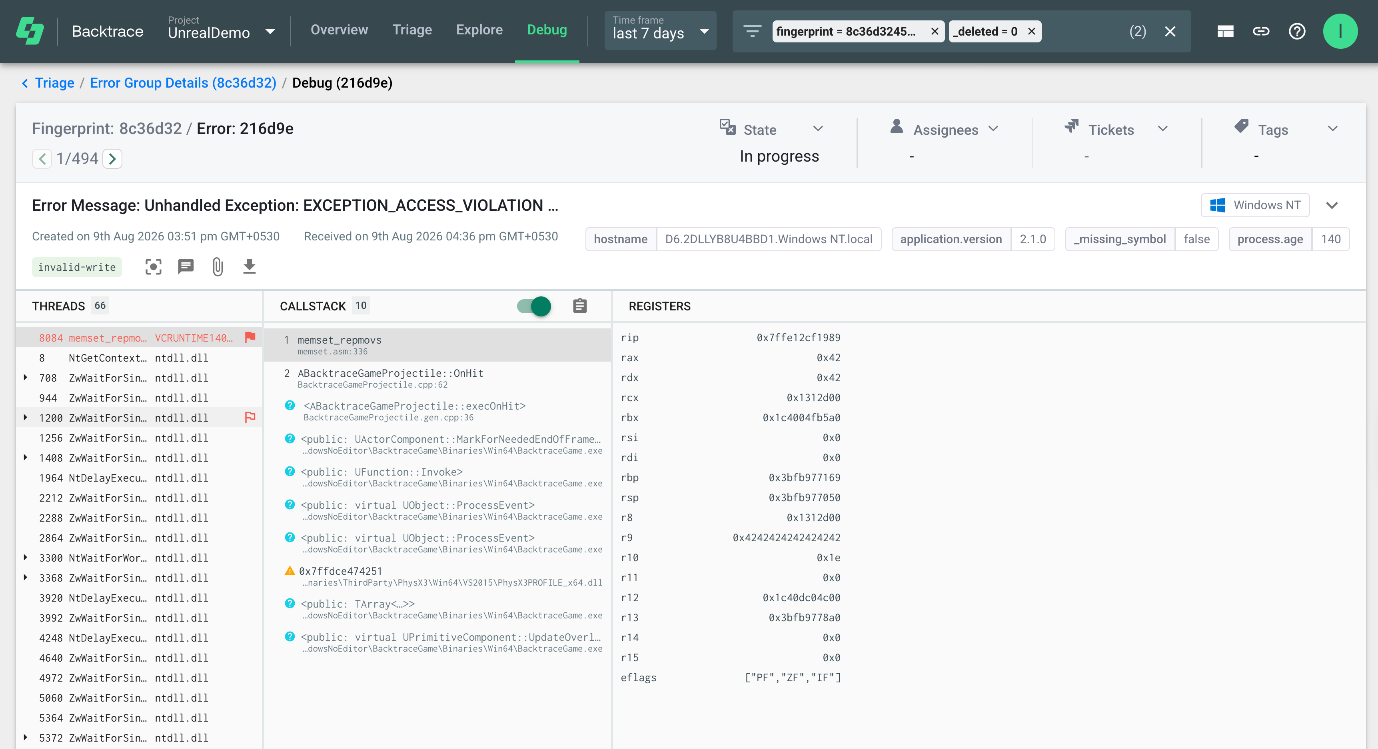
Step 3: The fingerprint's latest trace opens in the Debugger.
Review the Debugger
The Debugger shows the following information about the error:
| Debugger Feature | Description |
|---|---|
| Error Message | The error associated with the fingerprint. |
| Threads | The threads involved in the error and their execution context. |
| Callstack | The sequence of function calls that led to the error. Use it to trace the execution path and find where the error occurred. |
| Registers | The register values captured when the error occurred. |
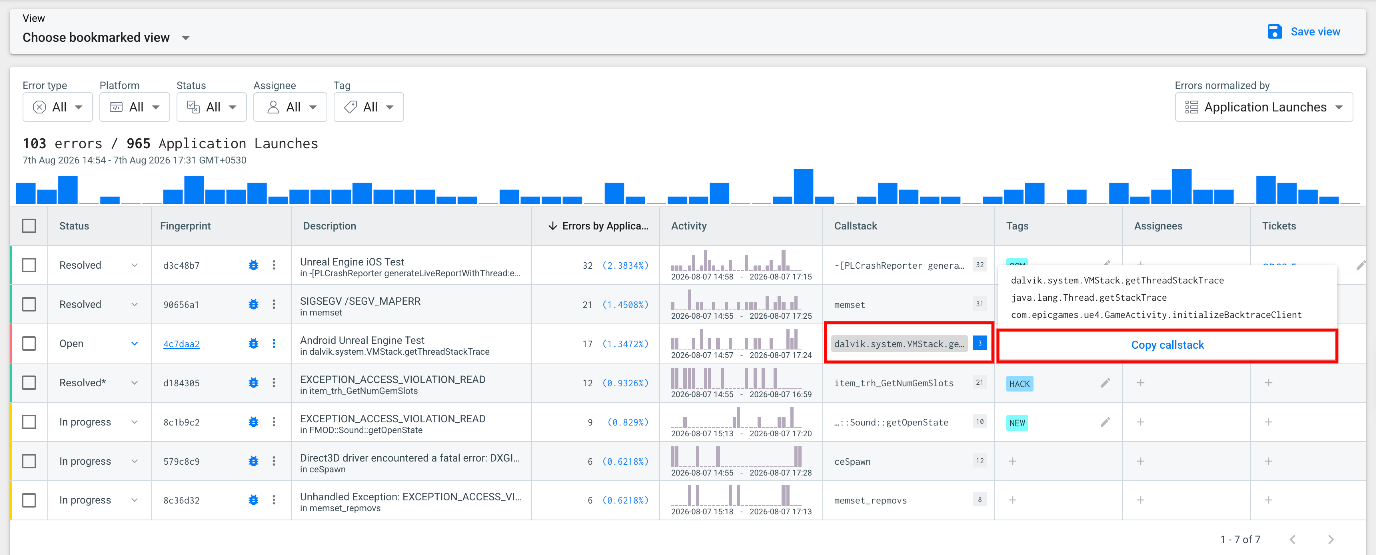
Copy the Callstack
To share the callstack, hover over the Callstack and select Copy callstack from the pop-up. The copied callstack includes extra details, such as frame and line numbers. For more information, see Inspect and Copy the Callstack.