View Fingerprint Group Details
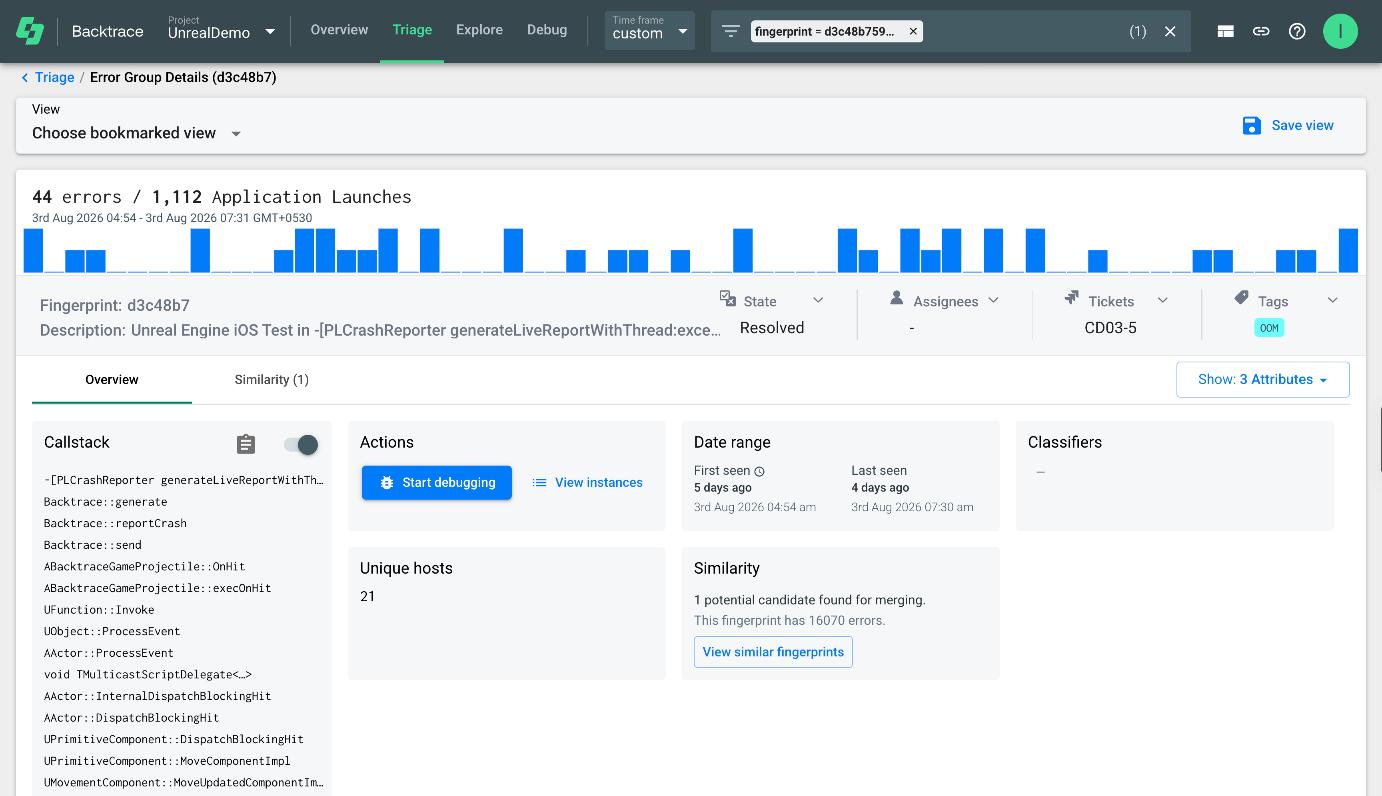
The Fingerprint Details page shows everything about a single fingerprint in one place: its callstack, attributes, related errors, comments, tags, and linked issues. Use it to understand how much impact an error has, spot patterns, and find its root cause.
The Triage dashboard gives you one row of information per fingerprint. When you need more than that, open the Fingerprint Details page. It shows how often the error occurs compared with application launches, when it was first and last seen, which environments it affects, and how many hosts reported it. From the same page, you can start debugging, view individual instances, and find other fingerprints that might represent the same issue.
Open the Fingerprint Details Page
Step 1: In the Triage dashboard, find the fingerprint you want to investigate in the Fingerprint column.
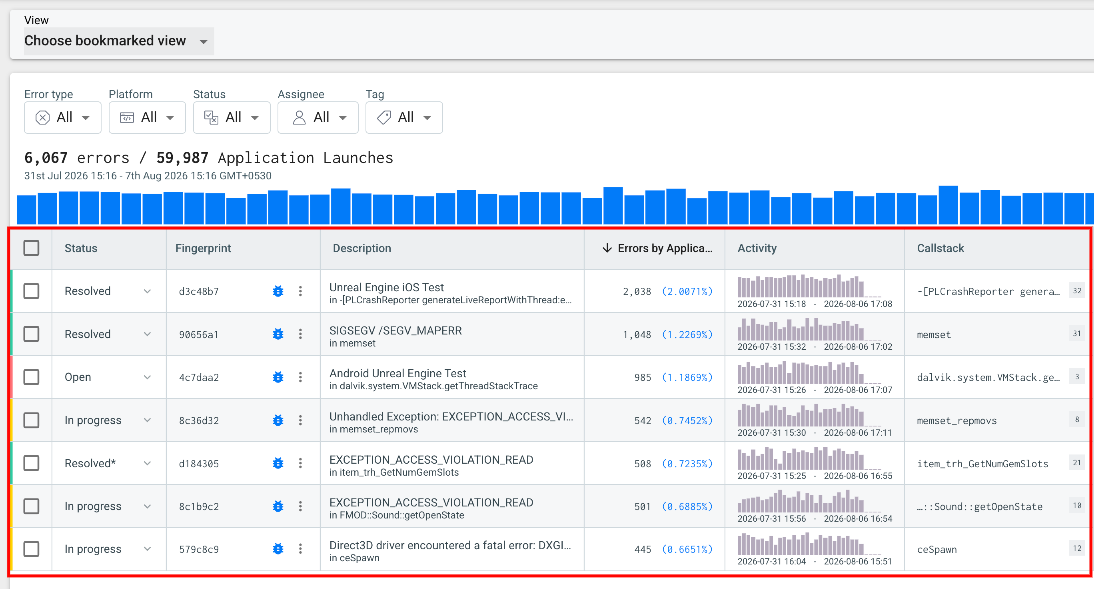
If needed, use the filters or change the time frame to find the fingerprint.
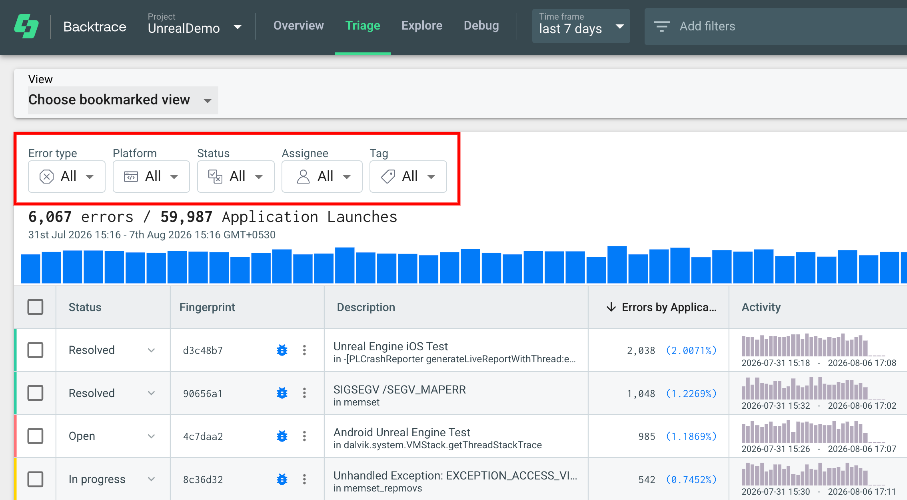
Step 2: Click the fingerprint ID.
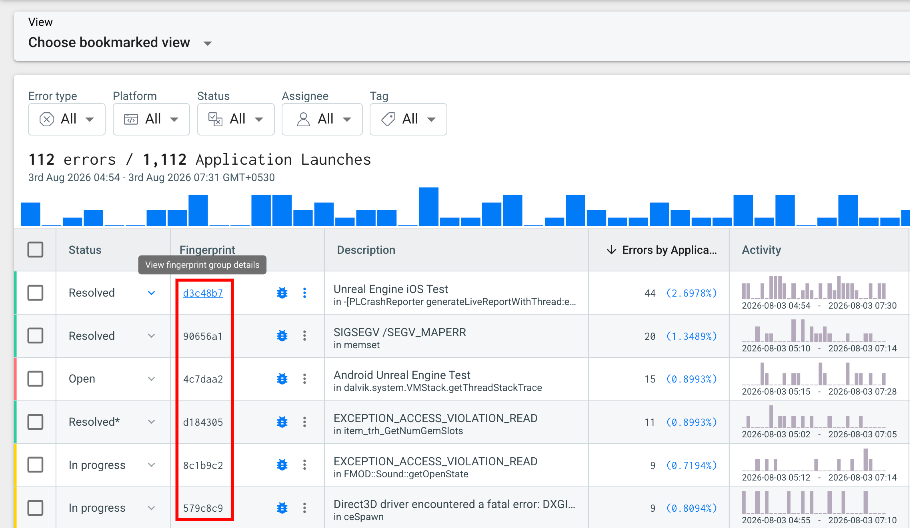
The Fingerprint Details page opens.
Understand the Fingerprint Details Page
The page has three main areas:
- Fingerprint Summary: Key facts about the fingerprint, at the top of the page.
- Overview tab: The callstack, investigation actions, and metadata.
- Similarity tab: Other fingerprints that might represent the same issue.
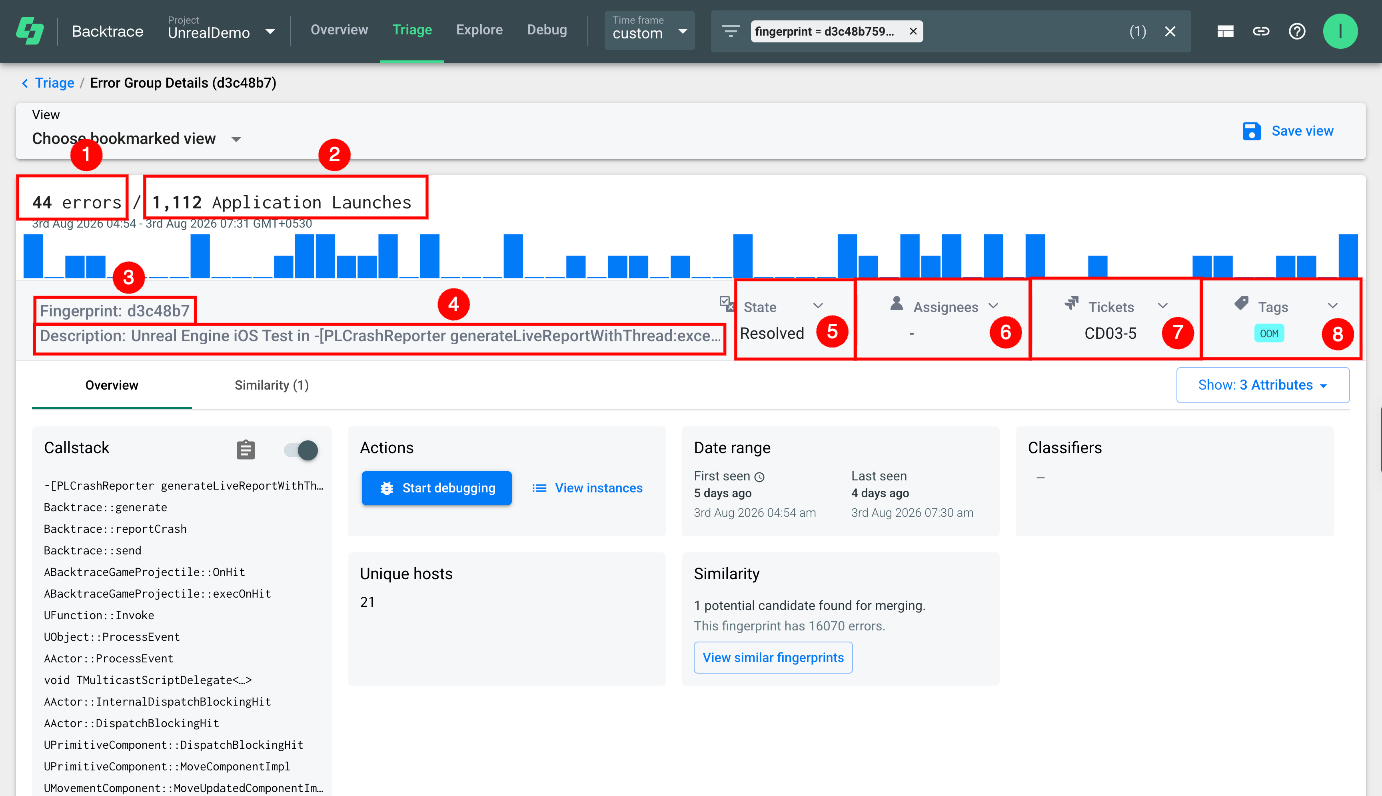
Fingerprint Summary
The Fingerprint Summary at the top of the page gives you a quick picture of the fingerprint before you dig into the details.
| Ref. | Field | Description |
|---|---|---|
| 1 | Errors | The number of errors recorded for the fingerprint during the selected time period. |
| 2 | Application Launches | The number of application launches during the selected time period. Compare it with Errors to judge how often the error occurs. |
| 3 | Fingerprint ID | The fingerprint's unique identifier in the project. |
| 4 | Description | A short summary of the error or exception. |
| 5 | Status | The fingerprint's status: Open, In Progress, Resolved, or Muted. |
| 6 | Assignees | The users assigned to investigate the fingerprint. |
| 7 | Tickets | Linked issues, such as Jira issues. |
| 8 | Tags | System-generated and custom tags applied to the fingerprint. |
Overview Tab
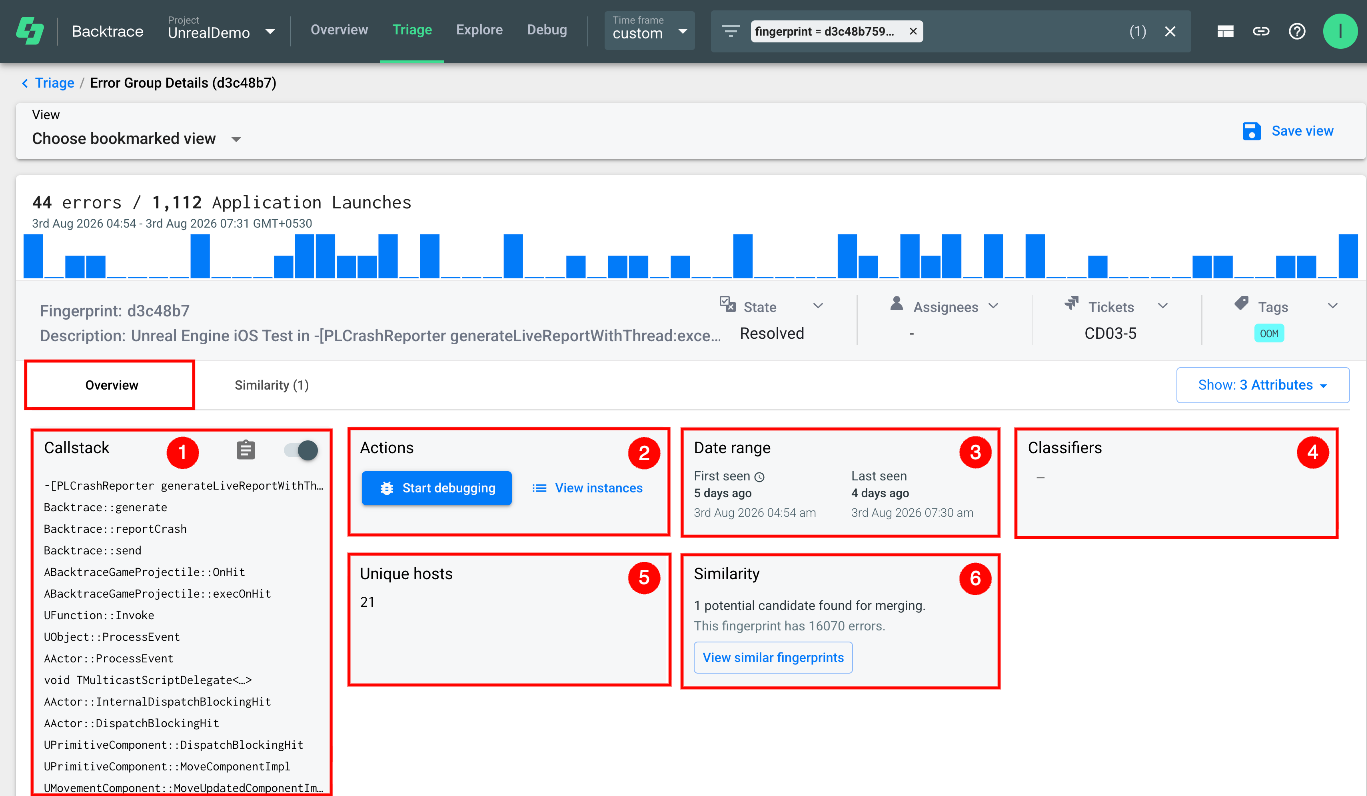
The Overview tab opens by default. It contains the following sections:
| Ref. | Section | Description |
|---|---|---|
| 1 | Callstack | The normalized callstack for the fingerprint. Use it to see where the error occurred and which function calls led to it. |
| 2 | Actions | Shortcuts such as Start Debugging and View Instances. |
| 3 | Date Range | When the fingerprint was first and last seen in the selected time period. Use it to tell whether the issue is new or recurring. |
| 4 | Classifiers | Classifier values for the fingerprint, such as application version, operating system, or platform. Use them to spot patterns across environments. |
| 5 | Unique Hosts | The number of unique hosts that reported the fingerprint. Use it to estimate how widespread the issue is. |
| 6 | Similarity | Fingerprints with similar characteristics. Use it to find fingerprints that may represent the same issue. |
Similarity Tab
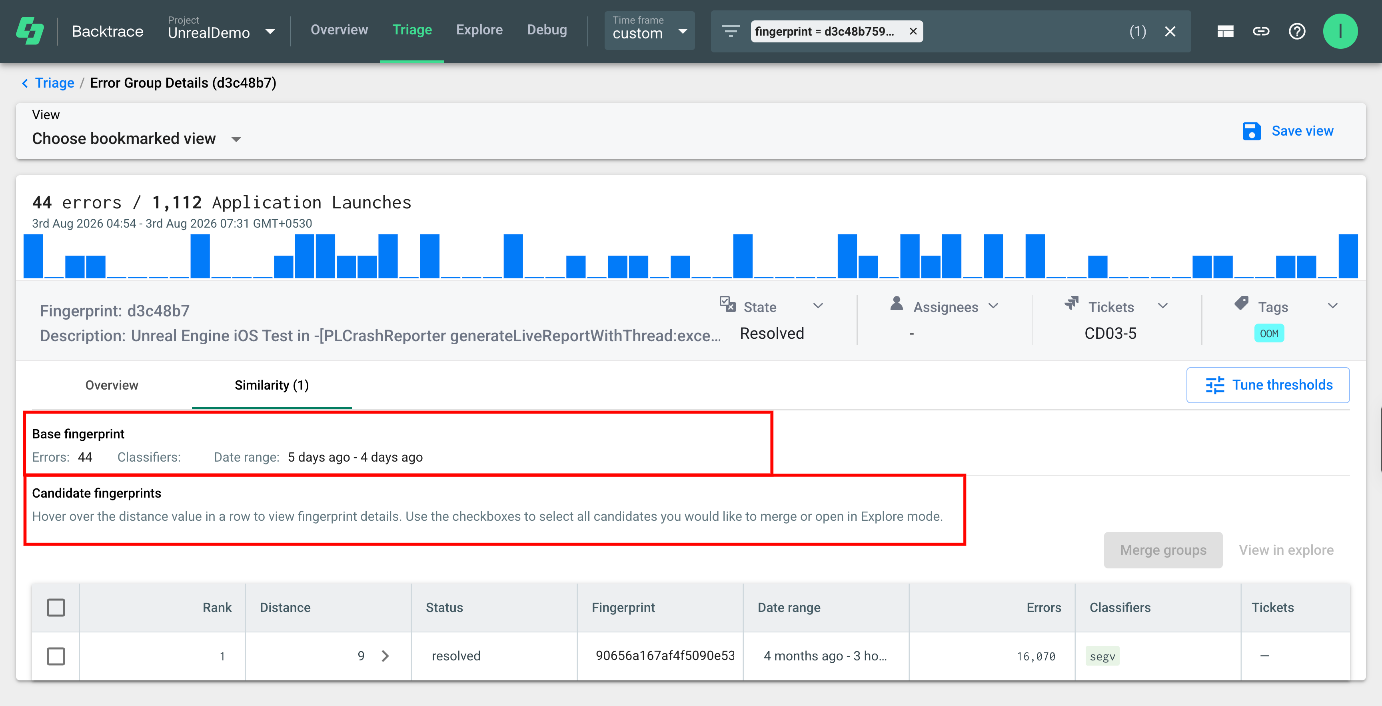
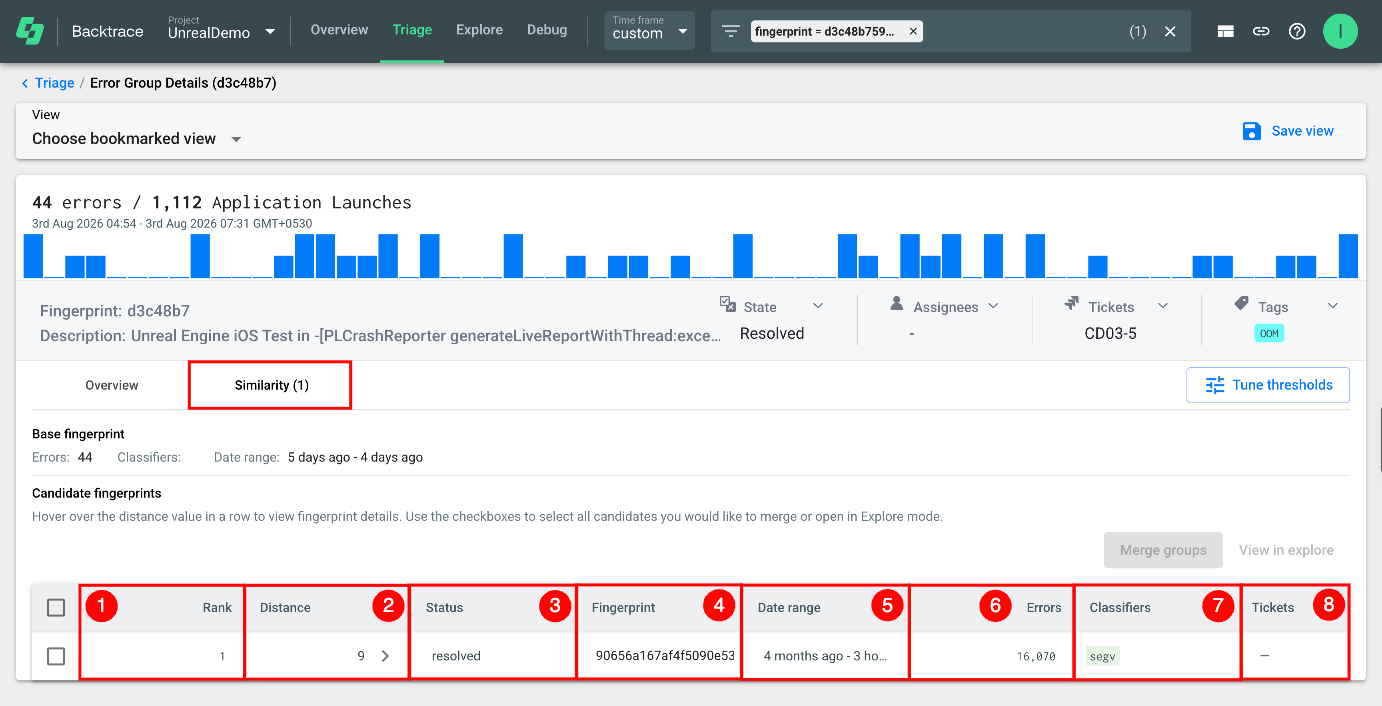
The Similarity tab lists other fingerprints that Error Reporting considers similar to the one you're viewing. Use it to find fingerprints that represent the same issue and might need to be merged.
To open it, click Similarity next to the Overview tab. The number in parentheses shows how many similar fingerprints were found.
| Section | Description |
|---|---|
| Base Fingerprint | The fingerprint you're viewing, with its error count, classifiers, and date range. Other fingerprints are compared with this one. |
| Candidate Fingerprints | Fingerprints identified as similar to the base fingerprint. Select candidates with the checkboxes, then click Merge groups to merge them or View in explore to open them in Explore. |
Candidate Fingerprints Table
| Ref. | Column | Description |
|---|---|---|
| 1 | Rank | The candidate's similarity rank. Higher-ranked candidates are usually more similar. |
| 2 | Distance | How closely the candidate matches the base fingerprint. Lower values mean a closer match. Hover over the value to preview the candidate's details. |
| 3 | Status | The candidate's status: Open, In Progress, Resolved, or Muted. |
| 4 | Fingerprint | The candidate's fingerprint ID. |
| 5 | Date Range | When the candidate was first and last seen. |
| 6 | Errors | The number of errors for the candidate in the selected time frame. |
| 7 | Classifiers | Classifier values for the candidate. |
| 8 | Tickets | Issues linked to the candidate, such as Jira issues. |
Tune Thresholds
Adjust the similarity thresholds to control which fingerprints appear as candidates in the Similarity tab.
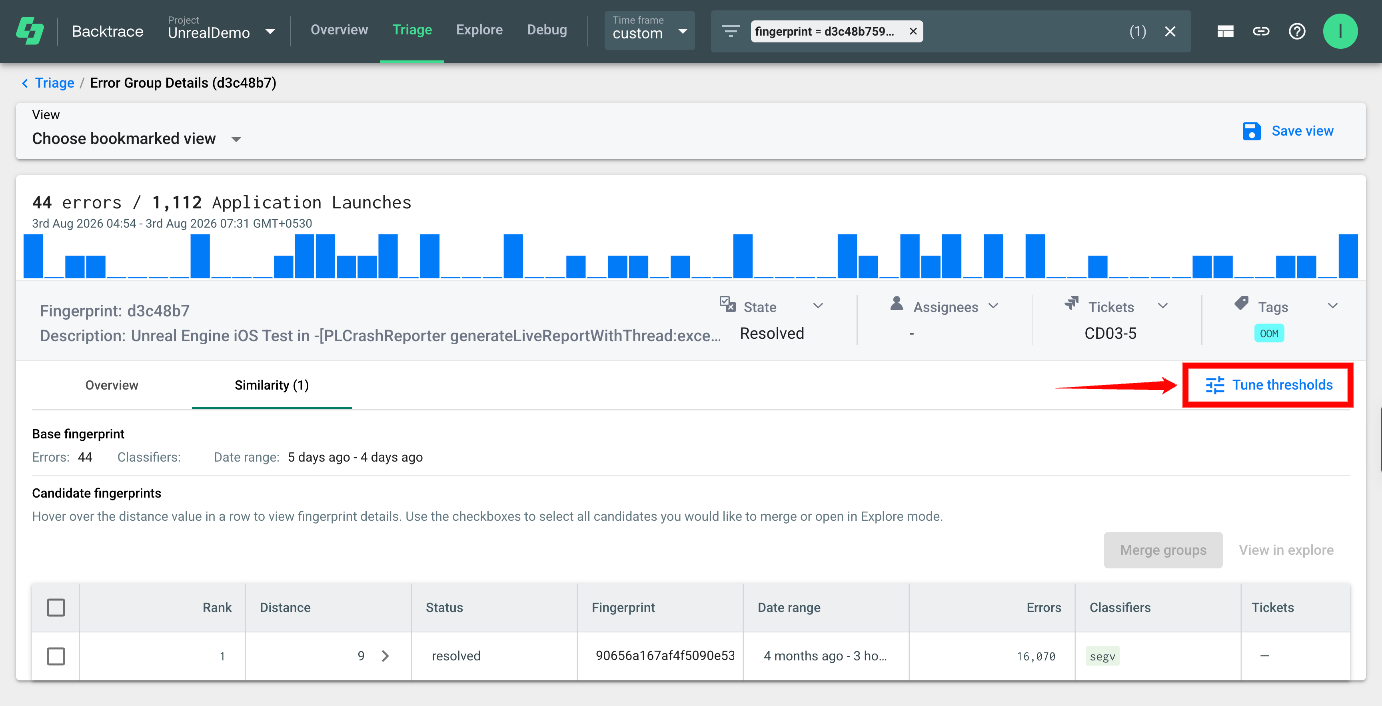
Step 1: On the Fingerprint Details page, open the Similarity tab.
Step 2: Click Tune thresholds.
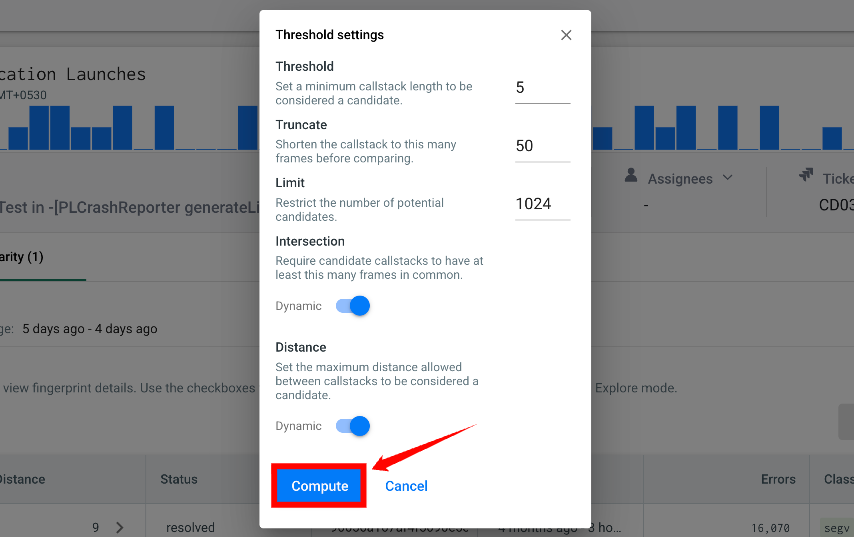
Step 3: In the Threshold Settings dialog, adjust the settings you want to change:
| Ref. | Setting | Description |
|---|---|---|
| 1 | Threshold | The minimum callstack length for a fingerprint to be a candidate. Higher values are more restrictive. |
| 2 | Truncate | The maximum number of callstack frames to compare. Comparing fewer frames can improve performance and focuses on the most relevant part of the callstack. |
| 3 | Limit | The maximum number of candidates returned. |
| 4 | Intersection | The minimum number of callstack frames a candidate must share with the base fingerprint. Enable Dynamic to let Backtrace choose this value. |
| 5 | Distance | The maximum distance allowed between callstacks. Lower values return only closely related fingerprints. Enable Dynamic to let Backtrace choose this value. |
Stricter settings return fewer, more closely related candidates. Looser settings return more candidates, which you may need to review more carefully.
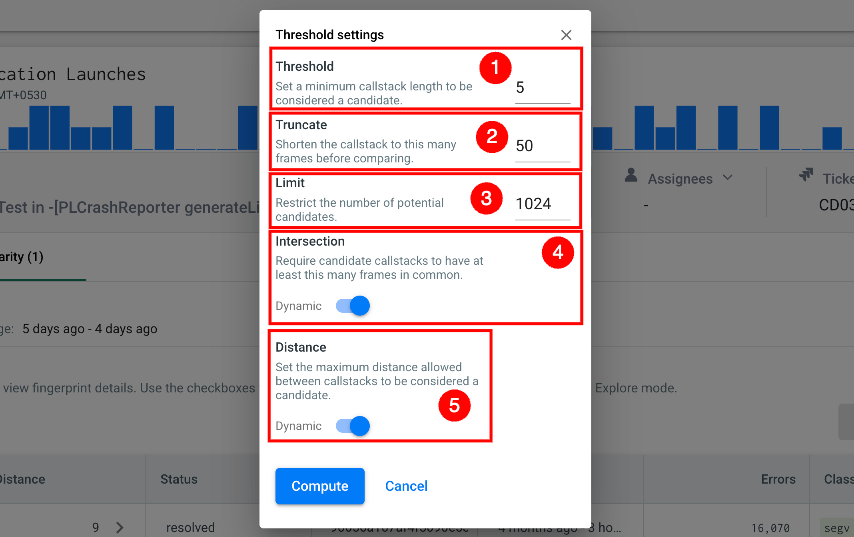
Step 4: Click Compute to apply the settings and recalculate the candidates, or click Cancel to close the dialog without changes.