App Crash Logs
The App Crash Logs feature on Sauce Labs' Real Device Cloud (RDC) platform facilitates the automatic capture and display of crash data, both during live and automated testing. This eliminates the necessity to integrate an SDK or connect crash reporting tools to our system.
Through the App Crash Logs feature, users gain access to a centralized view encompassing an array of app diagnostic signals. This expedites the debugging process for teams and reduces issue resolution time. Our primary objective is to establish expedited feedback loops for developers, enabling the early identification of risks and ensuring comprehensive coverage within the development cycle. With this enhanced capability, teams can effectively prioritize errors, crashes, and test failures based on complete data and context, focusing their efforts on the most critical issues.
Our tool has the capability to detect and record fatal errors (crashes) that occur during the testing of both iOS and Android apps. Specifically for Android apps, this information is sent to Error Reporting, enabling the viewing of detailed call stack information. Furthermore, our interface also renders all non-fatal errors and warnings originating from the native application visible. This feature streamlines debugging and facilitates seamless integration with other Mobile App Diagnostics components, ultimately enhancing issue identification and resolution efficiency.
What You'll Need
- A Sauce Labs account (Log in or sign up for a free trial license)
- A native Android, iOS, or iPadOS mobile app
- Make sure instrumentation is enabled, no other configuration is required.
Viewing the App Crash Logs for Real Devices
The App Crash Logs feature is automatically activated when the Instrumentation feature is enabled. Upon detecting a crash, our system will exhibit an App Crashed label for the corresponding test result, regardless of the test's status.
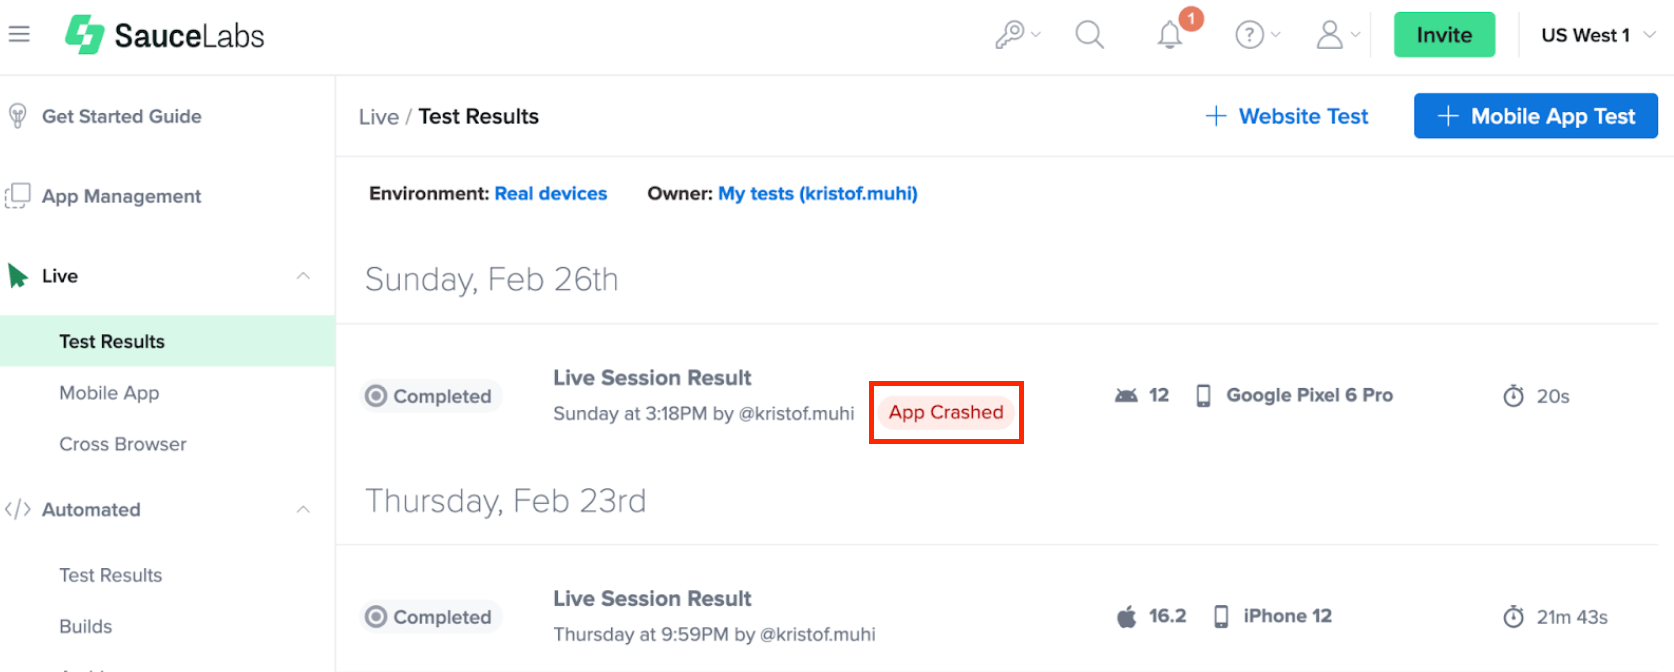
When you navigate to the Live Test Results or Automated Test Results page, you can view the collected crashes in the Crashes tab. The collected crashes are presented in the context of their respective test cases, videos, and interactions. This centralized view is designed to enable efficient collaboration within your team and improve time to resolution for any issues that may arise.
Viewing the App Crash in the Crashes Tab
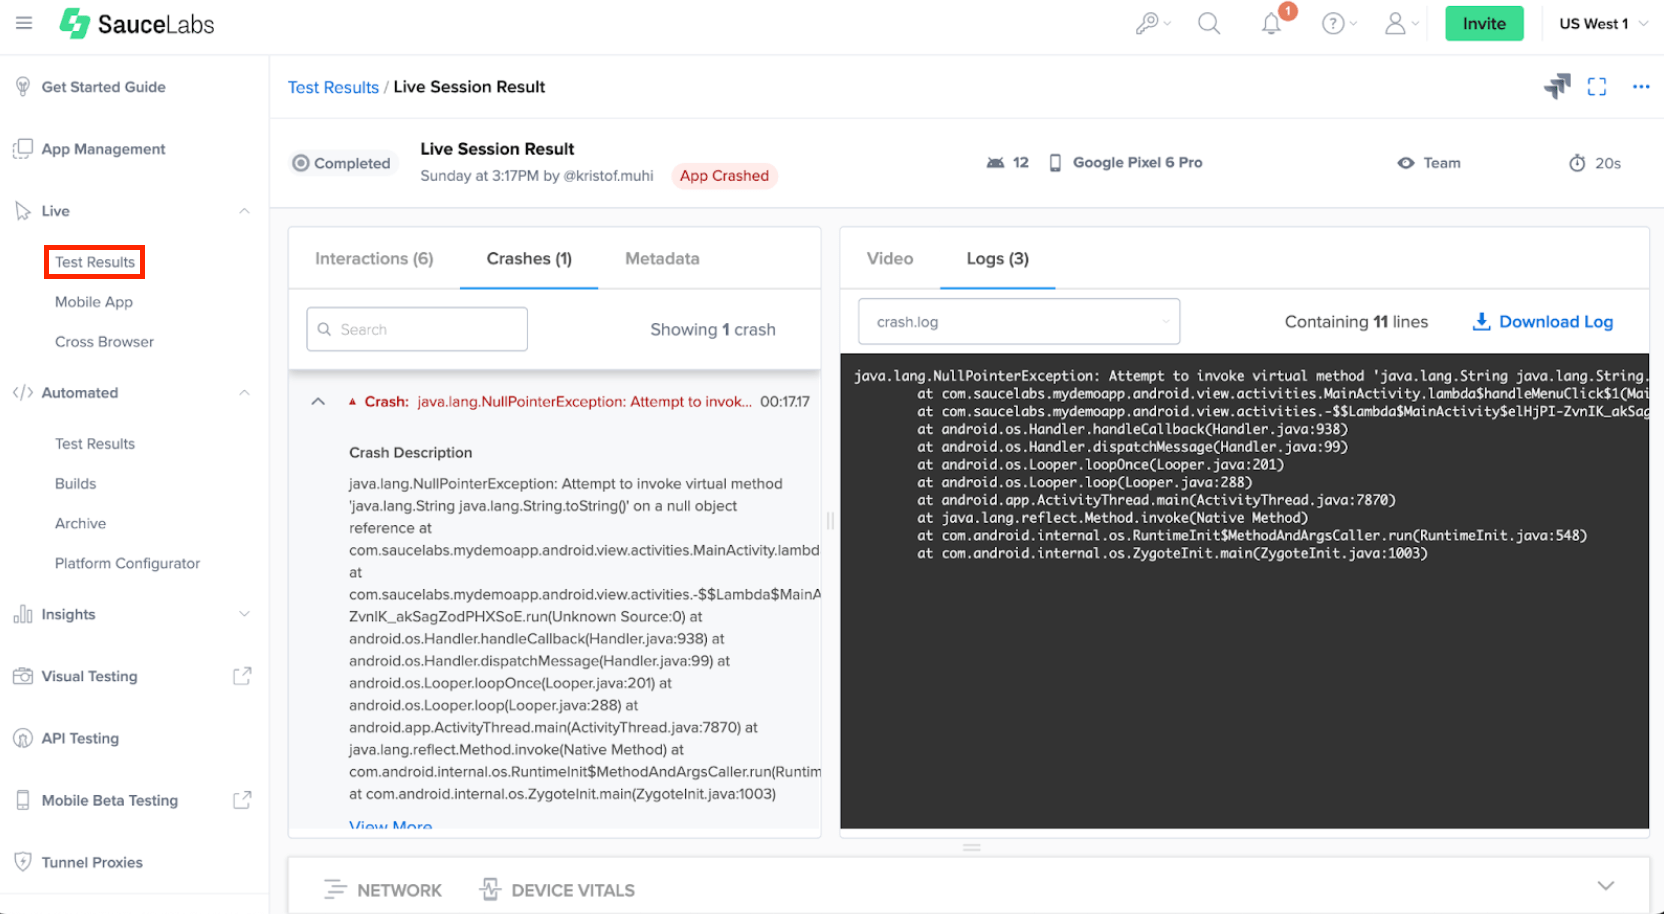
The crash.json file provides information on the stack trace, methods, classes, and lines of code that were being executed before the fatal error occurred. This information facilitates the identification of the root cause of the crash, enabling your team to address the underlying issues in a timely and effective manner.
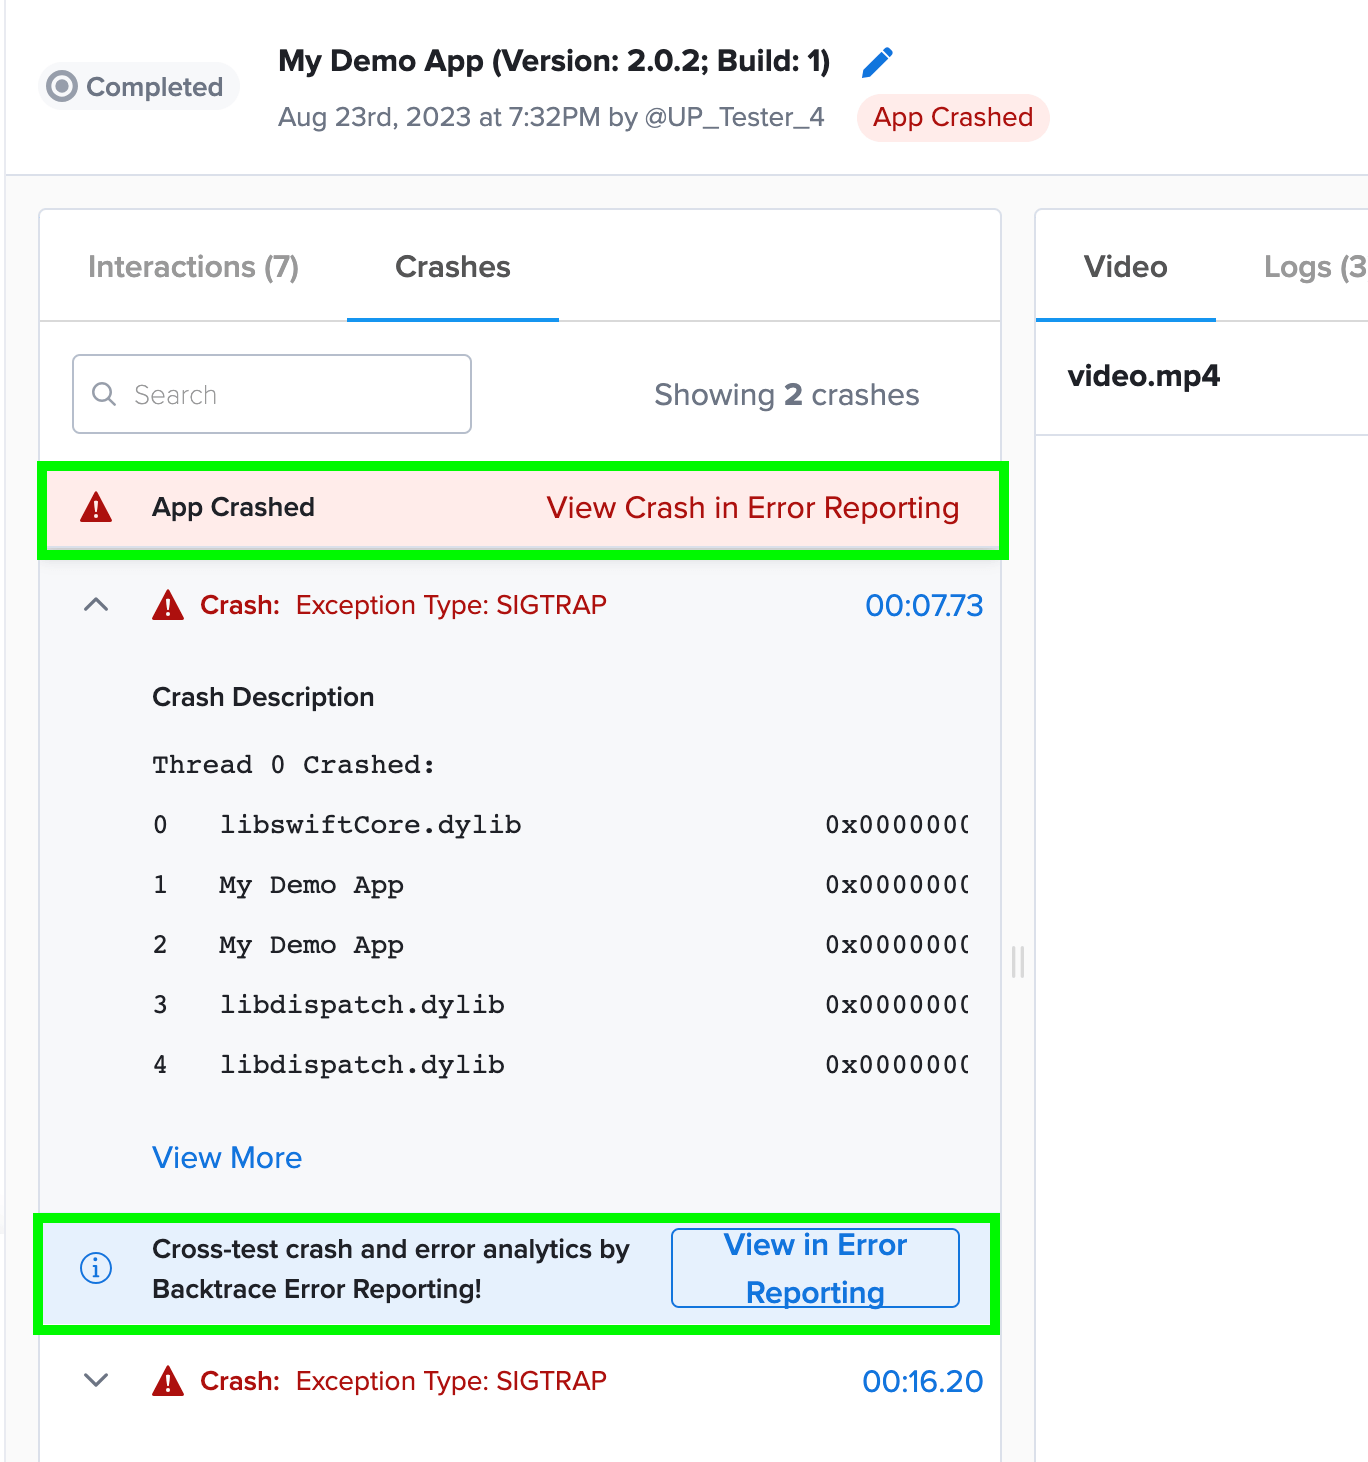
In the Crashes tab, you will also find a View Crash in Error Reporting link, which directs you to Error Reporting for a detailed view of the crash logs.
Similarly, in the Automated Test section, the Commands tab includes a label directly linked to the Error Reporting.
Viewing the App Crashes in Error Reporting
While the Crashes Tab contains the stack trace, which can be useful for initial debugging of the root cause, more comprehensive insights are available within Error Reporting. Moreover, Error Reporting is the sole location to access callstack details for native crashes.
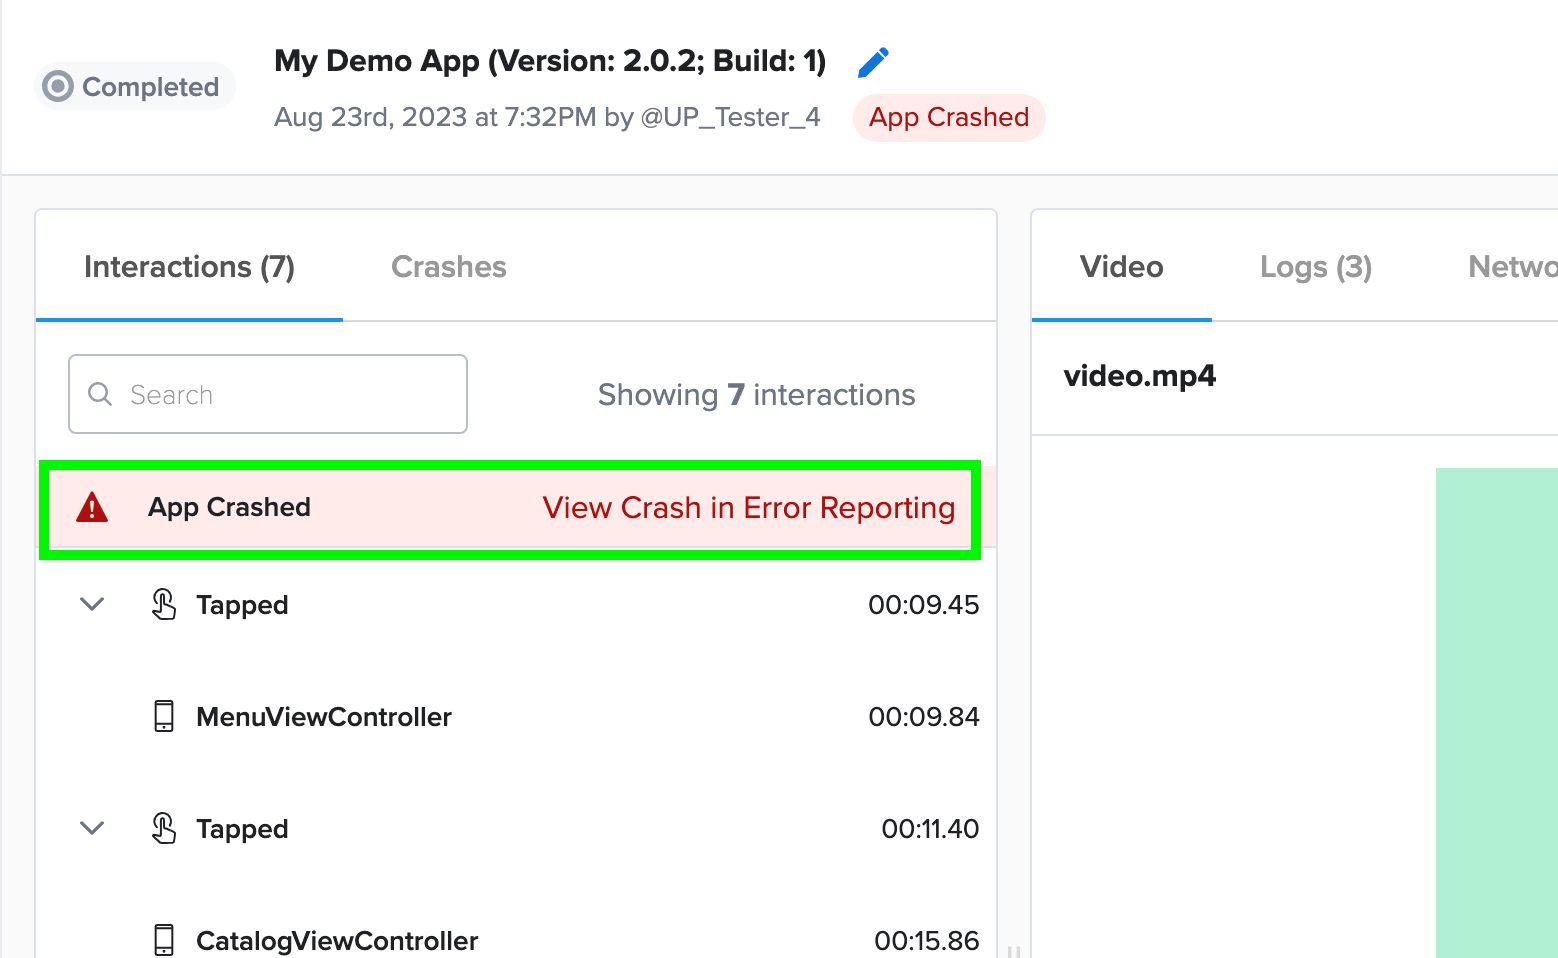
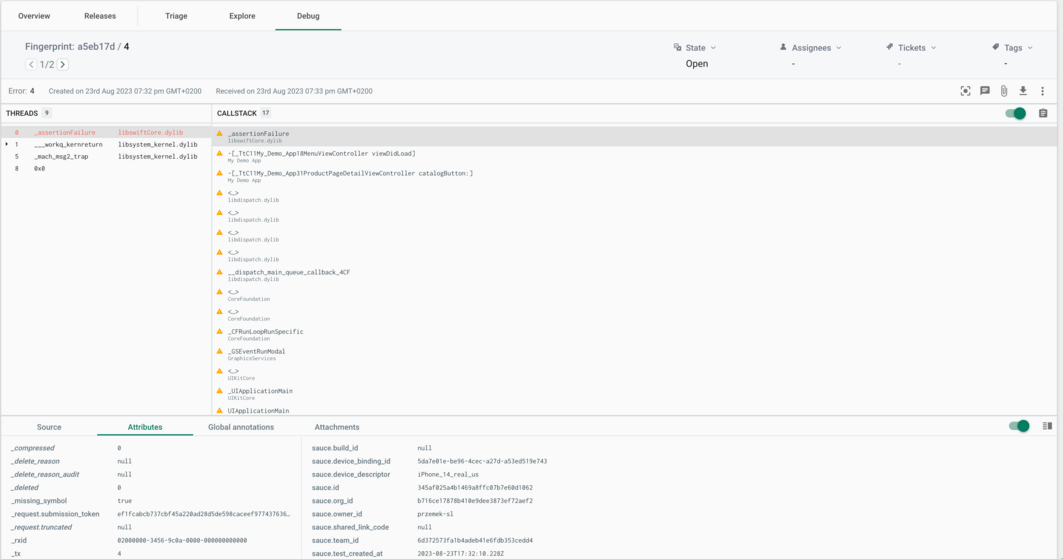
Inside the Interactions tab, clicking on the View Crash in Error Reporting link will seamlessly direct you to the Error Reporting Debug view, specifically tailored to that session. Here, Error Reporting furnishes you with extensive information, encompassing threads and callstack specifics. This approach streamlines troubleshooting by grouping similar errors, thus avoiding repetitive debugging of identical issues.
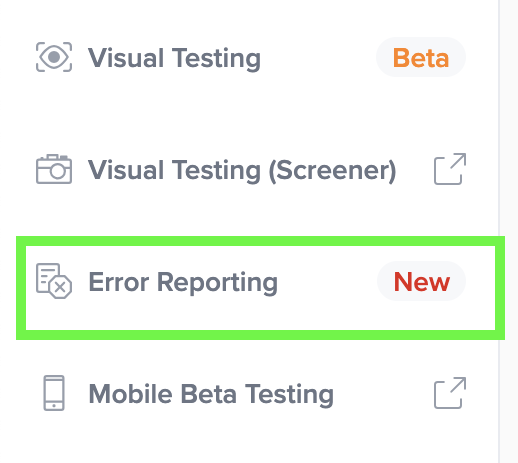
An alternative method for accessing the Backtrace instance to review the crash report is by clicking the Error Reporting link in the Sauce Labs sidebar.
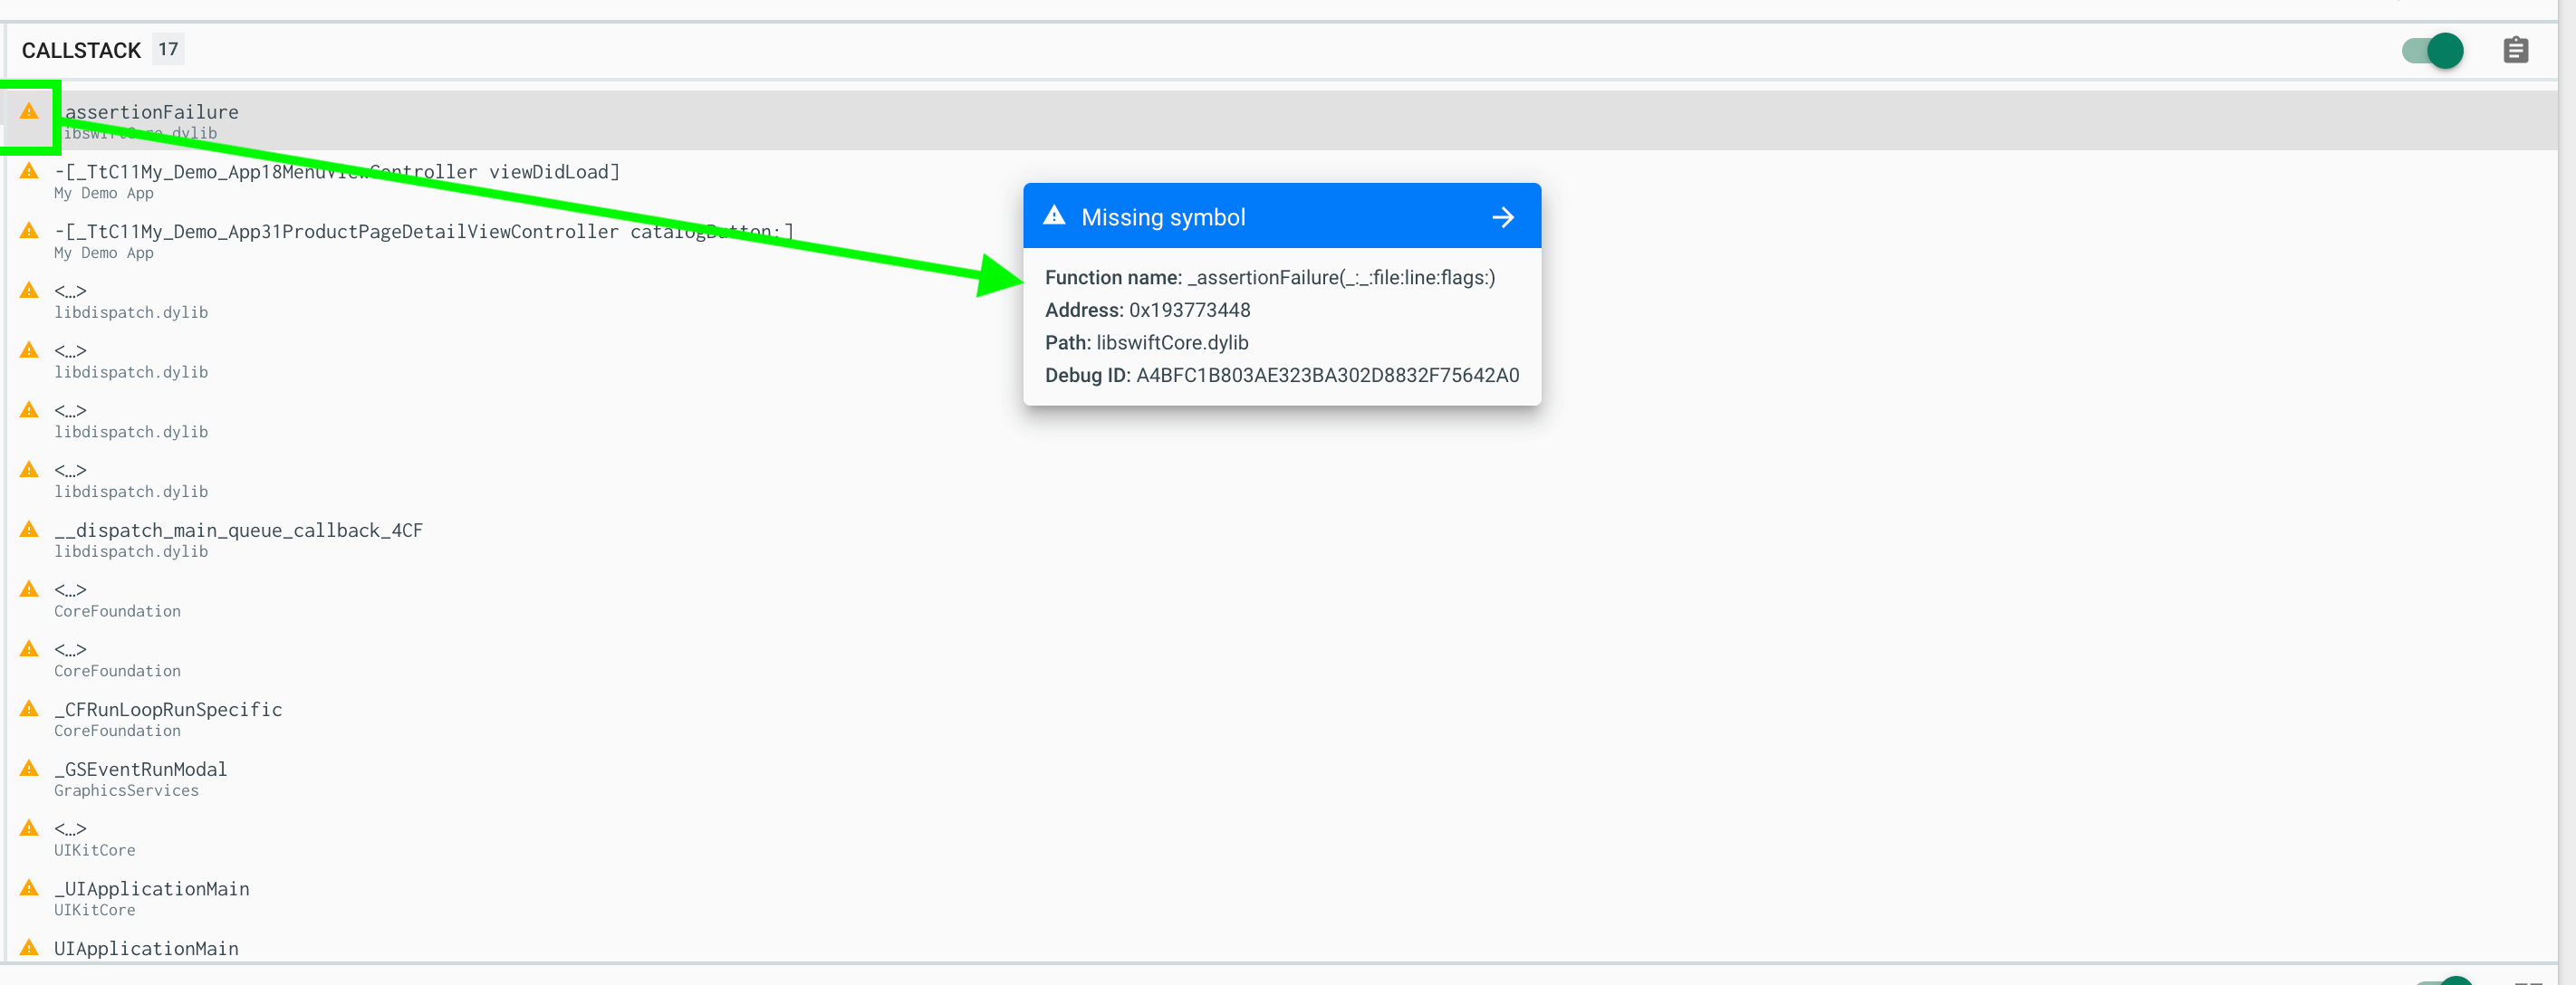
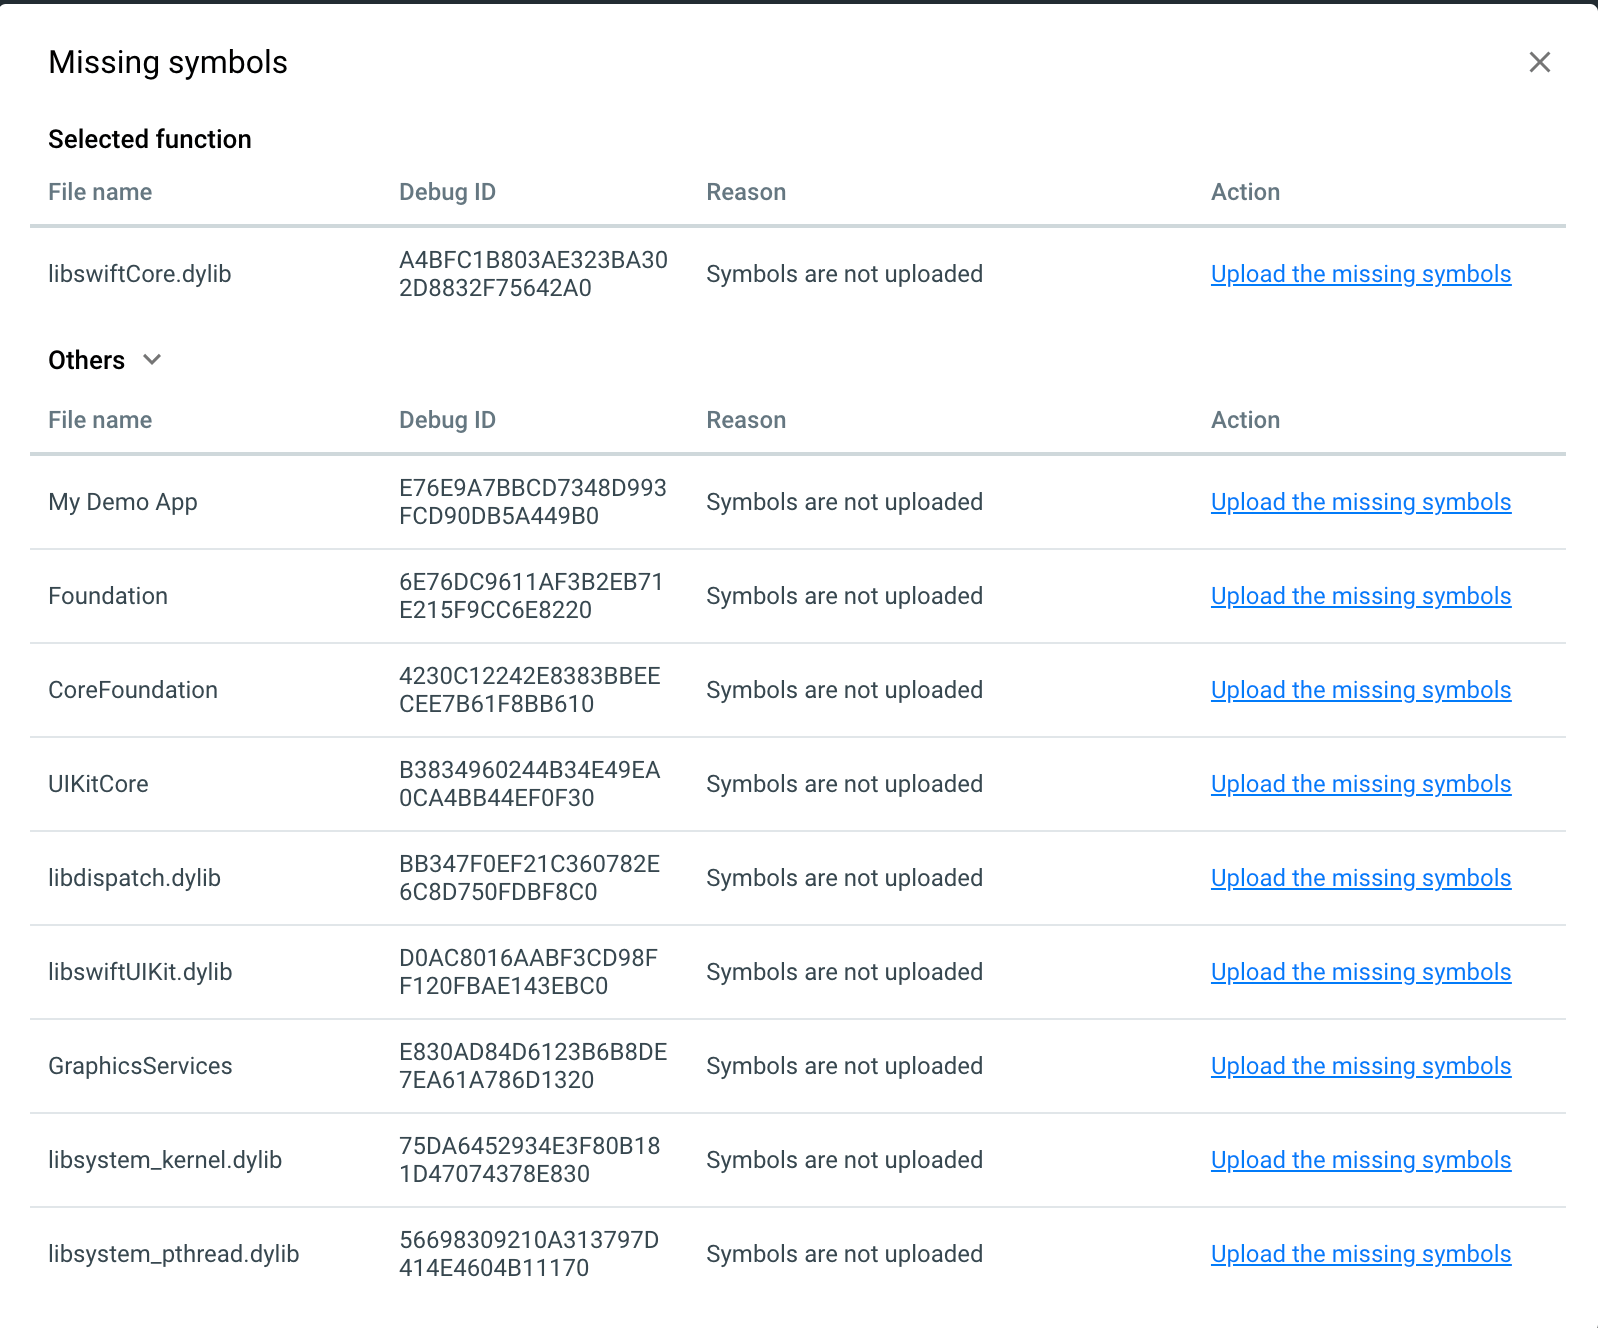
Hovering over the warning icon adjacent to the function name reveals the underlying cause, and further clarity can be gained by clicking the arrow in the popup to reveal associated details.
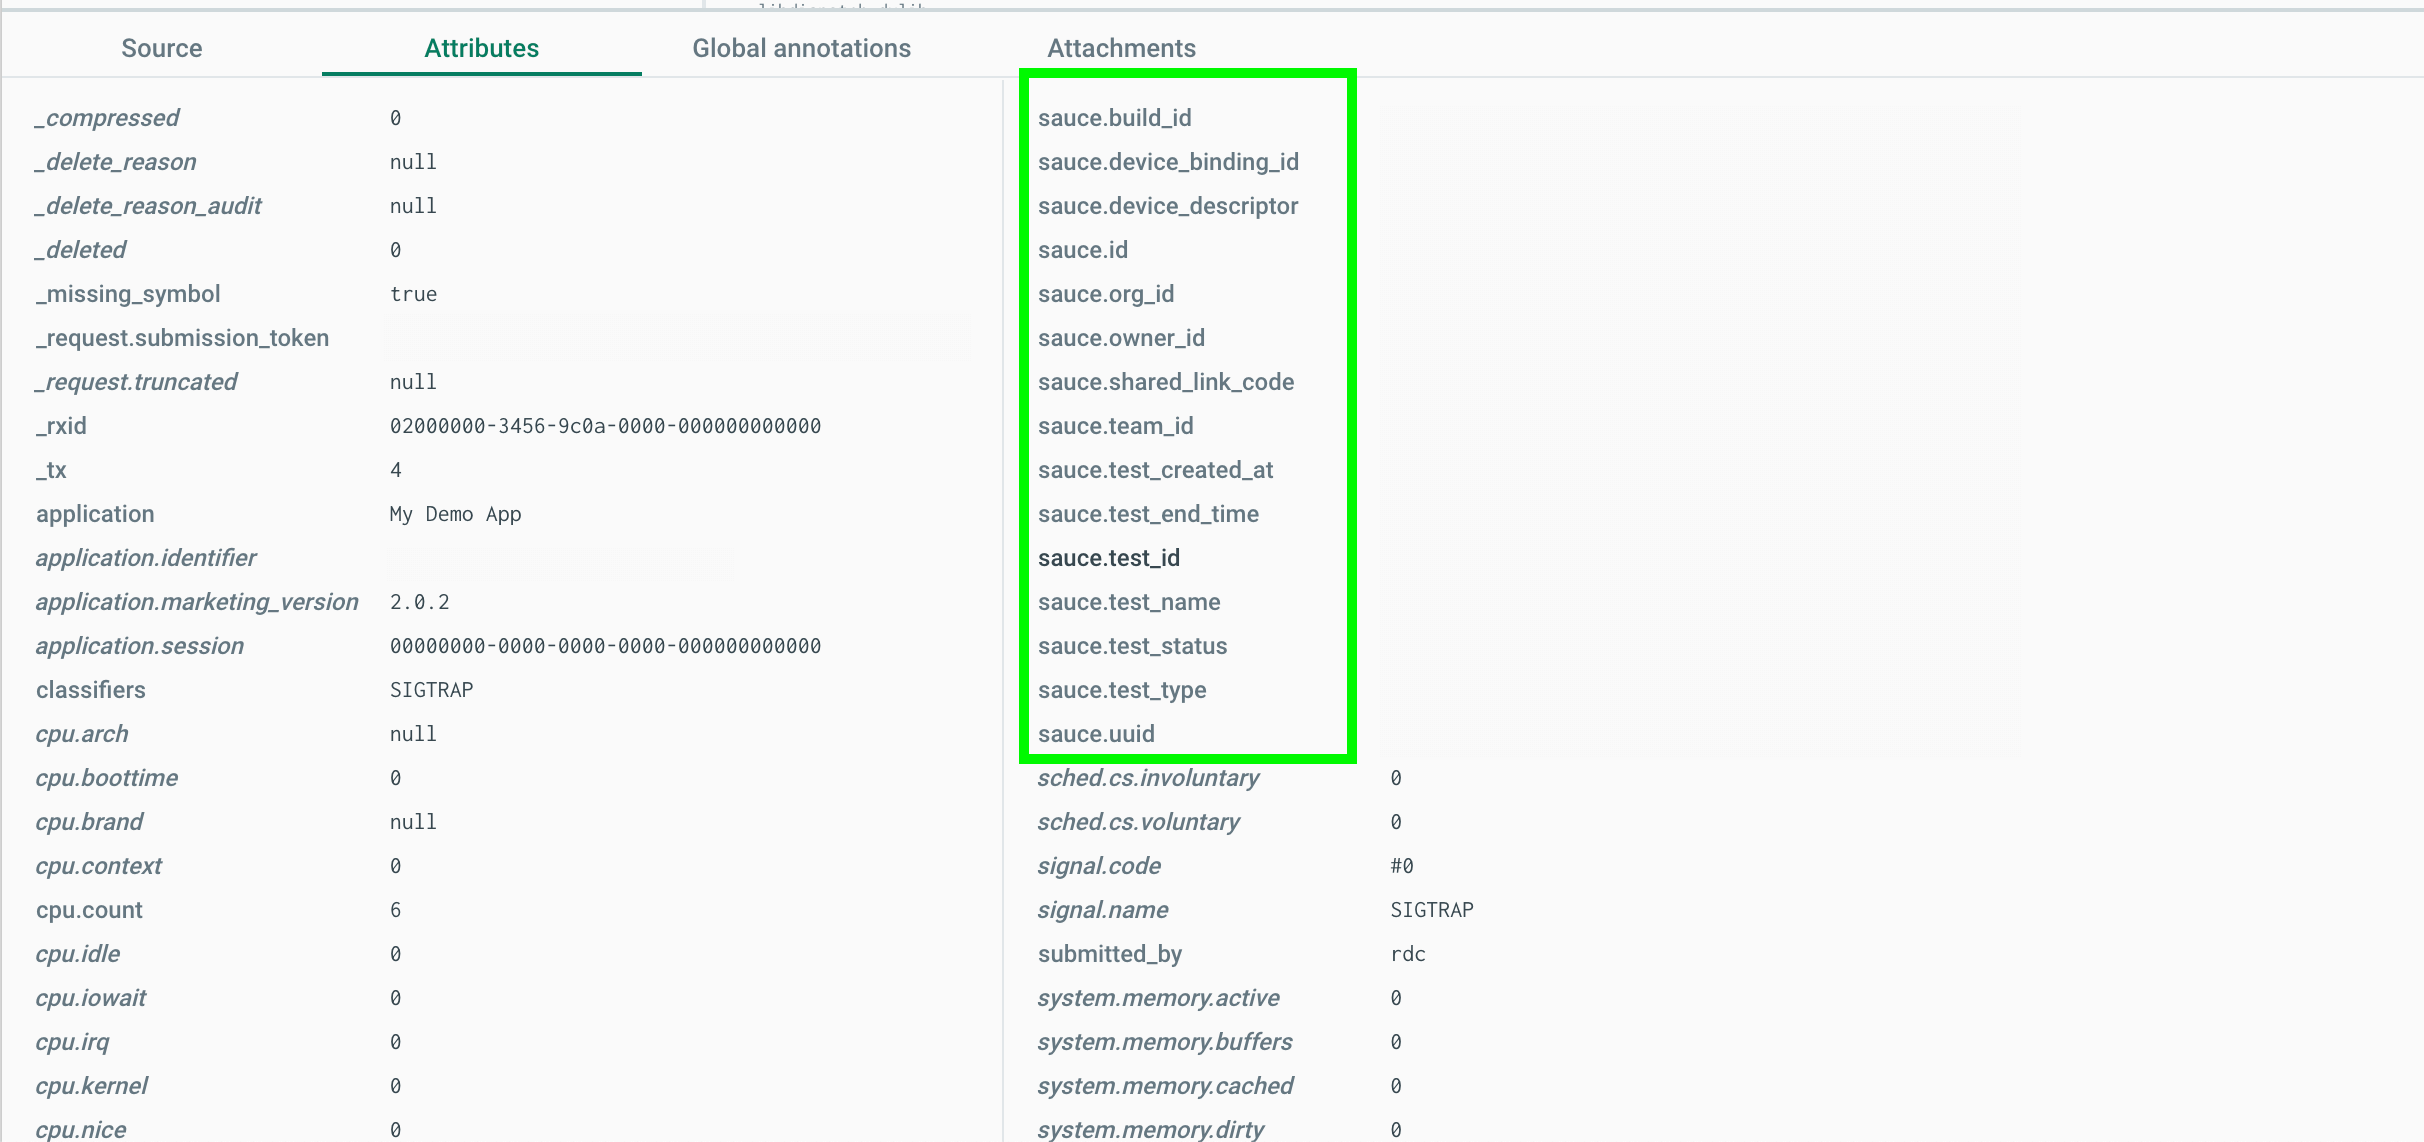
Live sessions may entail multiple crashes. To streamline the identification of crashes occurring during RDC testing, the Attributes Tab presents designated attributes labeled as sauce.<someattribute>.
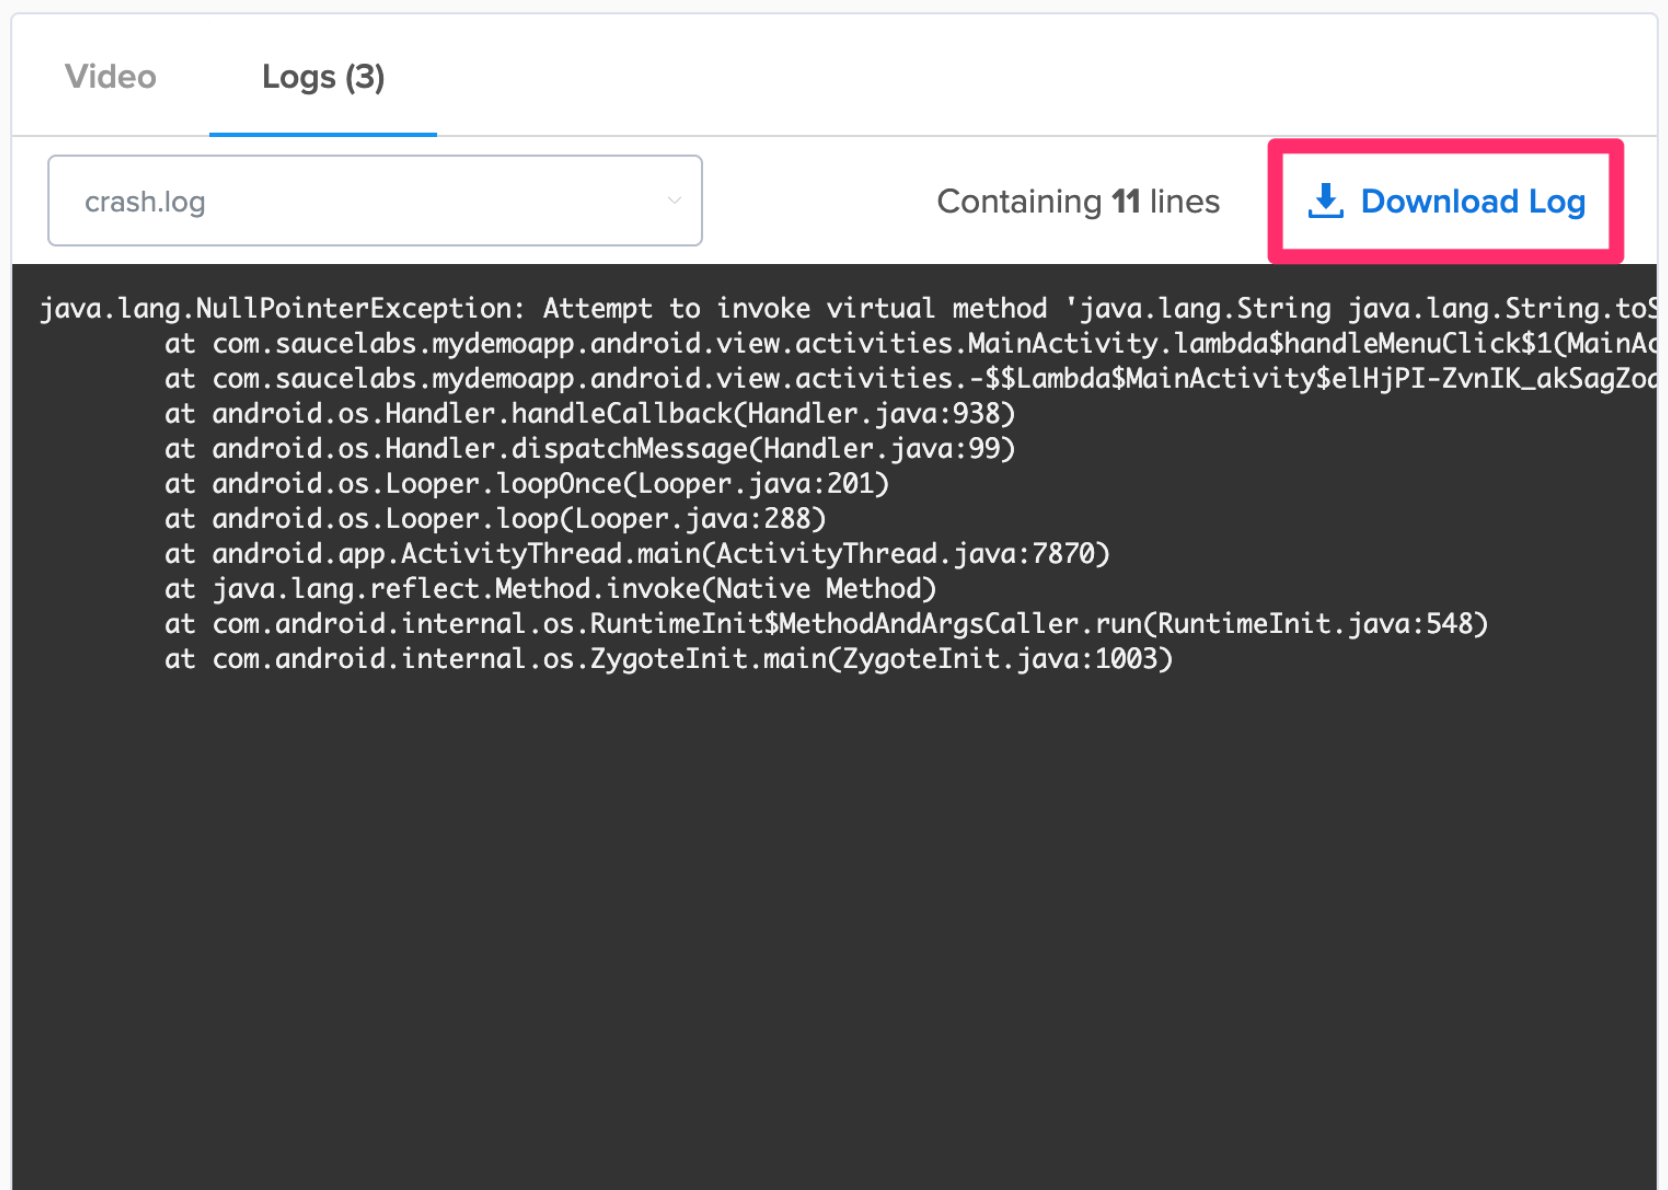
Downloading the App Crash Log
You can download the crash log as a text file to save and share with Sauce Labs support for further analysis. This feature allows you to keep a record of the crash logs and use them for future reference or troubleshooting:
You can also download the results using the API call below and send it to your development team:
curl --compressed \
-O https://{SAUCE_USERNAME}:{SAUCE_ACCESS_KEY}@{DATA_CENTER}.saucelabs.com/v1/rdc/jobs/{JOB_ID}/crash.json`
Limitations
- Does not capture hangs and cross-platform development frameworks, like React Native and .NET MAUI
- Emulators/Simulators are not supported.
- If you have a native crash reporting SDK in your application (including Backtrace), this feature will override it; therefore, you will not see the crash report in your existing system.