Load Testing with API Testing
The Sauce Labs API Testing load testing feature allows you to stress your endpoints using an existing functional test.
Run Your Load Test Agent
The first step is running your load test agent. The load agents run within your infrastructure. It’s up to you to run all the agents connected to the cloud. To make identifying them easier, you can group them by pool ID, assigning the same ID to more than one agent. A pool ID is an identifier of a group of workers. There’s no limit to the number of agents you can run. The only possible limitations are inherited from your infrastructure.
To run an agent, execute the following command:
docker run --pull always --rm \
--env SAUCE_URI=wss://<api_domain>/api-testing/ws/v4/loadtesting \
--env SAUCE_AUTH=<username>:<access_key> \
--env WORKER_ID=<worker_name> \
--env POOL_ID=<pool_name> \
--env MAX_VIRTUAL_USERS=<max_virtual_users> \
quay.io/saucelabs/loadtestingjs:latest
This command will run the agent in a Docker container, but you can manage them in any infrastructure (for example, Kubernetes).
Only two variables in the command are required: SAUCE_URI and SAUCE_AUTH; all the others are optional and, if not provided, will be auto-generated. The system will generate random names for WORKER_ID, POOL_ID will remain empty, and the default value for MAX_VIRTUAL_USERS is 100.
If your data center is EU Central 1, replace api_domain with api.eu-central-1.saucelabs.com. If your data center is US West 1, replace api_domain with api.us-west-1.saucelabs.com.
Create and Run Load Tests in APIT
Once you have run the agents, you can create and run load tests in the API Testing platform.
We count 1 out of every 100 load testing executions against your monthly execution limit. To see how many executions you have remaining, in APIT, click Activity > Usage By Month. On the Usage By Month page, the Monthly Usage Status shows the executions you have remaining for the month.
-
In Sauce Labs, click API Testing.
-
On the Tests page, next to the test you want to run a load test on, click the Load Test icon.
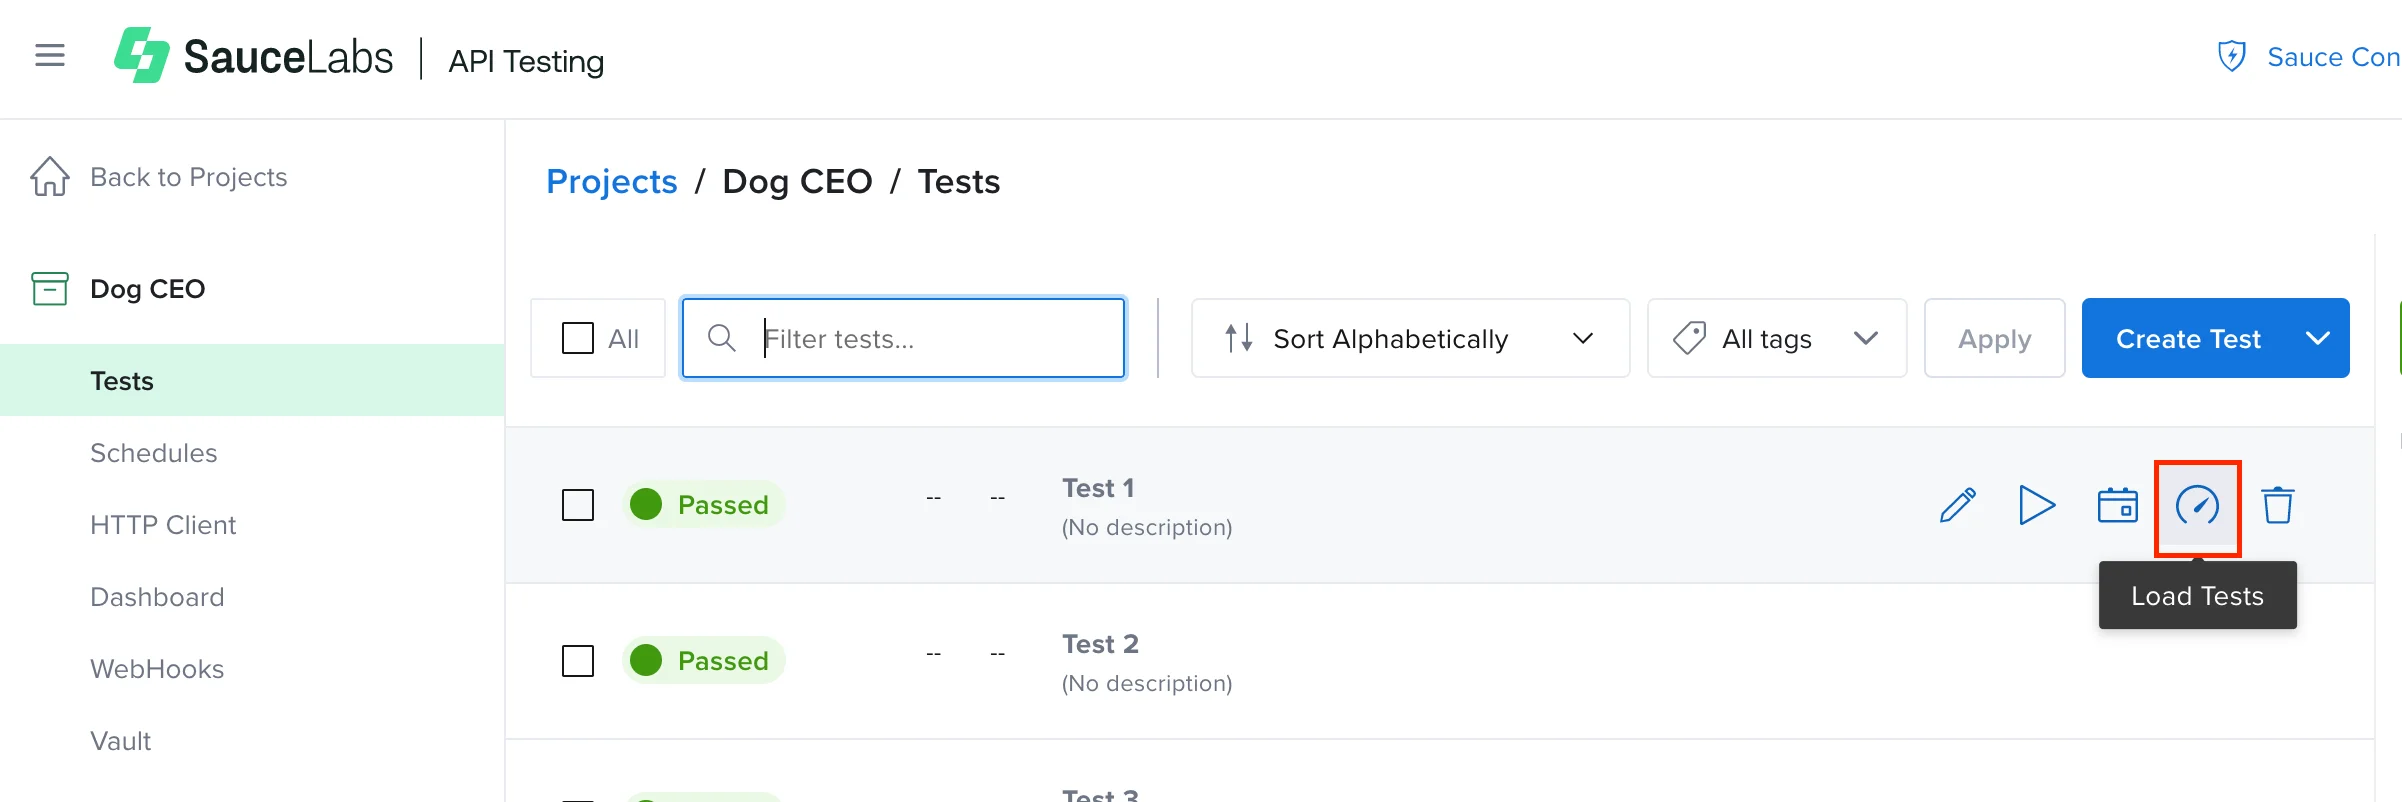
Load testing only works with published tests. If you change a published test, and then run a load test without re-publishing it, the load test will be run on the published version, not the updated one.
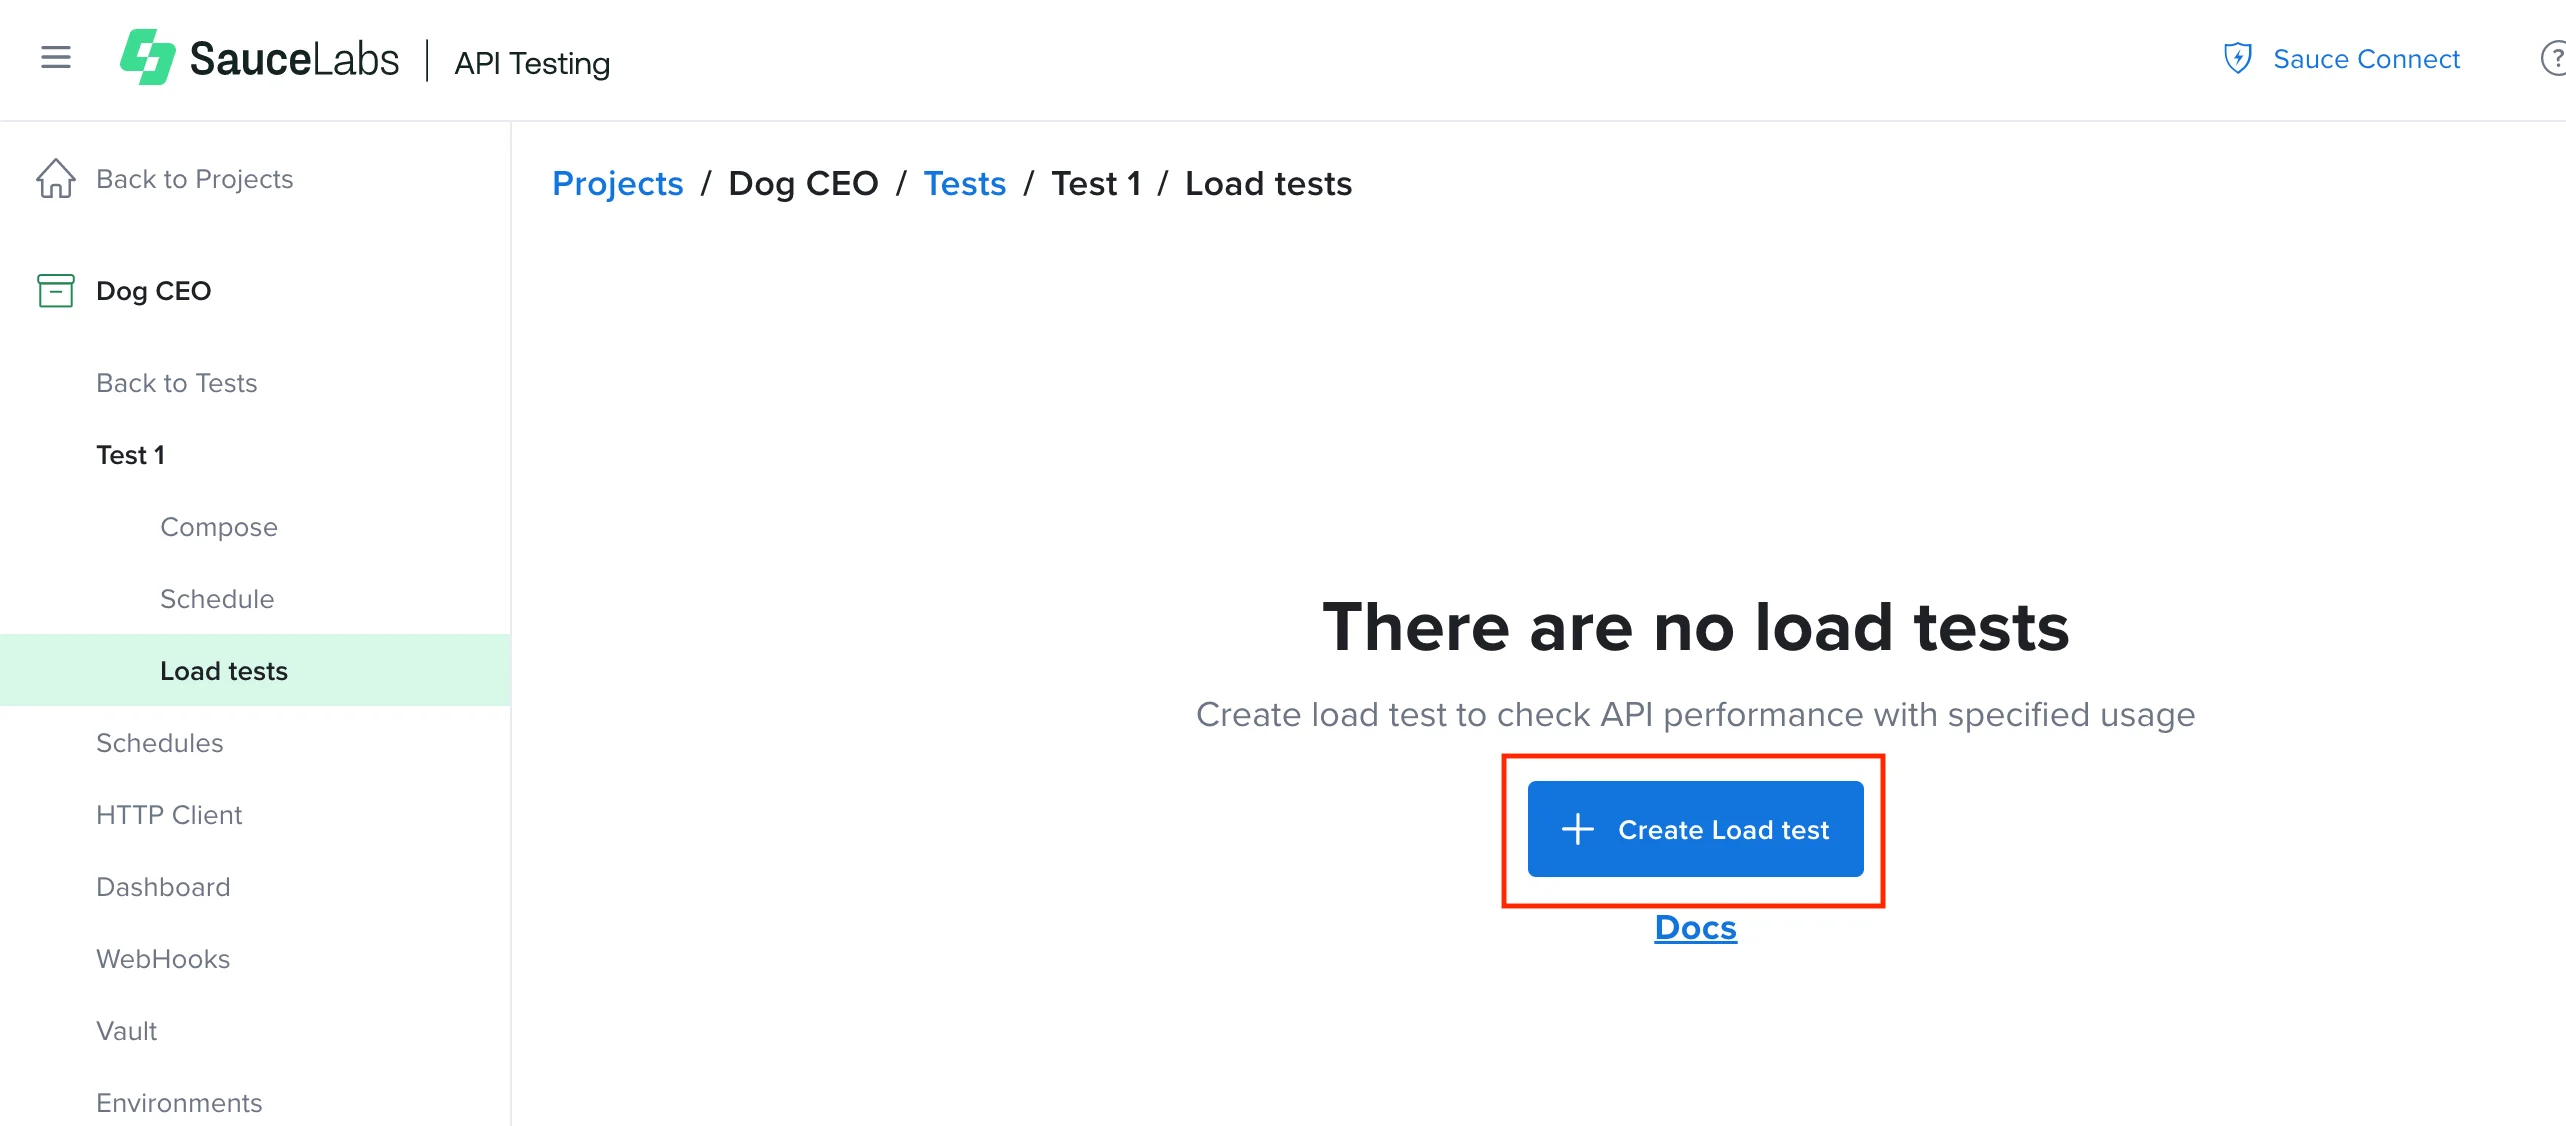
- On the tests page, click Create Load test.
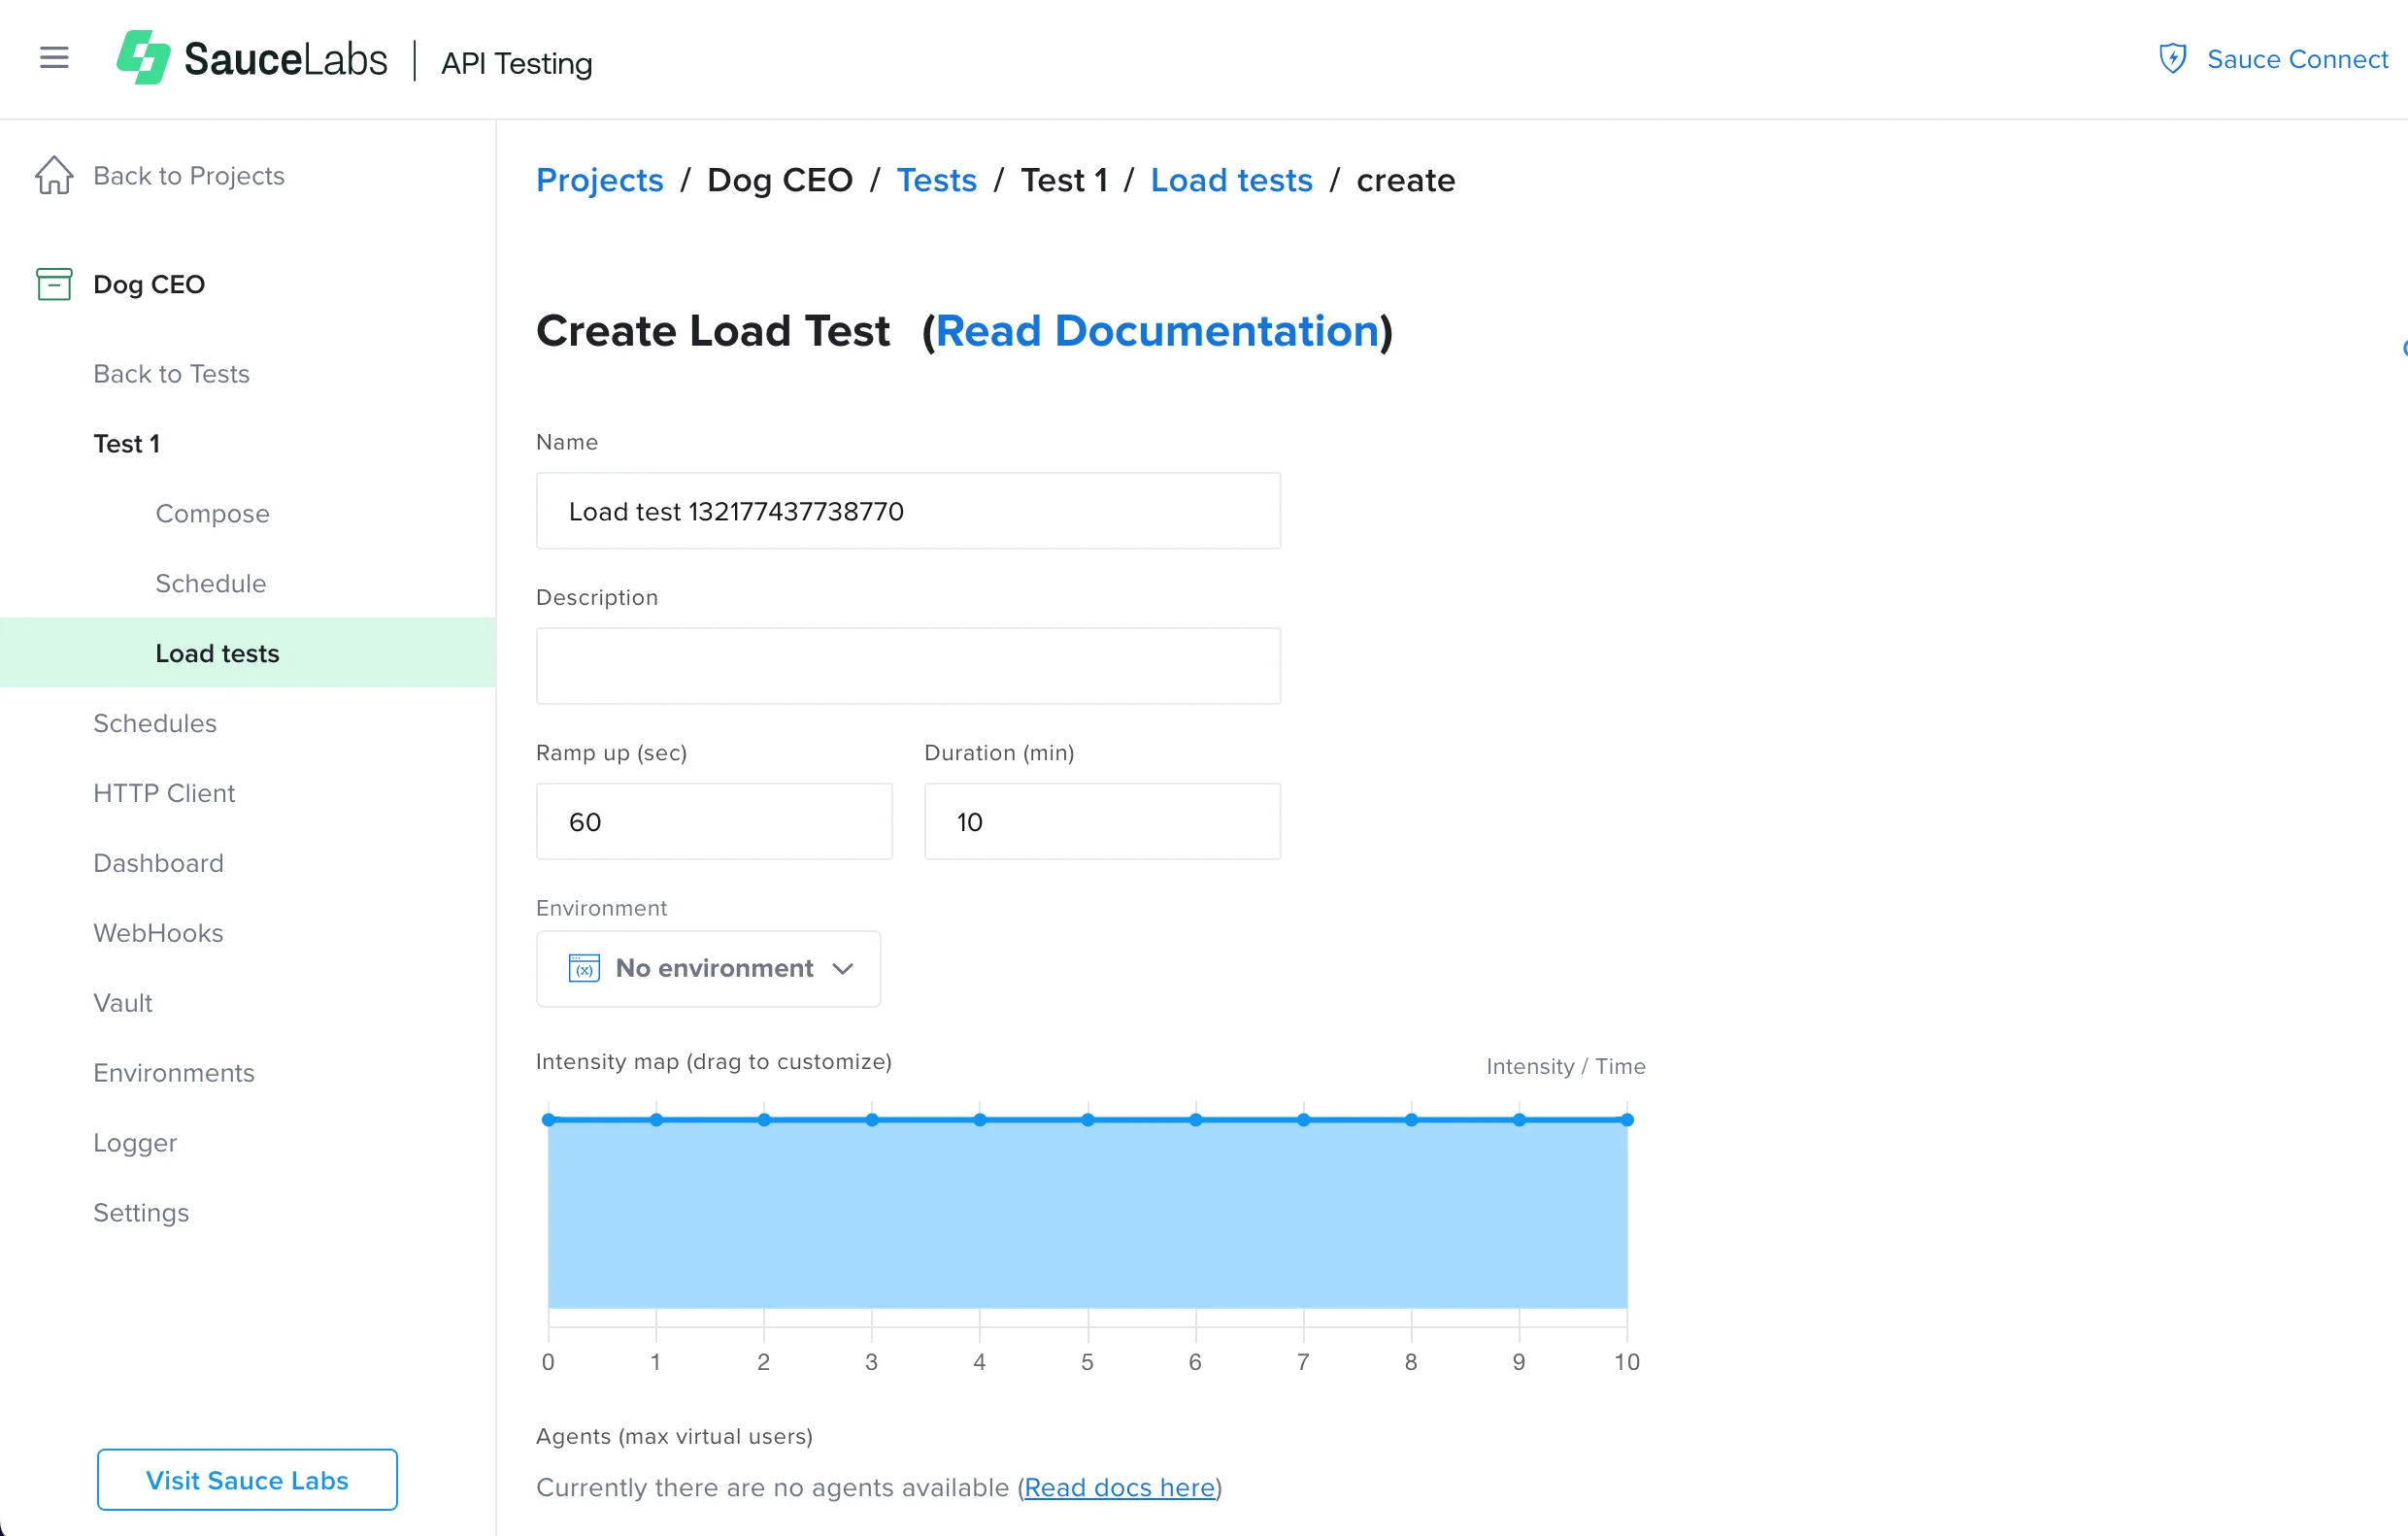
- On the Create Load test page, enter the relevant information for your test:
- Name - The name to assign to the load test profile.
- Description - A description of the test.
- Ramp up - The time the test will take to achieve the maximum engagement. This can be any value (expressed in seconds) less than or equal to the duration.
- Duration - The time to stress your test (in minutes).
- Intensity map - Here you can set up the aggressiveness of the virtual users. Each virtual user will repeatedly execute the provided test. At intensity 100, it will relentlessly start a new cycle right after a cycle is completed. As you lower the intensity, the virtual users will take breaks between cycles. As not all virtual users will complete a cycle at the same time, the breaks will create a more distributed, lower intensity, but same complexity volume of requests.
- Agents - The available agents (pools/workers) and the max virtual users you can set up for each one. This is the only mandatory field without any default, so you need to manually select the agents you want to set up. If these are not set up you will not be able to save or run the test.
If you have saved a load test with an agent that is currently offline, you will see an alert and the system will prevent you from running the test with it. You will see the same alert if you are trying to use the same agent for more tests but there are no virtual users available.
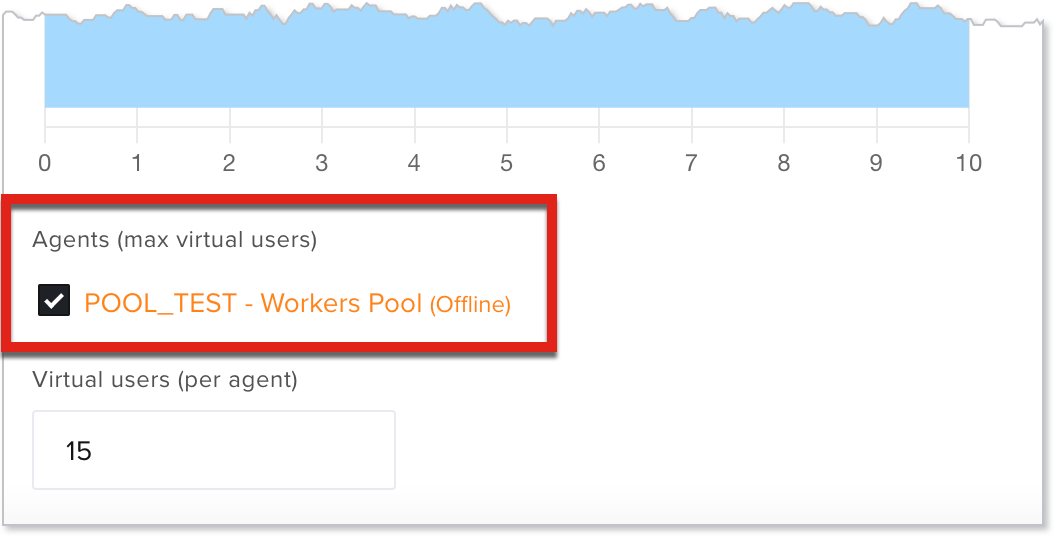
- Virtual users - The number of active users per agent you want to simulate. The value can be any value that is less than or equal to the max virtual users available for that agent. If more than one agent is selected, the lesser virtual users value is the max number of virtual users you can set up. If you try to set more agents than the available you will see an error message.
- Environments - The environment dropdown allows you to select an environment to run the load test with or, if you haven't one already, you can create a new one. For more information, see Creating Environments for Tests.
Variables and snippets in the Vault (Company/Project) are used by default, without the need to select them.
You can set up multiple profiles for each test, from less aggressive to very aggressive, or with varying durations. The only limitations are those inherited from your infrastructure.
- Click Save and Run.
Once you have created and saved a load test, the configuration will be saved for future use. To access the list of previously saved configurations for a specific test, click the load test icon in the test list.
Load Test Reports
The execution of a load test will generate a real-time report that is updated every minute. To stop a report before it is complete, click Stop.
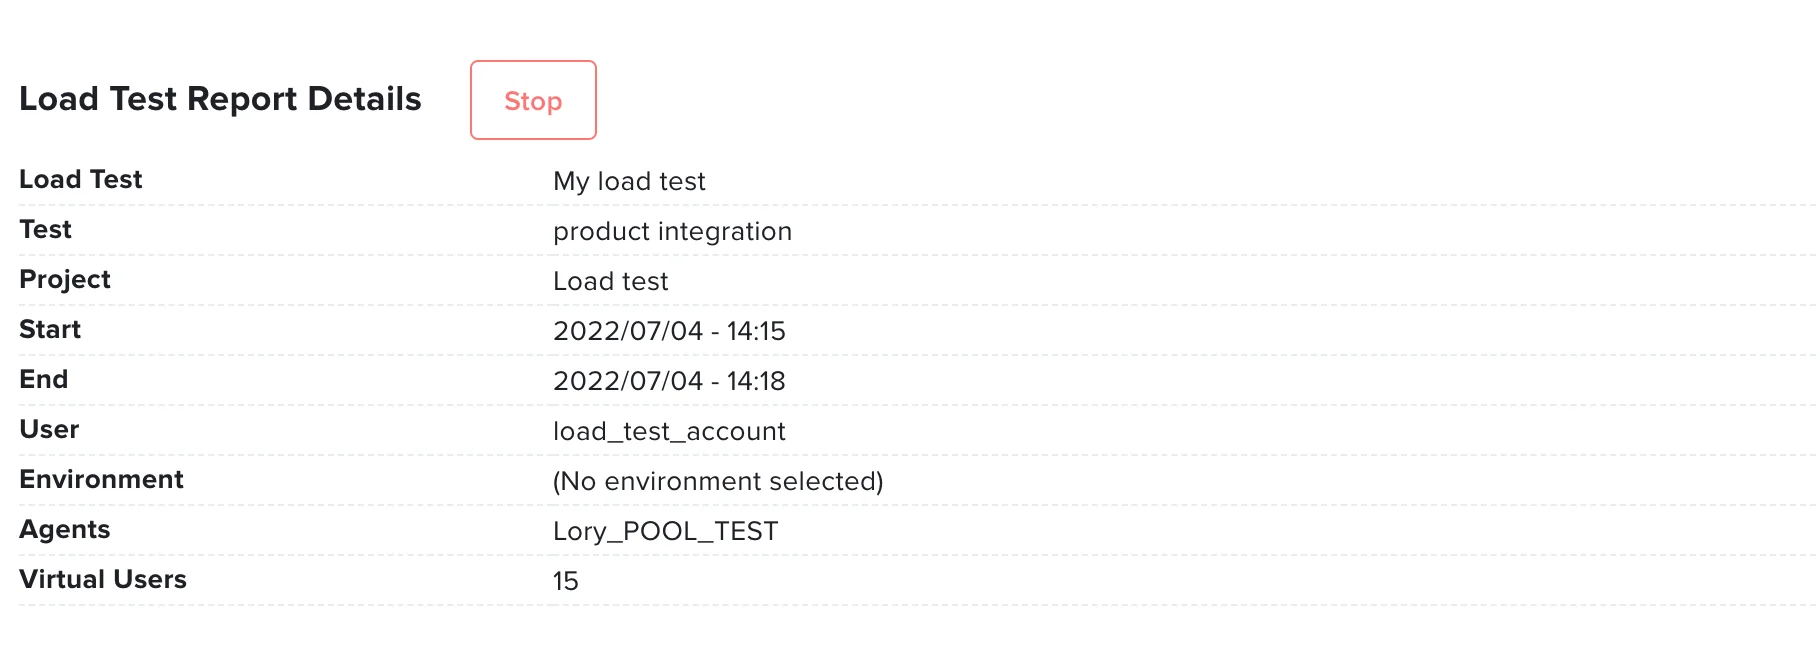
Load test reports include the following details:
- Outcome - The status of the test:
- Running - The test is running.
- Stopped - The test has been stopped manually.
- Completed - The test is complete.
- Load Test - The name of the load test (assigned at creation).
- Test - The name of the test you are running the load test on.
- Project - The project that contains the test.
- Start - The start date and time of the test.
- End - The end date and time of the test.
- User - The user that executed the test.
- Environment - The environment selected for running the test (if any).
- Agents - The agents used to run the test.
- Virtual Users - The number of virtual users for the execution of the test.
- Failed Tests - The number of load test execution failures. This will only be visible if there were failures.
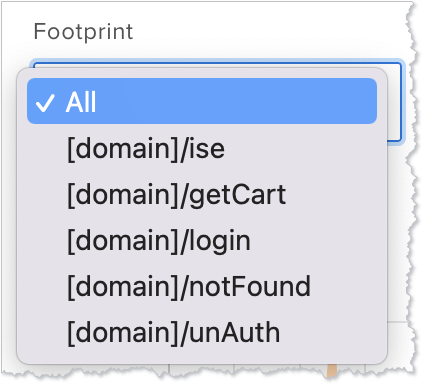
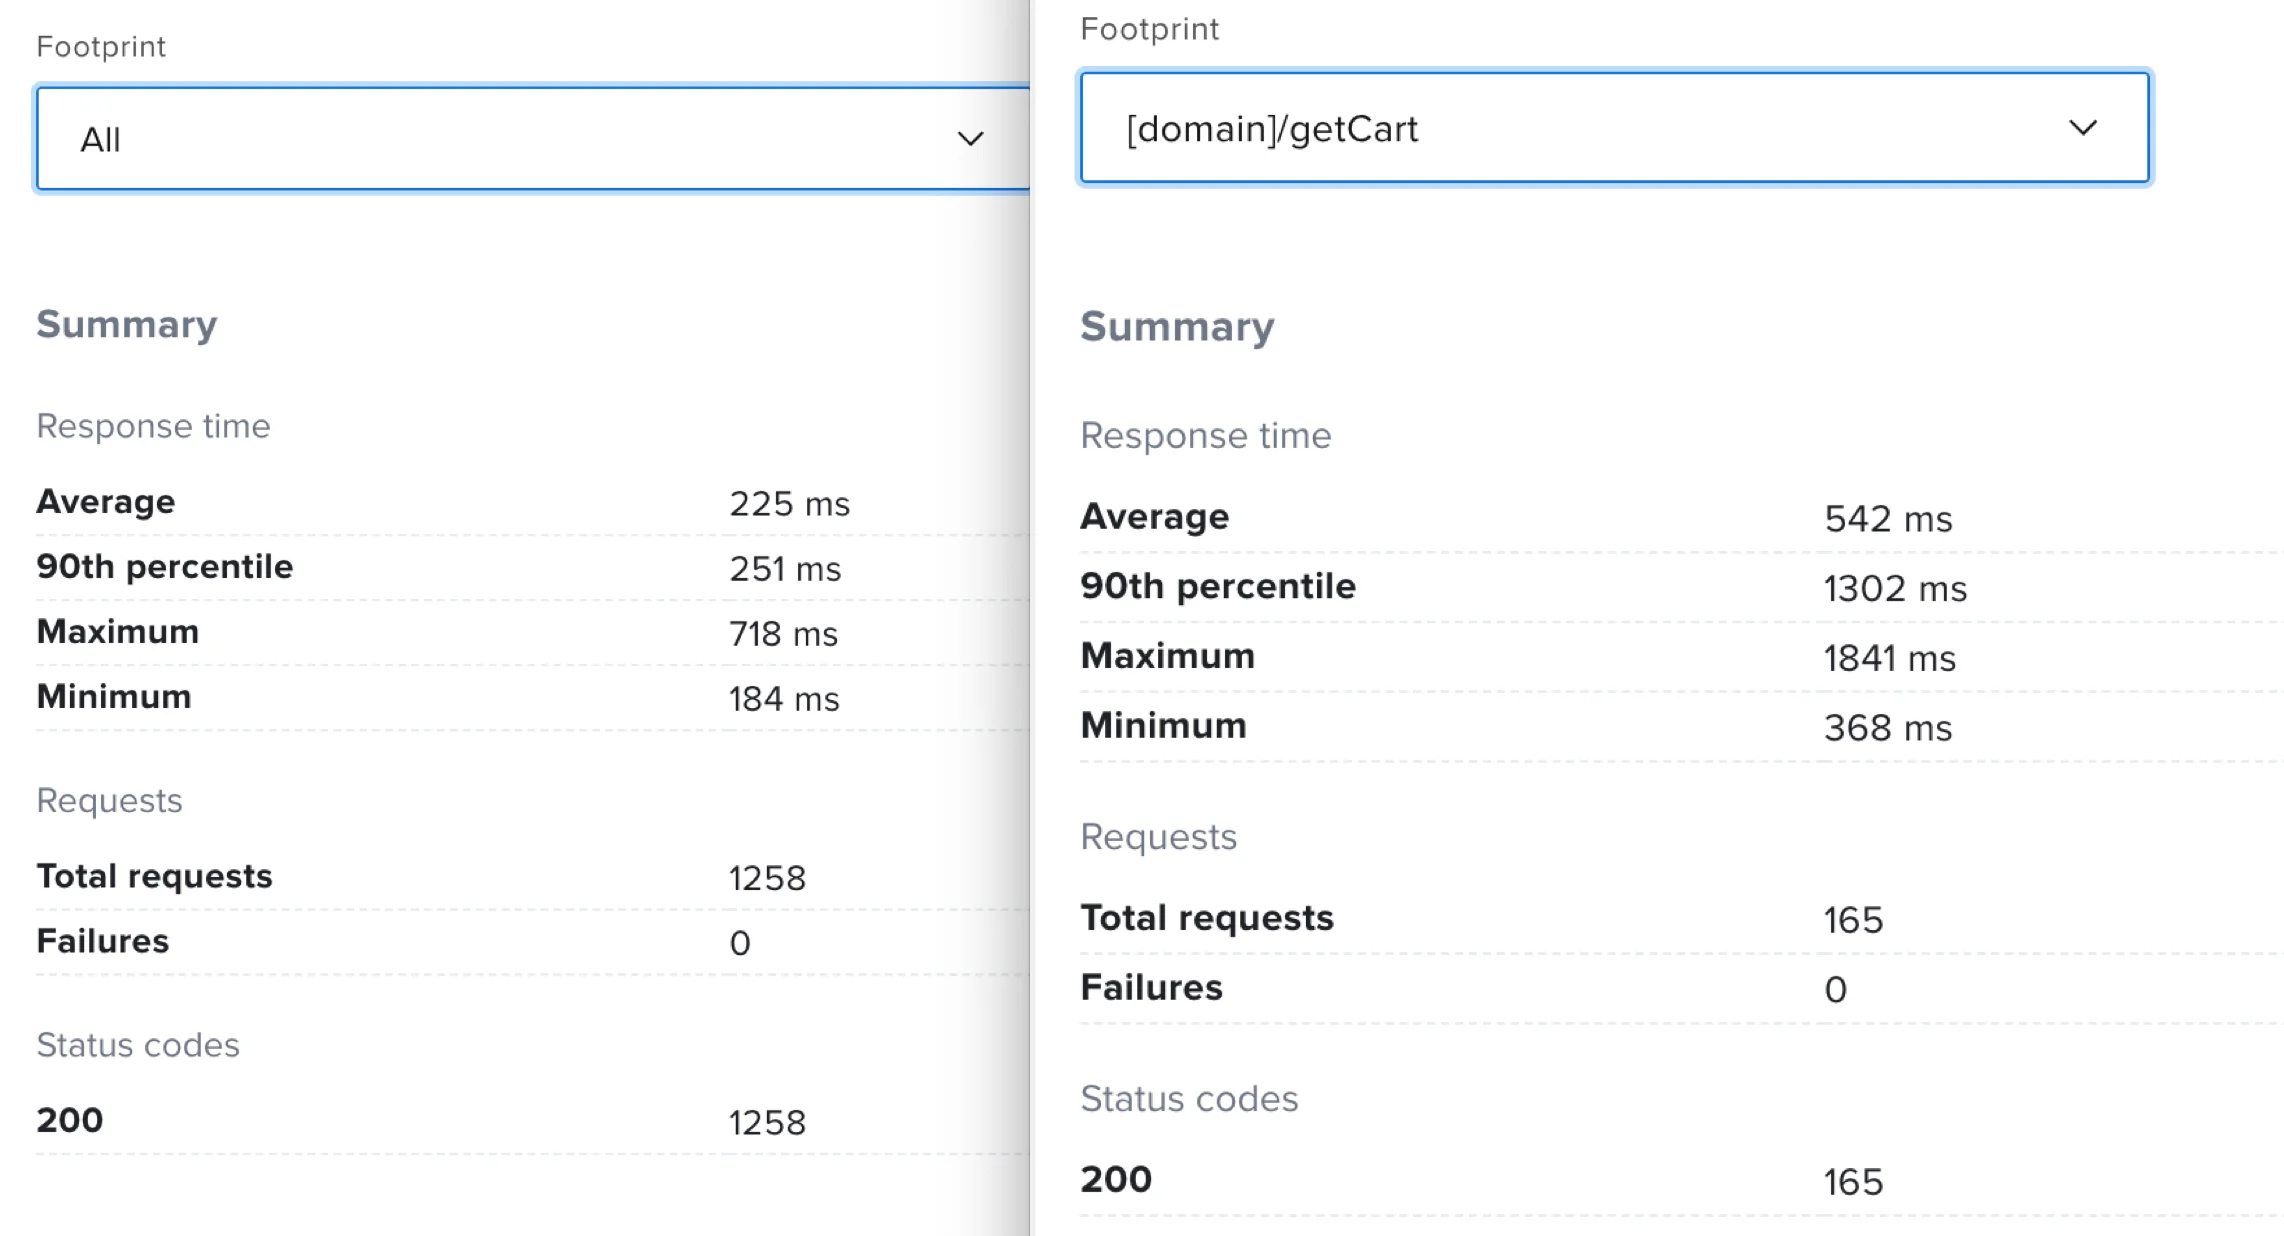
The Footprint dropdown shows all the endpoints the test is calling, which you can use to filter to a specific endpoint. The default value shows the data for All the endpoints. For best results, set up footprints to ensure the report is readable. For more information, see Improving Metrics.
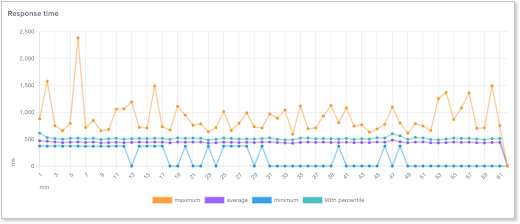
The Summary dynamically shows totals of Response time (Average, 90th percentile, Maximum, and Minimum), Requests (Total requests and Failures), and Status codes based on the selected Footprint.
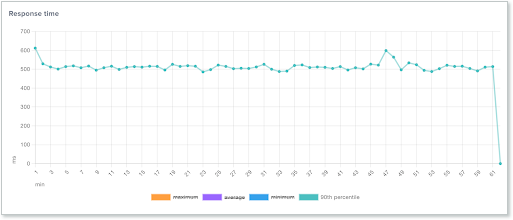
The Response time graph shows the response time for all endpoints or for a specific endpoint. In the graph, you can see the maximum, minimum, average, and the 90th percentile. Once the test is complete, you can click any of the report measurements to remove them from the display.
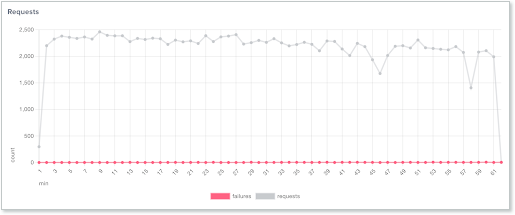
The Requests graph shows the number of requests and the number of failures. Click any of the measurement labels to remove them from the display.
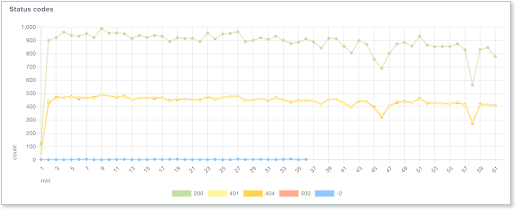
The Status codes graph shows the status codes the test has generated, as well as any connection codes, which are denoted with a negative number.
Negative status codes represent connectivity issues:
- -1 - Connection refused
- -2 - Timeout
- -3 - Unknown host
Click any of the measurement labels to remove them from the display.
The data inside each graph can be downloaded in a CSV file. If the footprint is set to All, the file will contain the data for all endpoints; if a specific footprint is selected, the file will contain the data for only that endpoint.
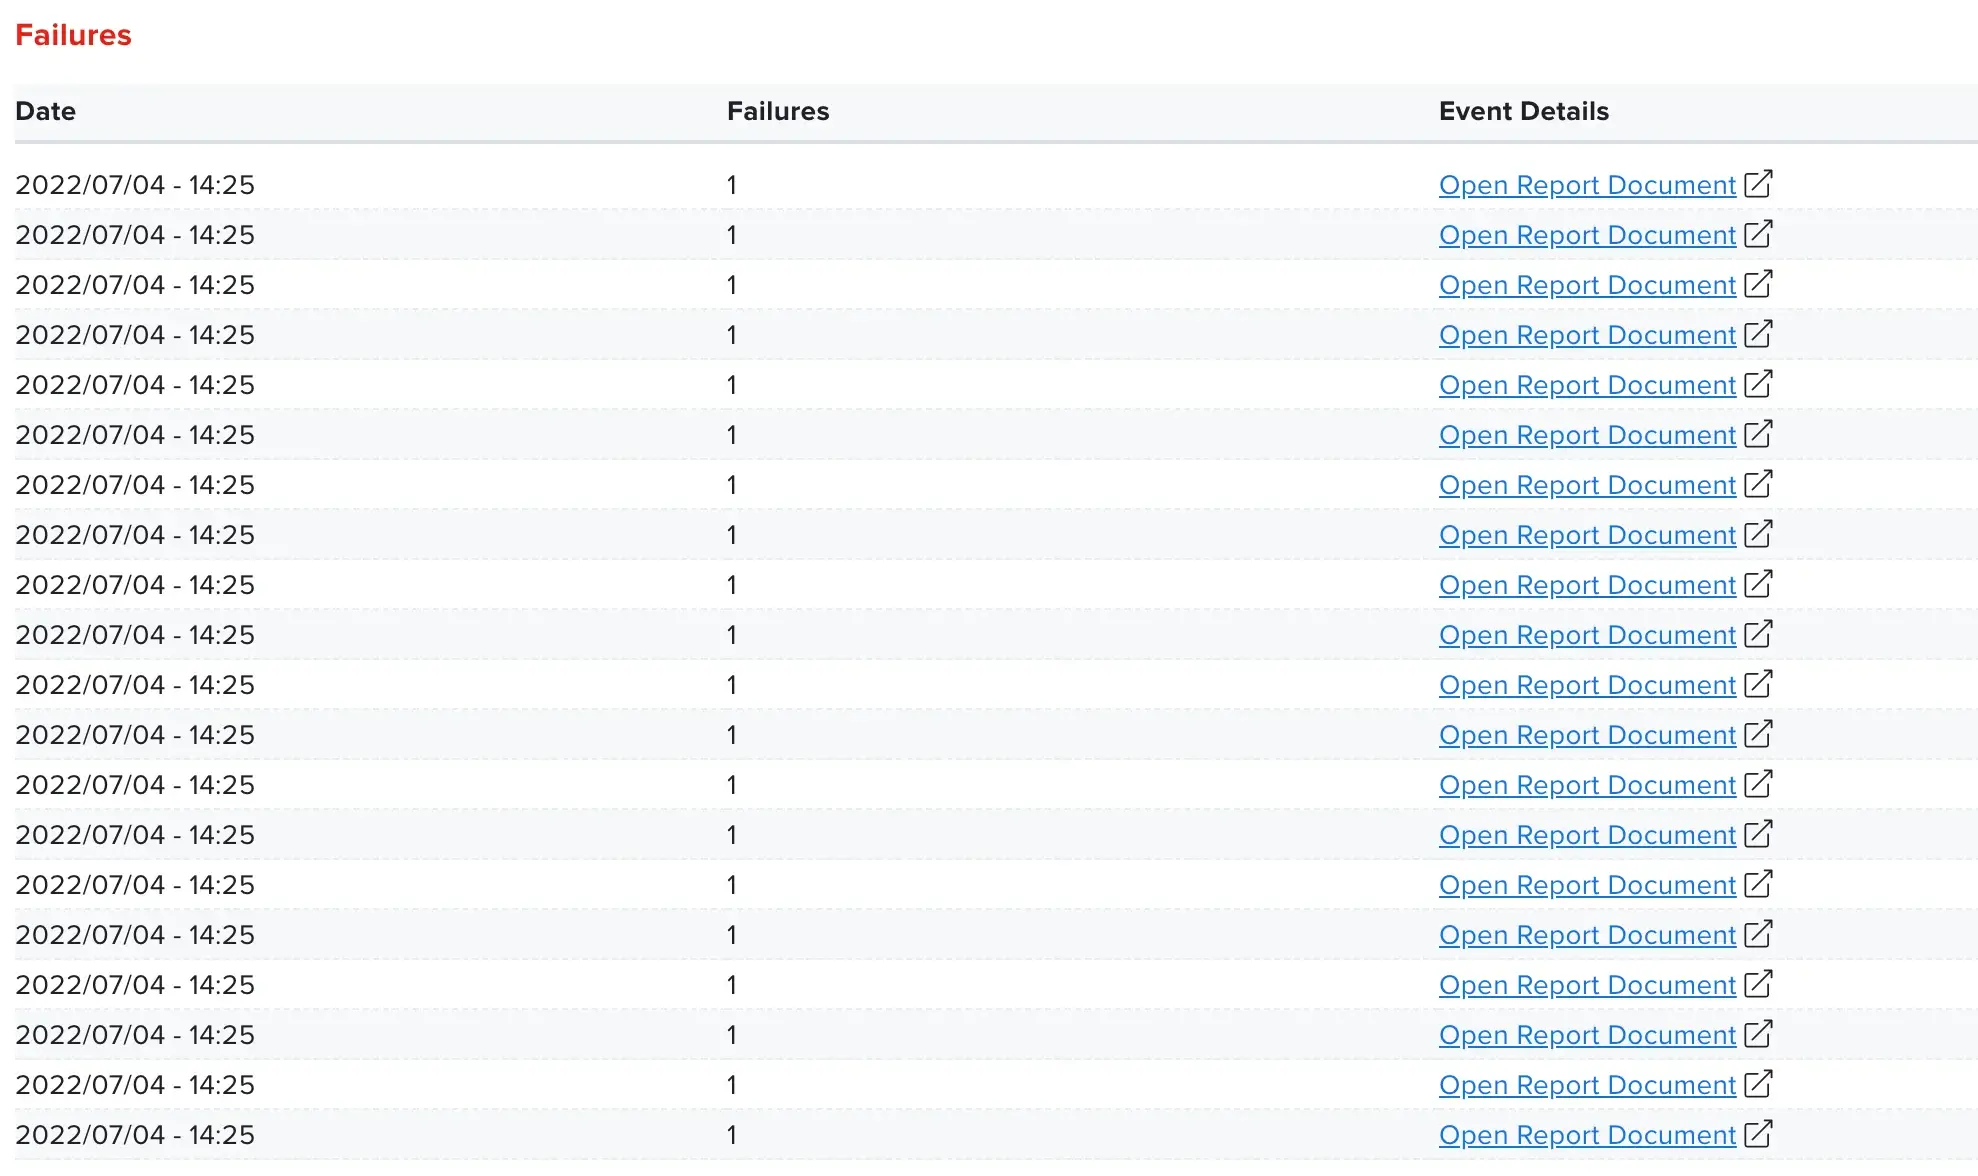
Once the test is completed, the Failures section will be shown at the bottom of the report. In this section, you will see the 100 most recent failures that occurred during the test. There will be one row for each test execution, and each row includes the date and time, the number of failures, and a link to the specific report for that failure.
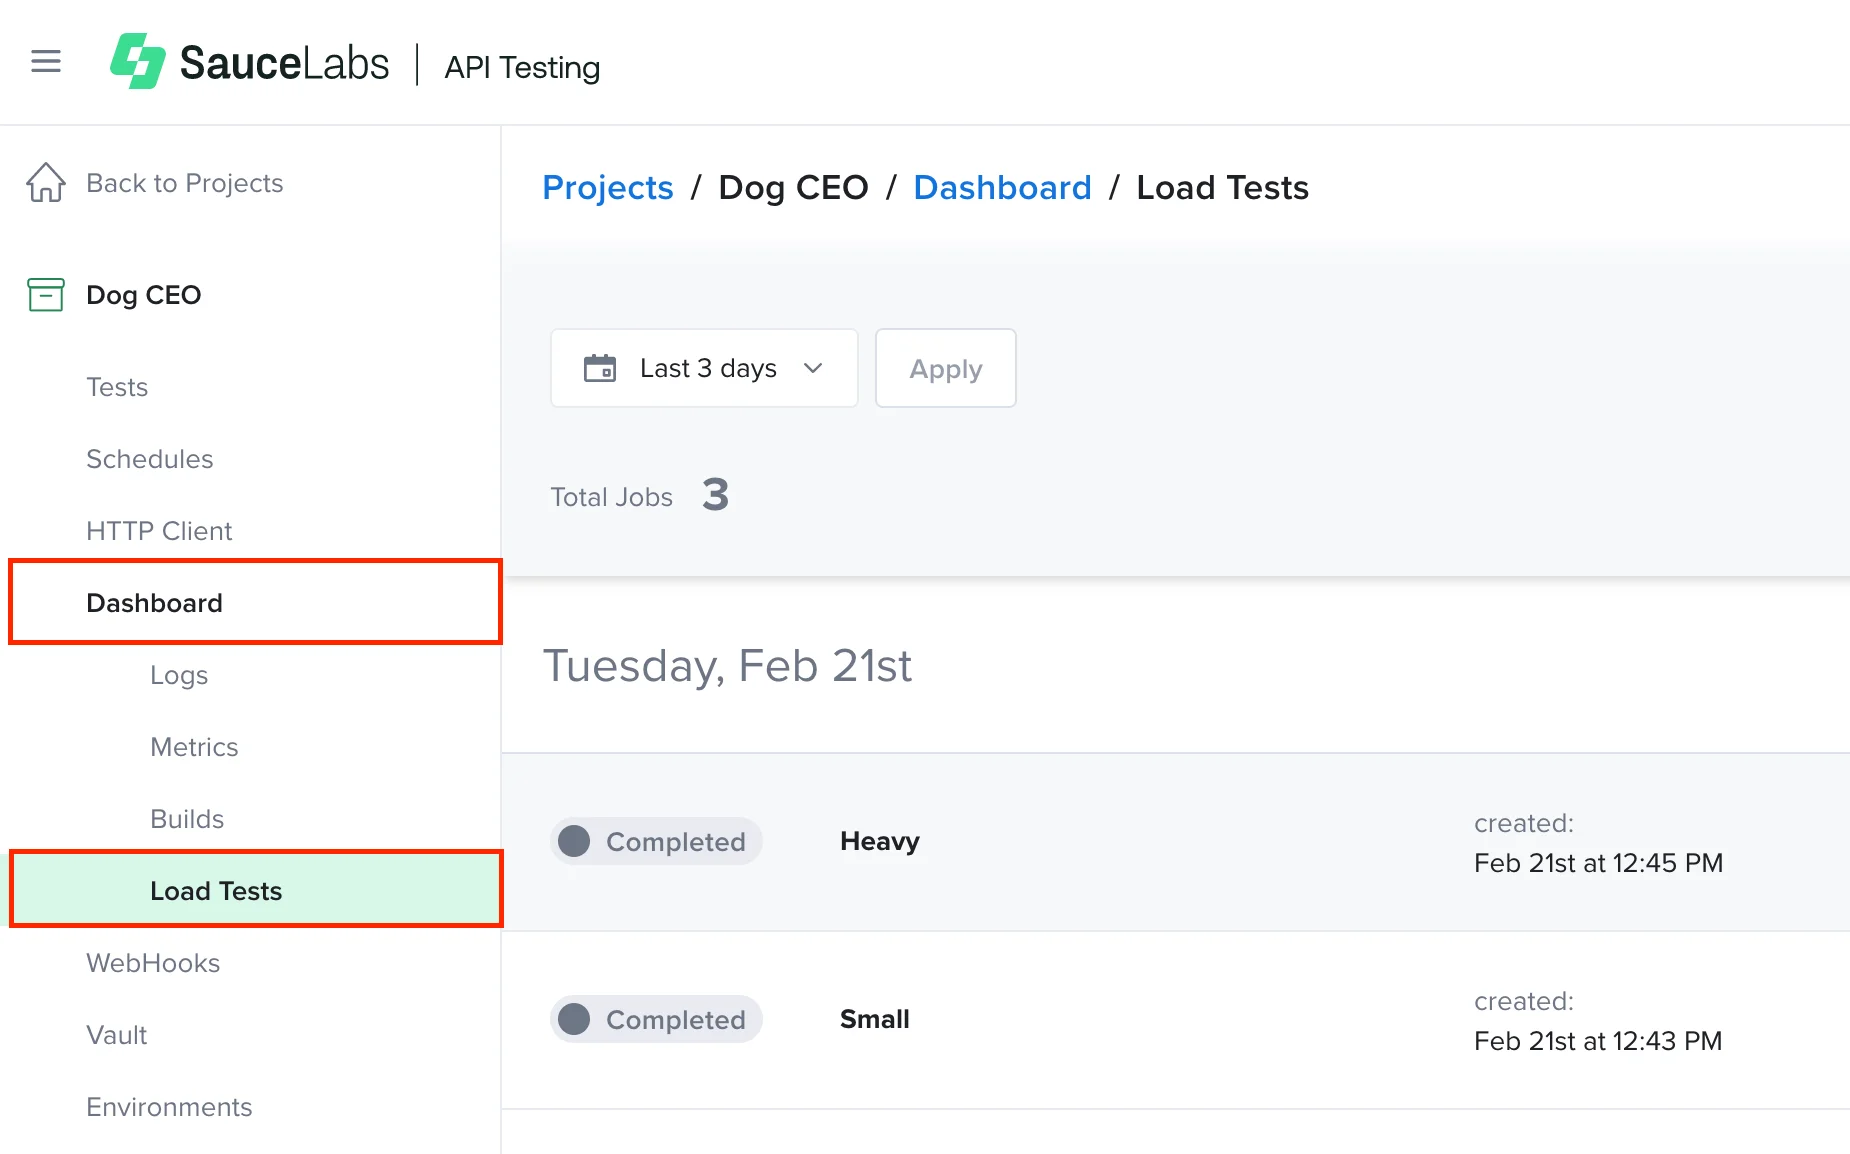
Load test reports can be accessed on the project dashboard under Load Tests.