Using the Project Dashboard
After you run an API Test, you can view your results, reporting, and analytics to gain further insight and maximize your testing.
What You'll Need
- A Sauce Labs account (Log in or sign up for a free trial license).
- An existing API Test that's been run. For details on how to create one, see the Quickstart.
Test Outcome Report
The Test Outcome Report includes input data details and other useful test information, such as reasons for failure, HTTP requests, and response status codes.
There are three ways to access it:
- From your Project's Tests section, click on any Test line item
- From your Project's Dashboard section, click on any Test line item
- From your Test's Compose section, in the right-hand nav.
Viewing Results
Here's a breakdown of what each report contains:
Test Report Details: metadata about the execution of the test, such as Test Name, Project Name, and Mode (Scheduled or On Request)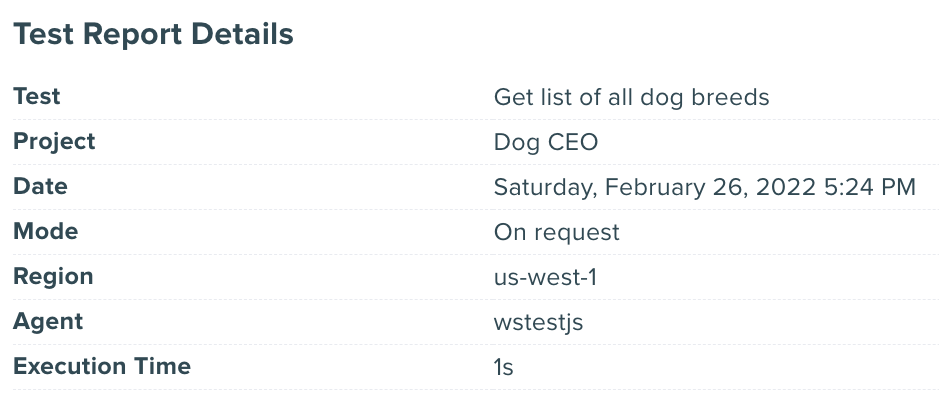
Outcome (pass/fail status):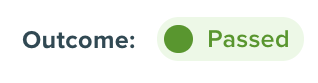
Assertions: your Test assertions, where a gray dot indicates a pass, red dot indicates a fail, and yellow dot indicates a warning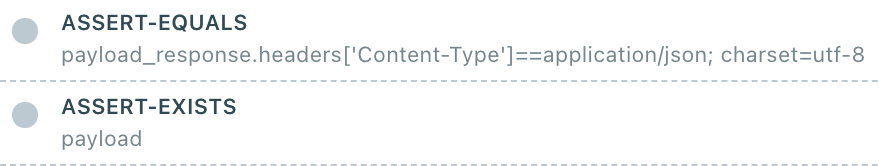
Request Components: shows the specific component(s) that you tested.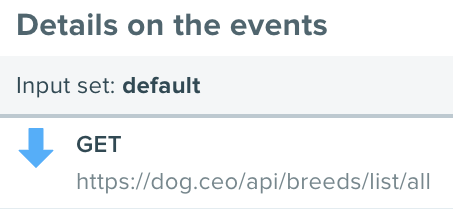
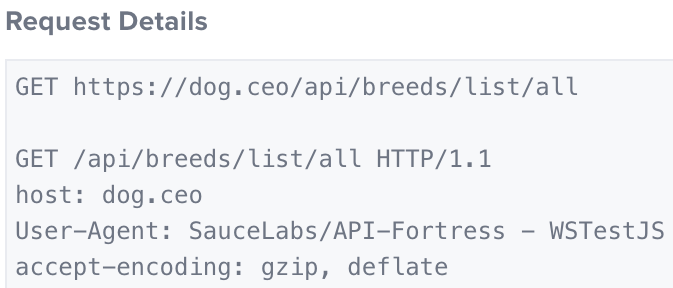
Stack Details: click this to view granular details about requests and headers.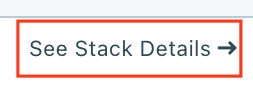
Dashboard
The API Testing Dashboard — accessible from a Project — displays metrics, logs, builds, and load tests, a centralized test management tool that simplifies collaboration and reporting.
Test Logs
- Log in to Sauce Labs, then click API Testing.
- Click on any Project.
- Click the Dashboard tab.
- Select the Logs tab.
- Select desired filters to find the Test(s) you're looking for, then click Apply.
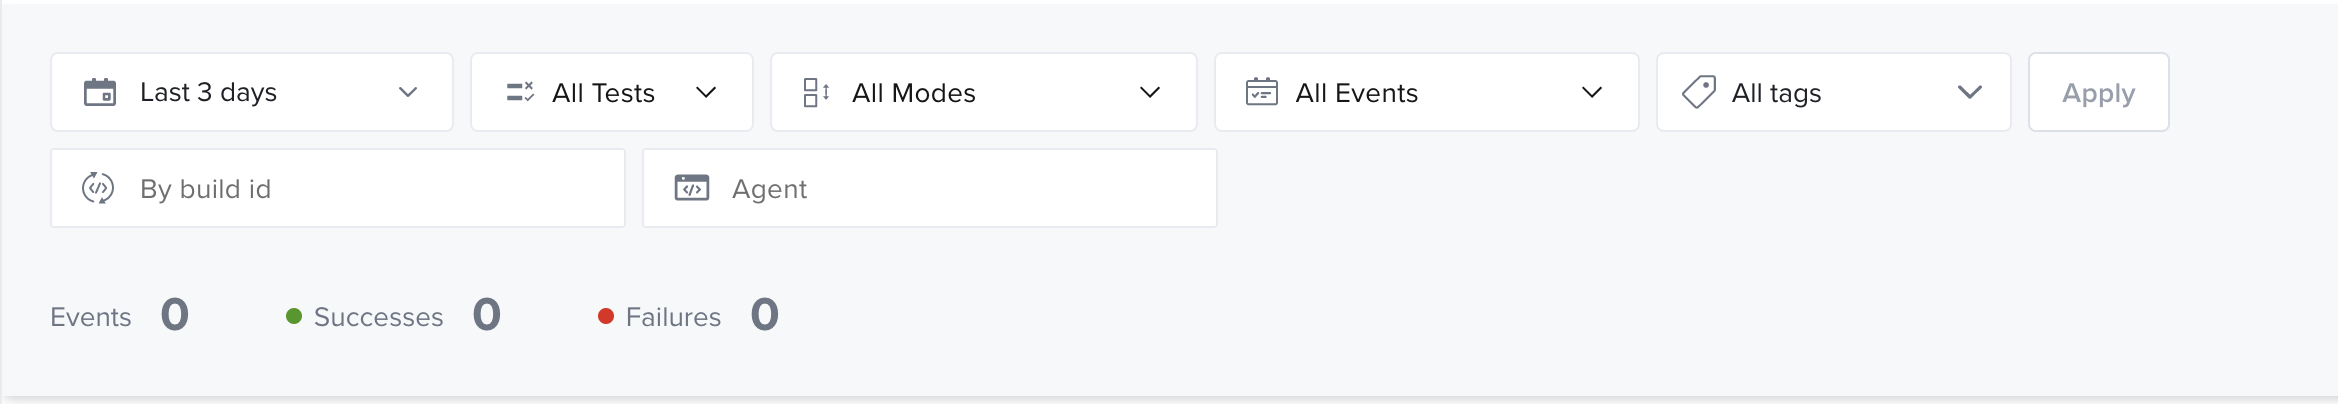
| Filter | Description |
|---|---|
| Date | Filter tests results by:
|
| Test | Filter tests results by a specific test |
| Modes | Filter tests results by tests that are scheduled (monitoring) or executed manually (on-Demand) |
| Events | Filter tests results by all tests or only the ones that failed |
| Tags | Filter tests results by tests that contain one or more specific tag(s) |
| Build id | Filter tests results by tests that belong to a specific build |
| Agent | Filter tests results by the agent that executed the test: wstestjs if the test is executed manually, scheduled, or by API; piestry if the test is executed via the mocking tool |
Test Metrics
To view Test performance metrics (latency and fetch):
- Log in to Sauce Labs, then click API Testing.
- Click on any Project.
- Click the Dashboard tab.
- Select the Metrics tab.
- Select desired filters to find the Test(s) you're looking for, then click Apply.
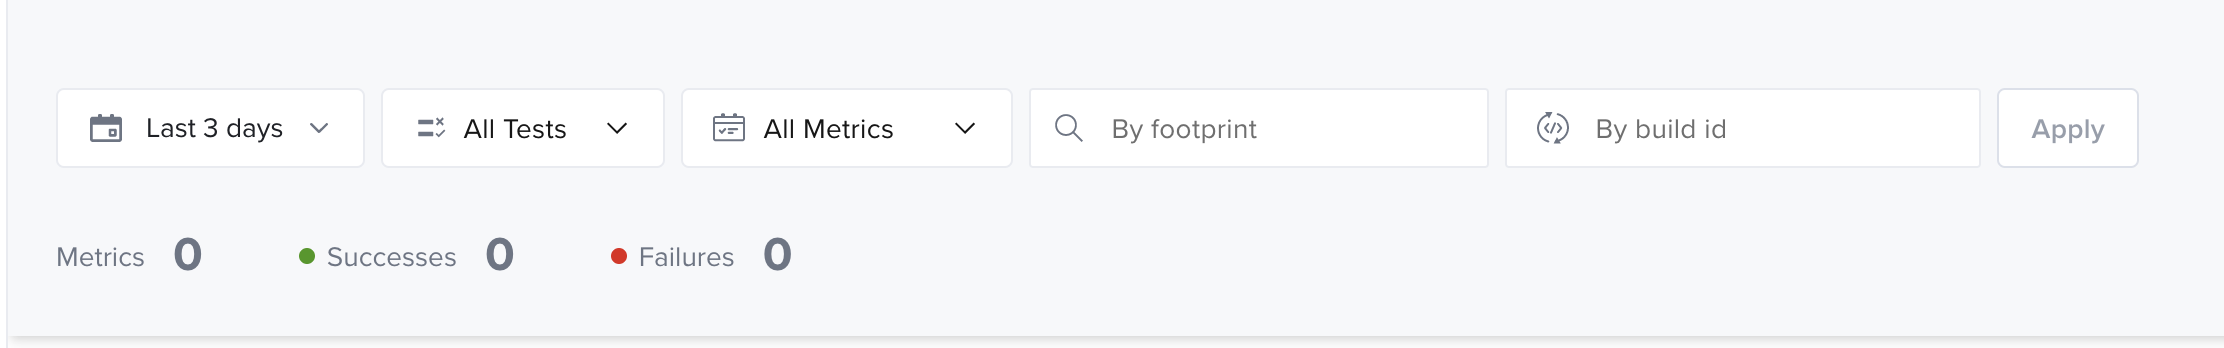
| Filter | Description |
|---|---|
| Date | Filter tests results by:
|
| Test | Filter tests results by a specific test |
| Metrics | Filter tests results by all tests or only the ones that failed |
| Footprint | Filter tests results by a specific request URL |
| Build id | Filter tests results by tests that belong to a specific build |
Test Build Reports
A Build is a collection of test results and metrics associated with a given build ID. To create a Build, you'll need to integrate Sauce Labs API Testing into your CI/CD pipeline, then run multiple tests simultaneously, grouped as a Build, by setting the build value in your config.yml. Sauce API Testing will group all events generated by the Test session under a "build" collector, and test results are collected under Dashboard > Builds. To view:
- Log in to Sauce Labs, then click API Testing.
- Click on any Project.
- Click the Dashboard tab.
- Select the Build tab.
- Set the date and/or build ID filters, if desired, to find the Test(s) you're looking for. Then click Apply.
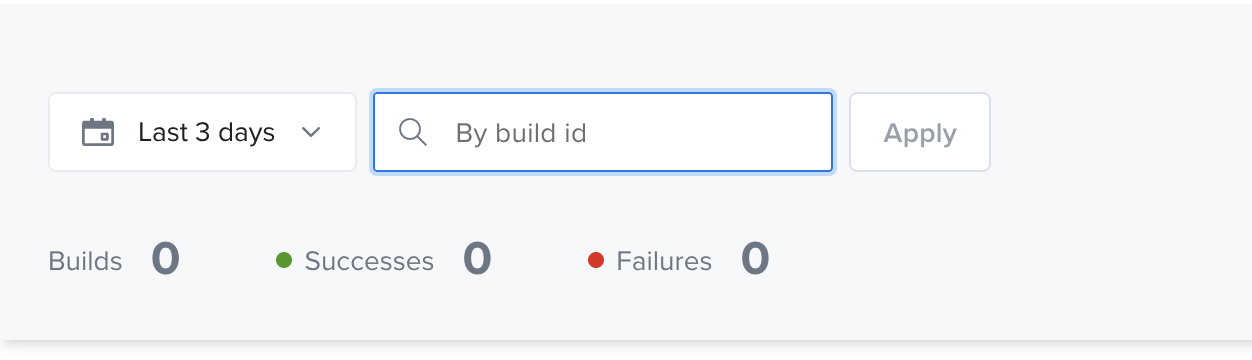
| Filter | Description |
|---|---|
| Date | Filter tests results by:
|
| Build id | Filter tests results by tests that belong to a specific build |
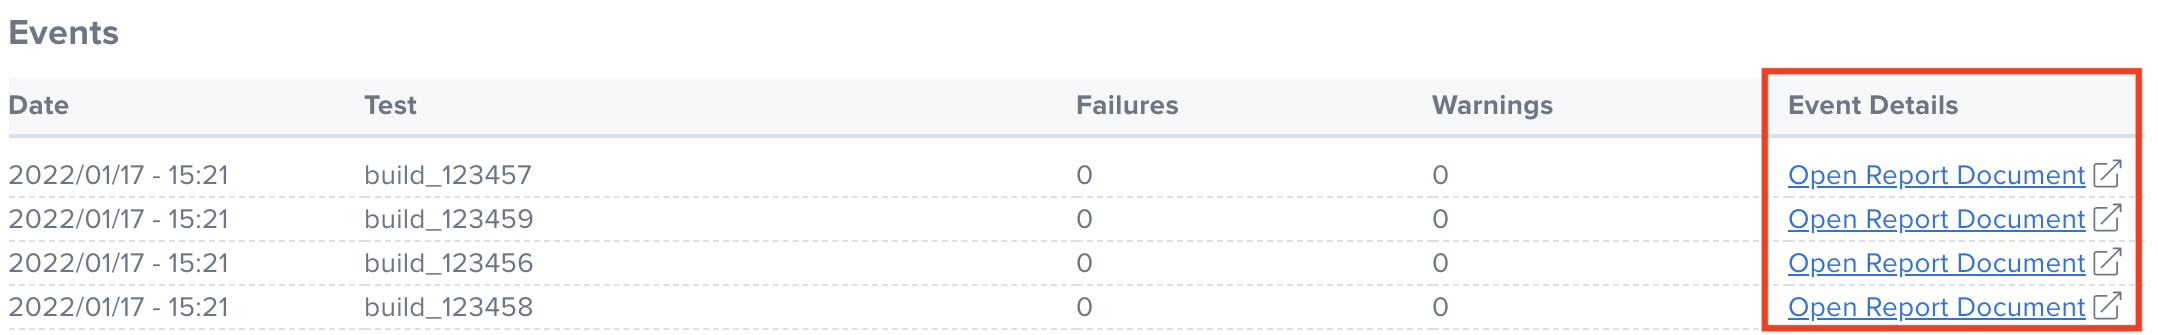
- Click on any line item below to view a summary report for that Build.
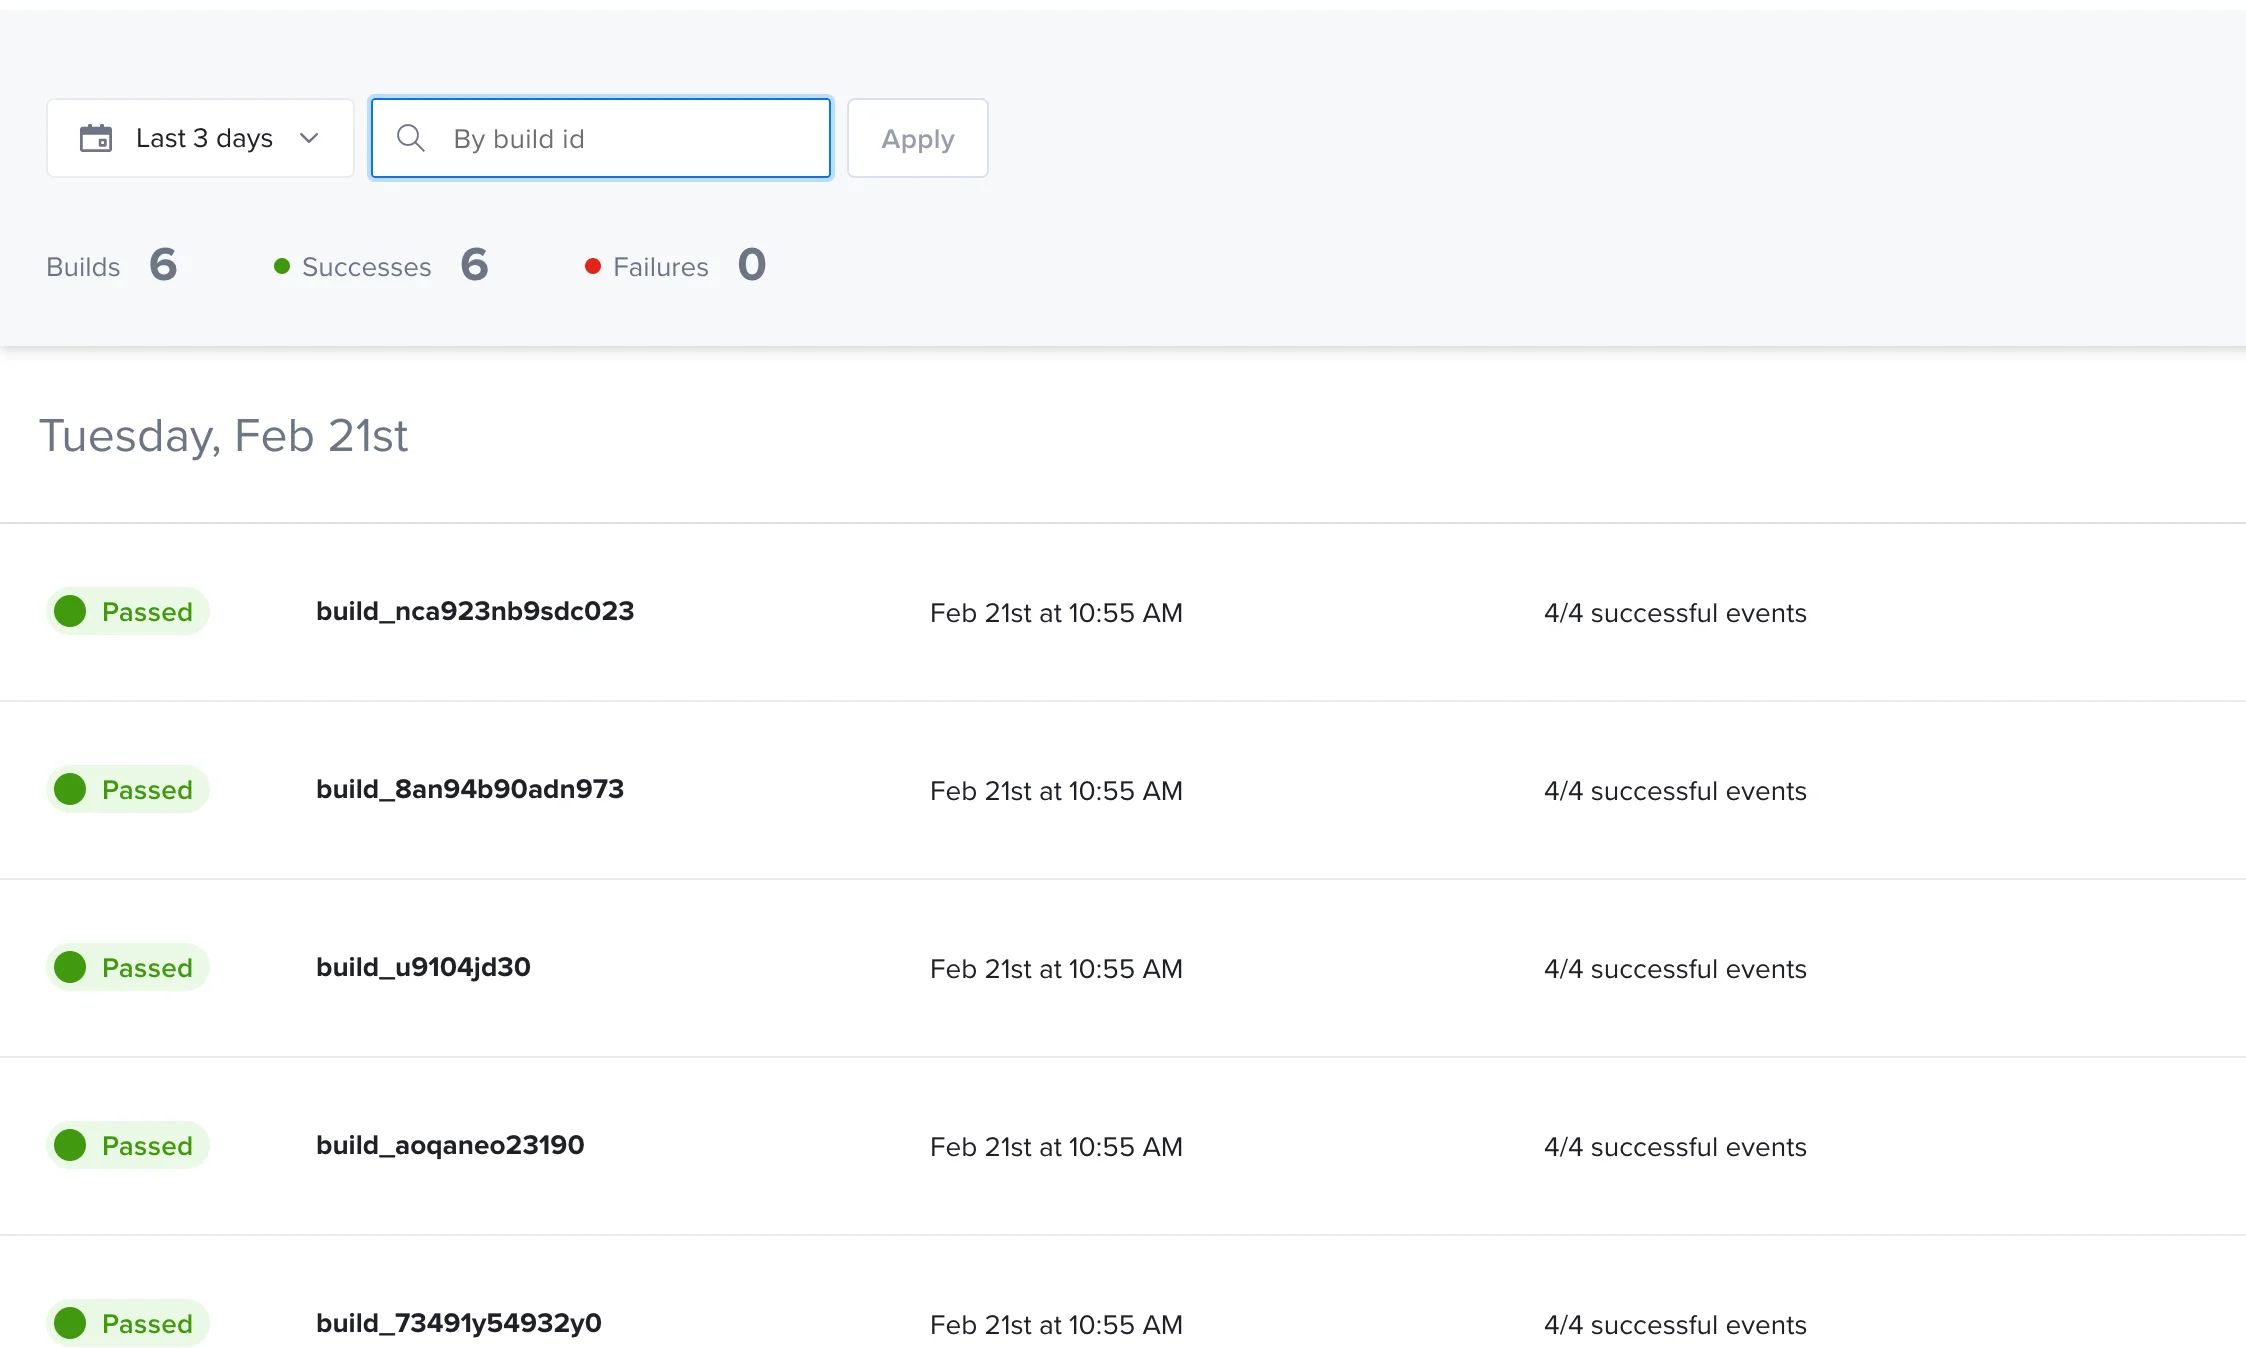
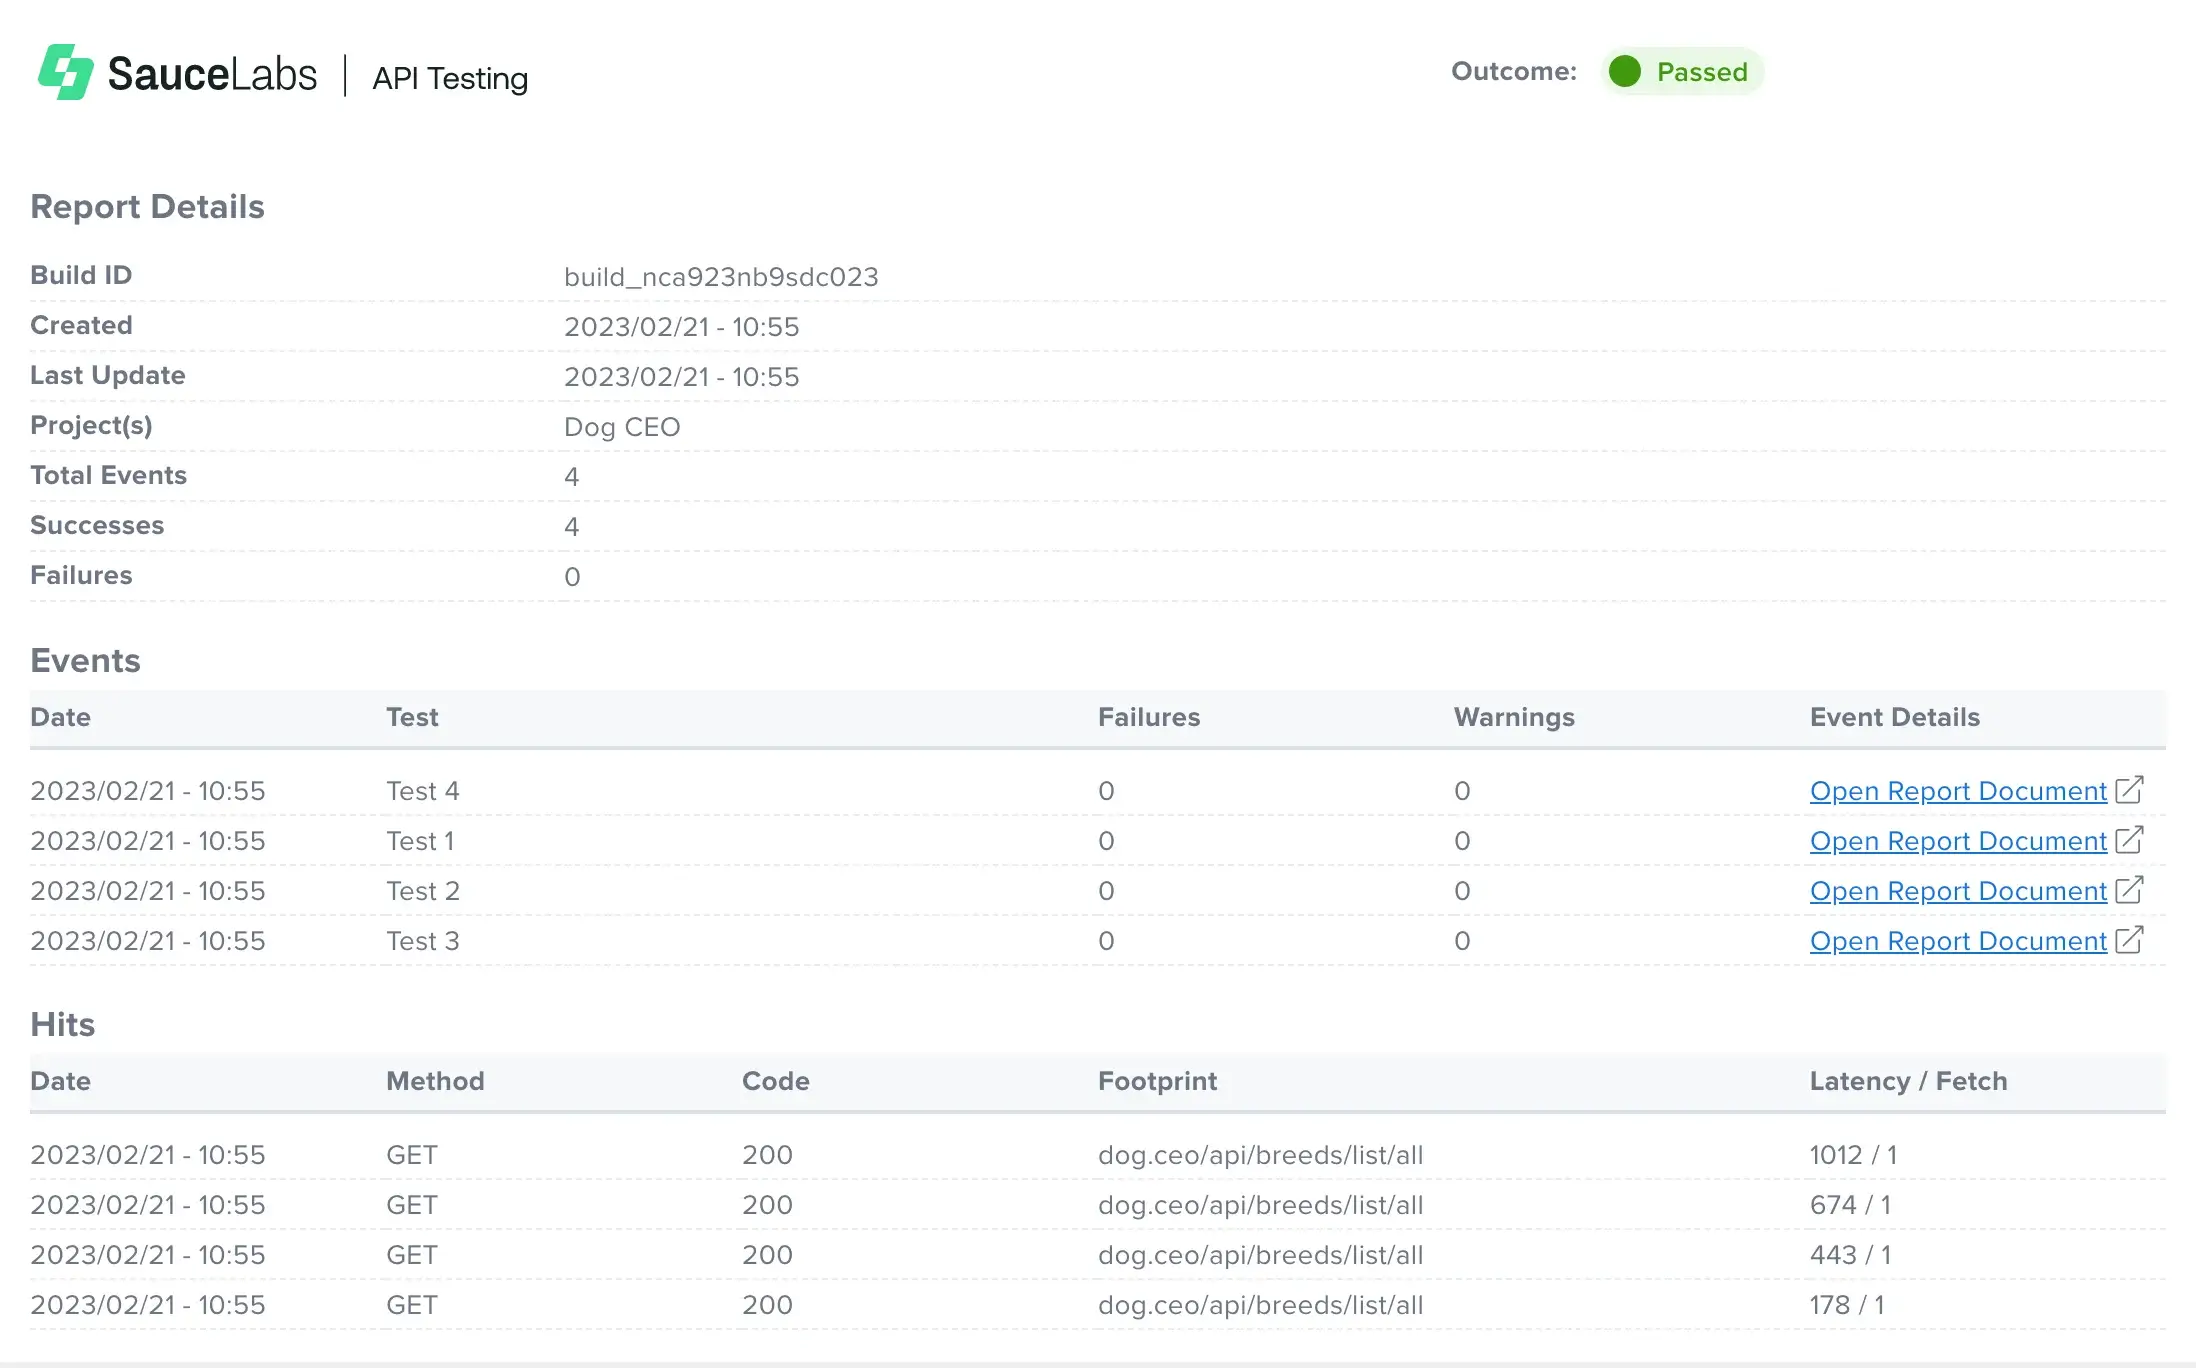 The report contains details such as the build ID, list of Tests belonging to that build, date/time, Projects involved, successful tests, and failed tests.
 - Under the Event Details column, click Open Report Document to see the results and metrics for each specific test that has been executed in the build.